Analyzing Followers Network Report
Updated
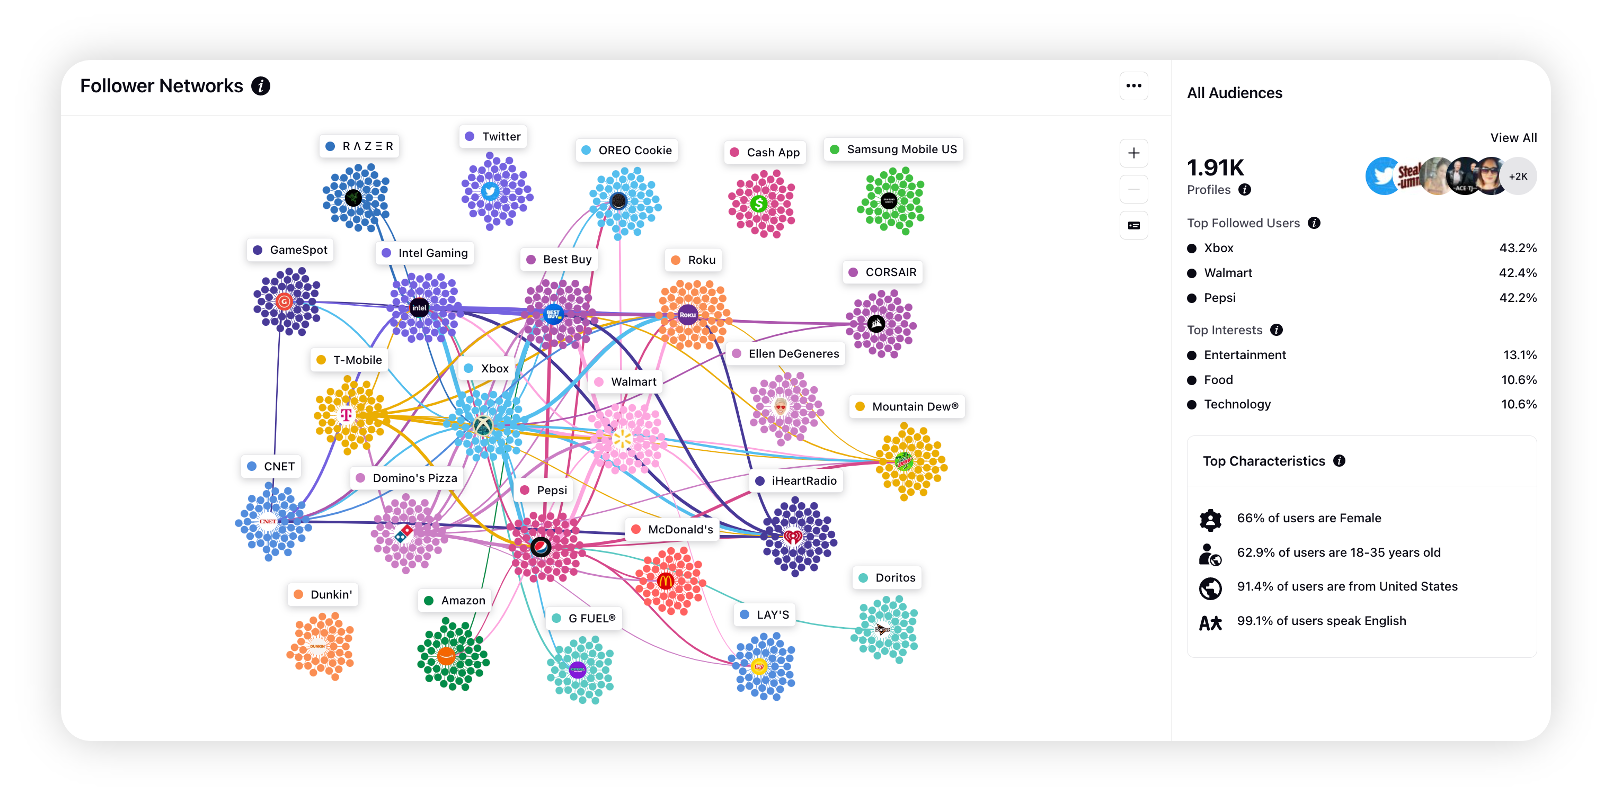
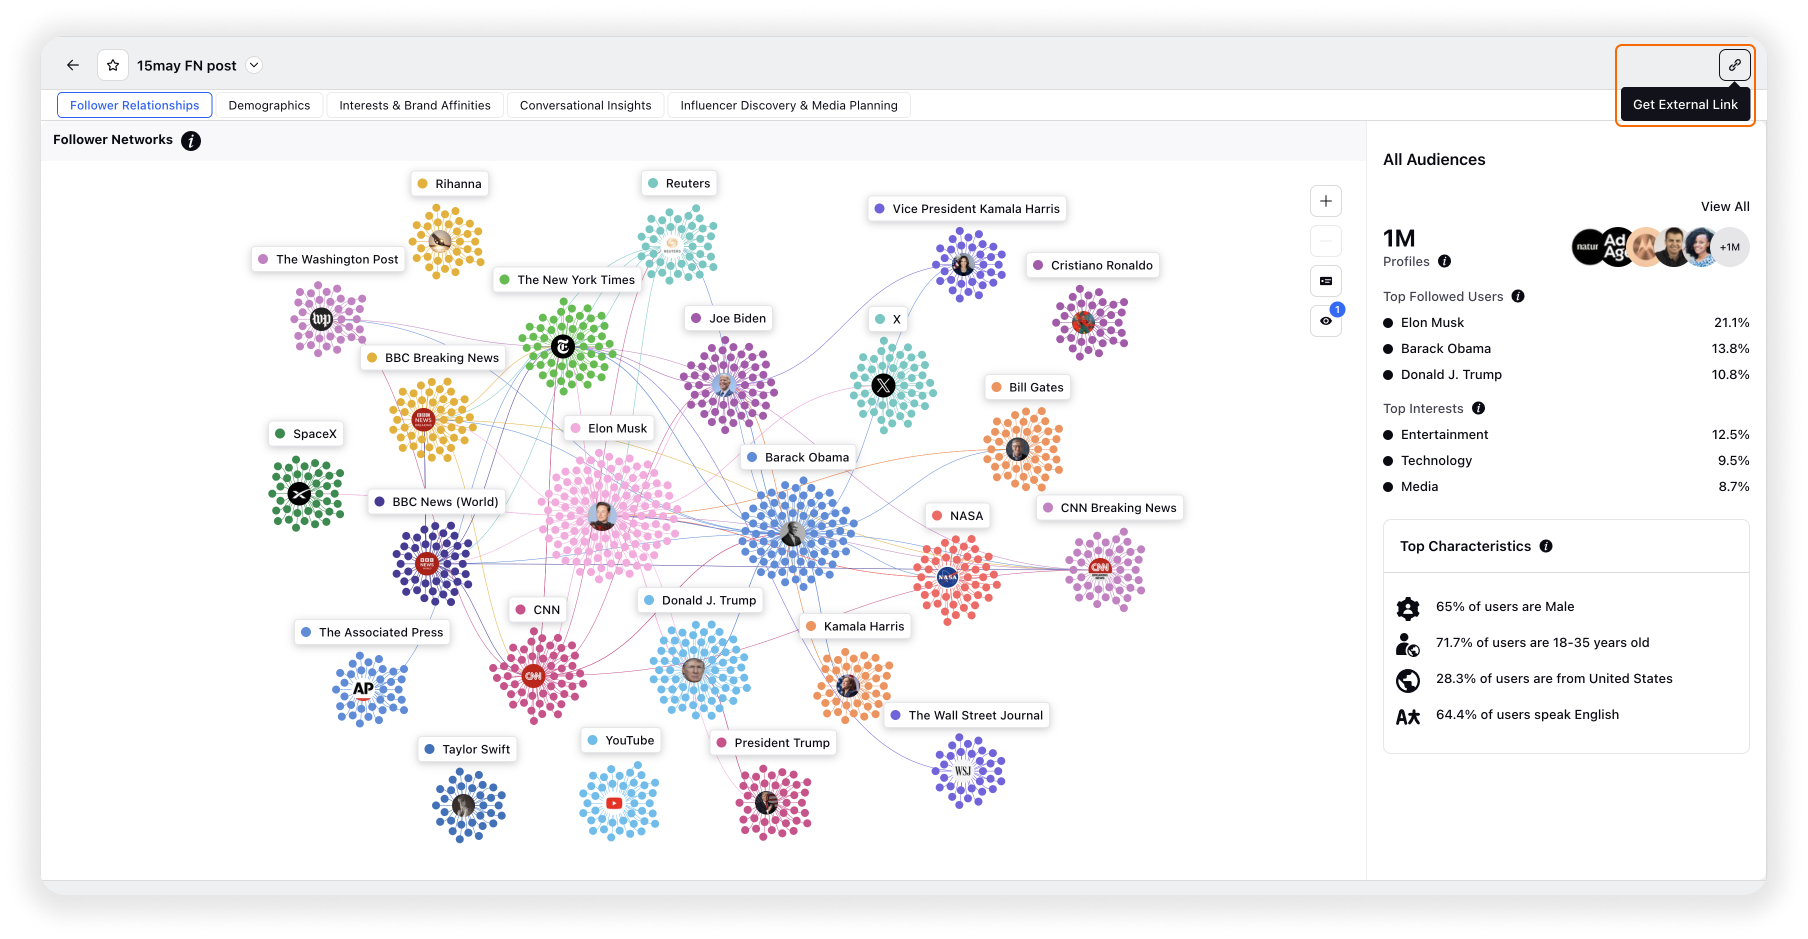
Follower Network Graph displays the top accounts followed by your audience and visualizes the common followers between them. Utilize the graph to discover new and unknown brands or find patterns in common sets of accounts followed by your audience.
The graph widget contains clusters of profiles following a Twitter user – denoted by the label names & their relationships with other clusters shown by the edges connecting them.
The right pane consists of top-level insights pertaining to the overall conversation or the cluster selected: Top pages followed by them, Top user-bio keywords used, etc.
Note: You can hover and click on the cluster names listed on the right pane (similar to interactions on the cluster labels described later in the article).
Interpretation of the visualization
Each cluster in the visualization represents a Twitter account followed by your audience. The nodes within a cluster represent followers of an account. Size and number of nodes of a cluster increase with the number of followers of the account within your audience.
Relationships between clusters are shown via edges, which represent common followers between any two clusters. Thicker the edge connecting any two clusters, more the number of common followers between them.
Interactions on the Followers Network report
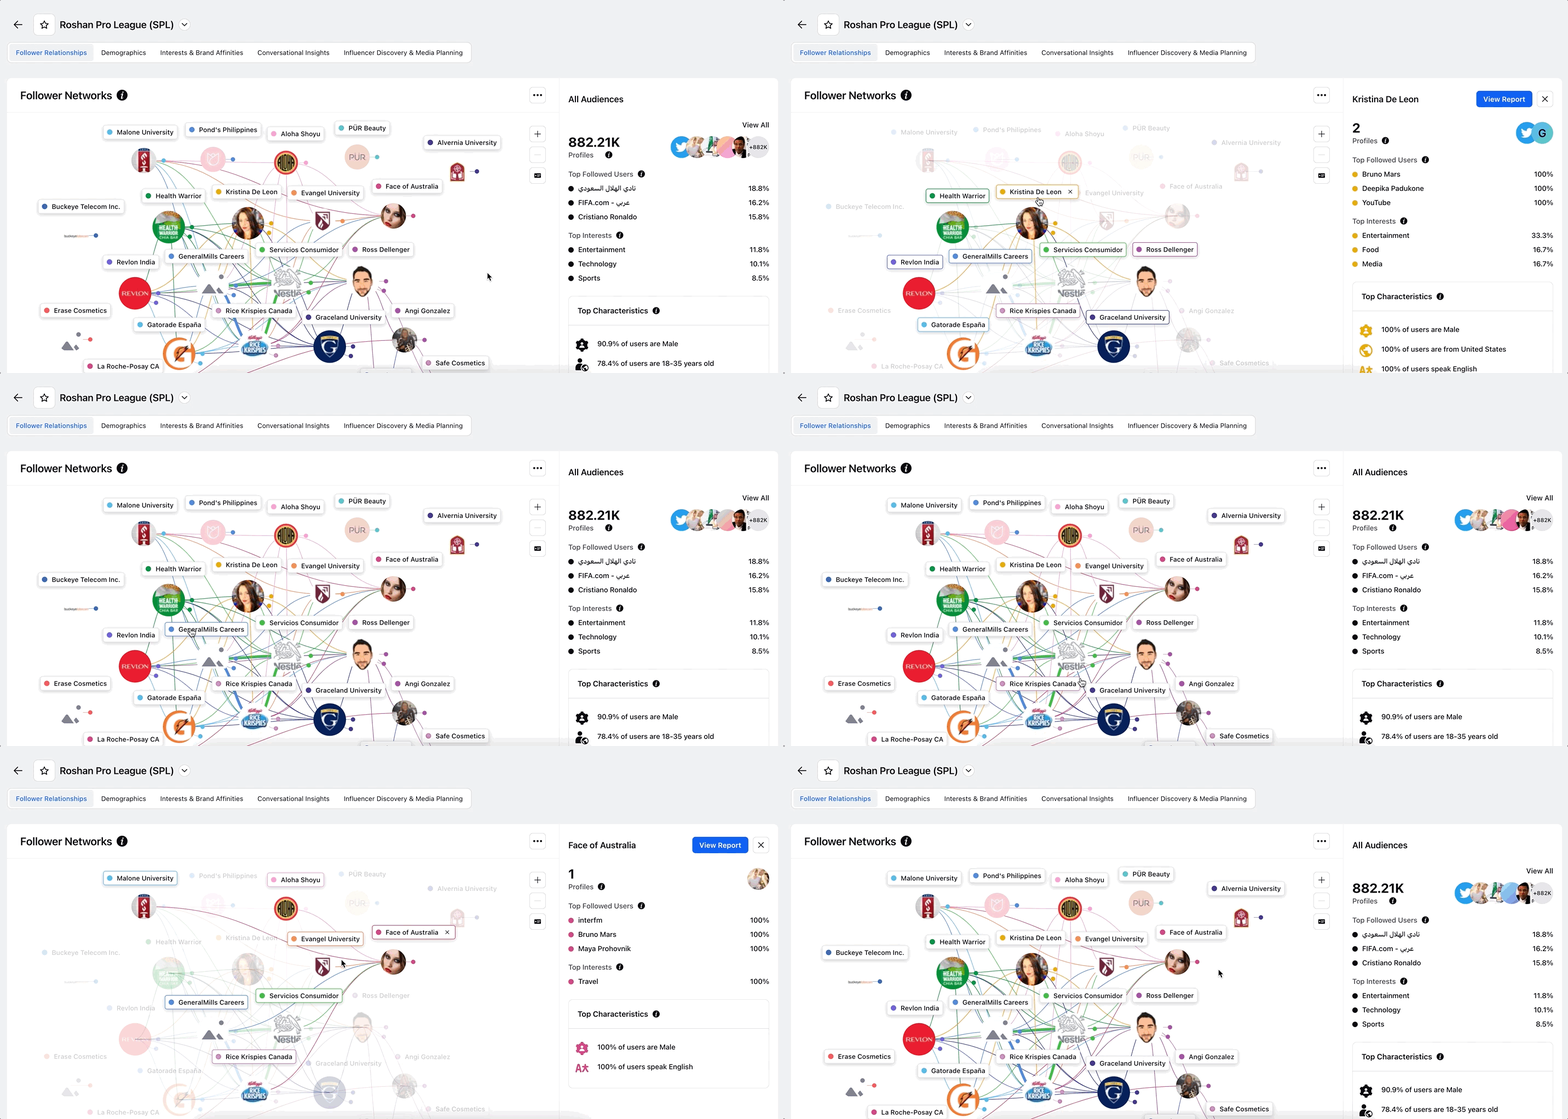
Interaction #1: Single-click on a cluster label
On clicking any cluster label, the cluster selected will get highlighted. Nodes connected with the selected cluster will also be highlighted, so the relationship can be seen clearly.
The right-pane will update with information about the selected cluster.
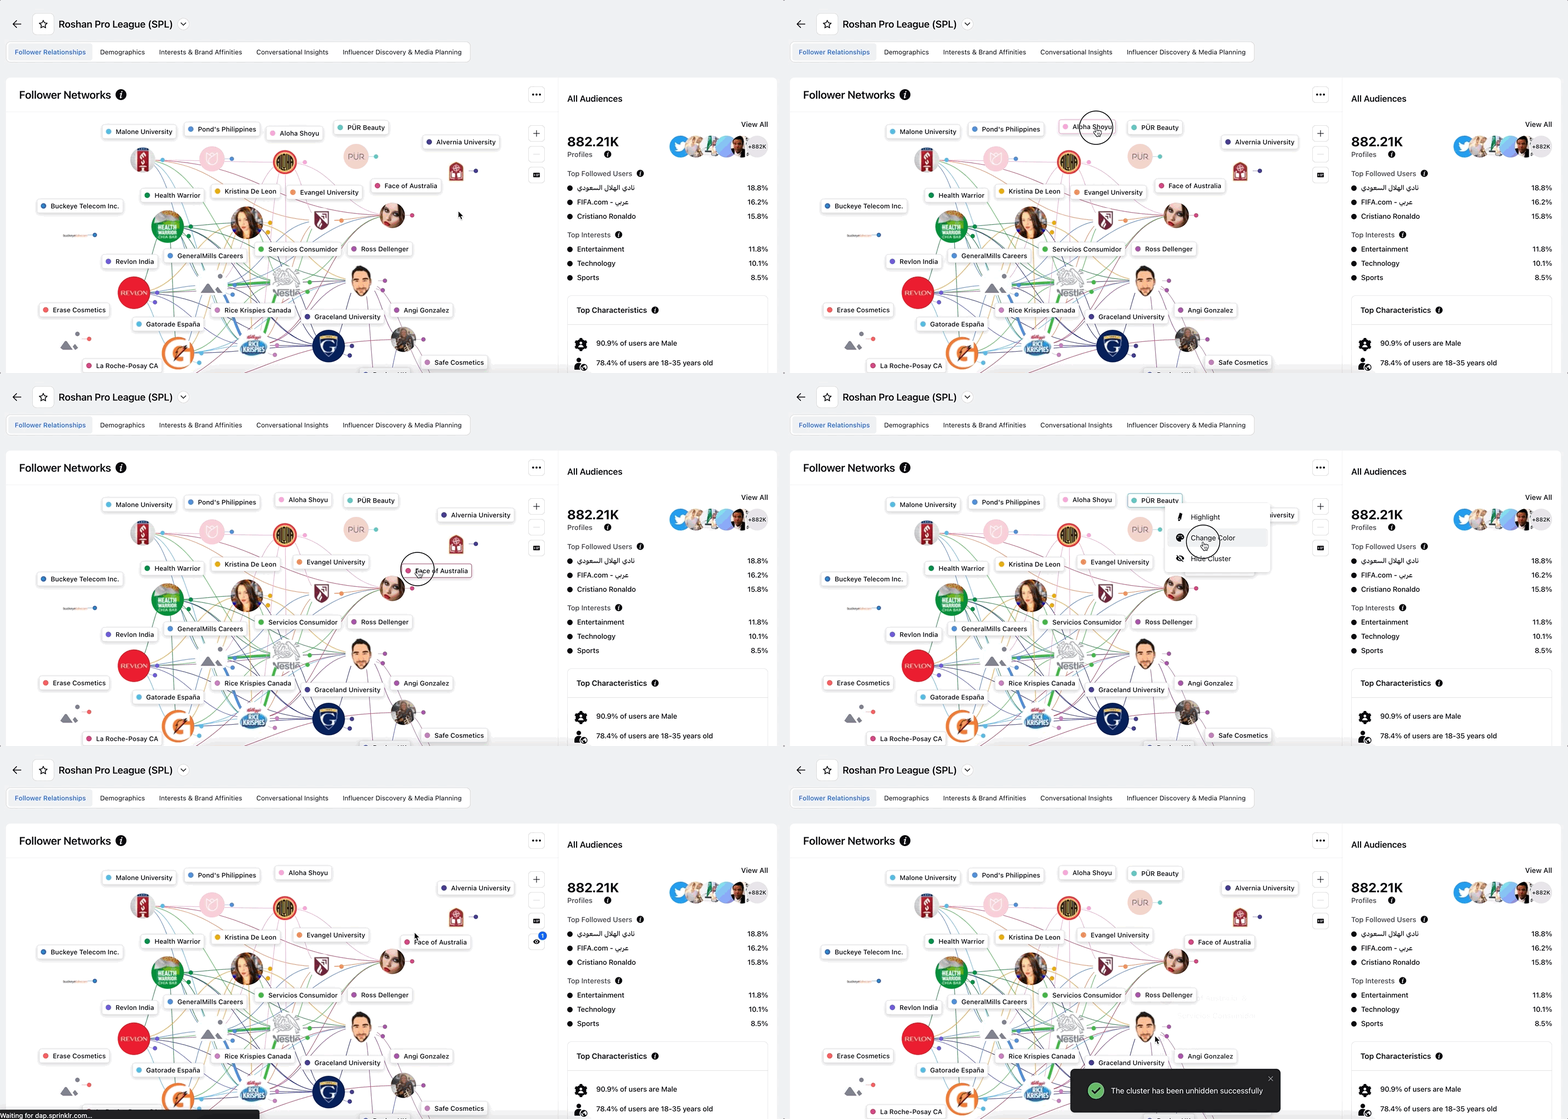
Interaction #2: Move, Recolor Labels, and Hide Clusters
On right-clicking on any cluster label, you can see options to highlight and recolor clusters.
You can also drag and reposition the labels to place them at the desired location.
Deep-dive Insights dashboard
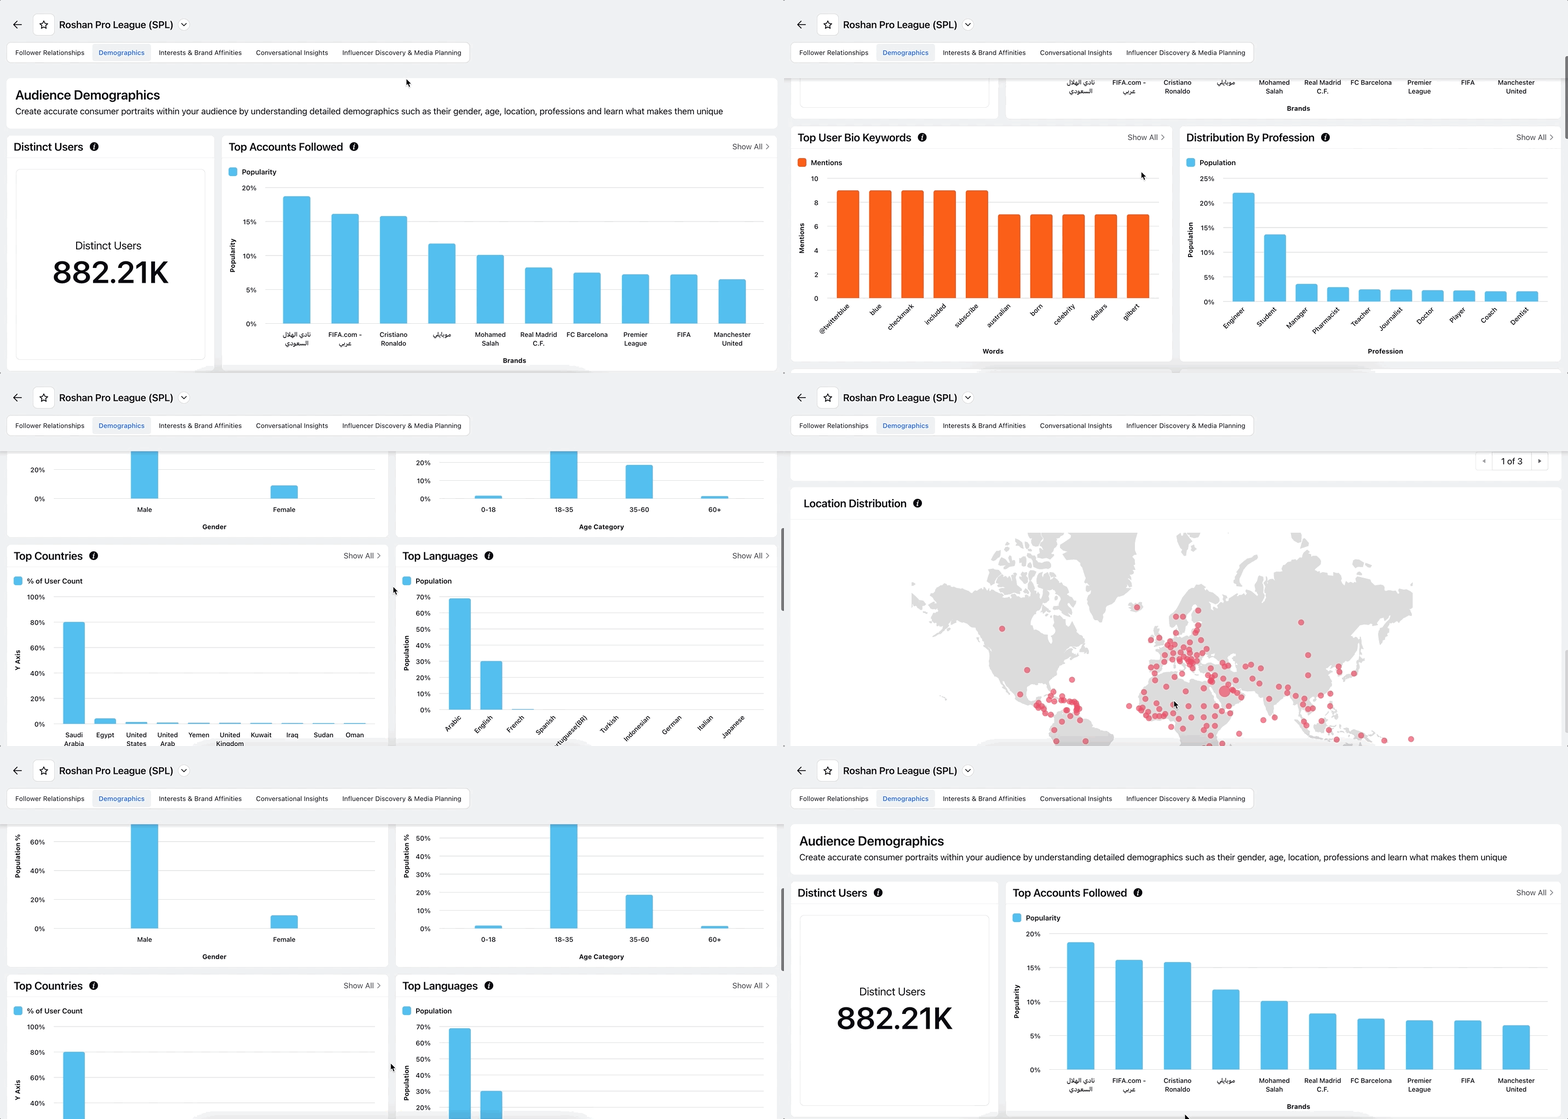
Users can view other tabs within the report as part of the deep-dive dashboard or launch a deep-dive dashboard from the right pane for any individual cluster to get deeper insights on the conversation as well as the audience behind each cluster.
To launch the standard cluster deep-dive dashboard, click on the View Report button at the top right of the right-pane. Once in the dashboard, you can switch between clusters using the Dashboard Switcher (placed next to the title of the dashboard as shown) –
Demographics: Create accurate consumer portraits within your audience by understanding detailed demographics such as their gender, age, location, professions and learn what makes them unique.
Interests & Brand Affinities: This tab will help you discover interests and brand affinities of your audience across major categories to understand their consumption patterns and lifestyle choices.
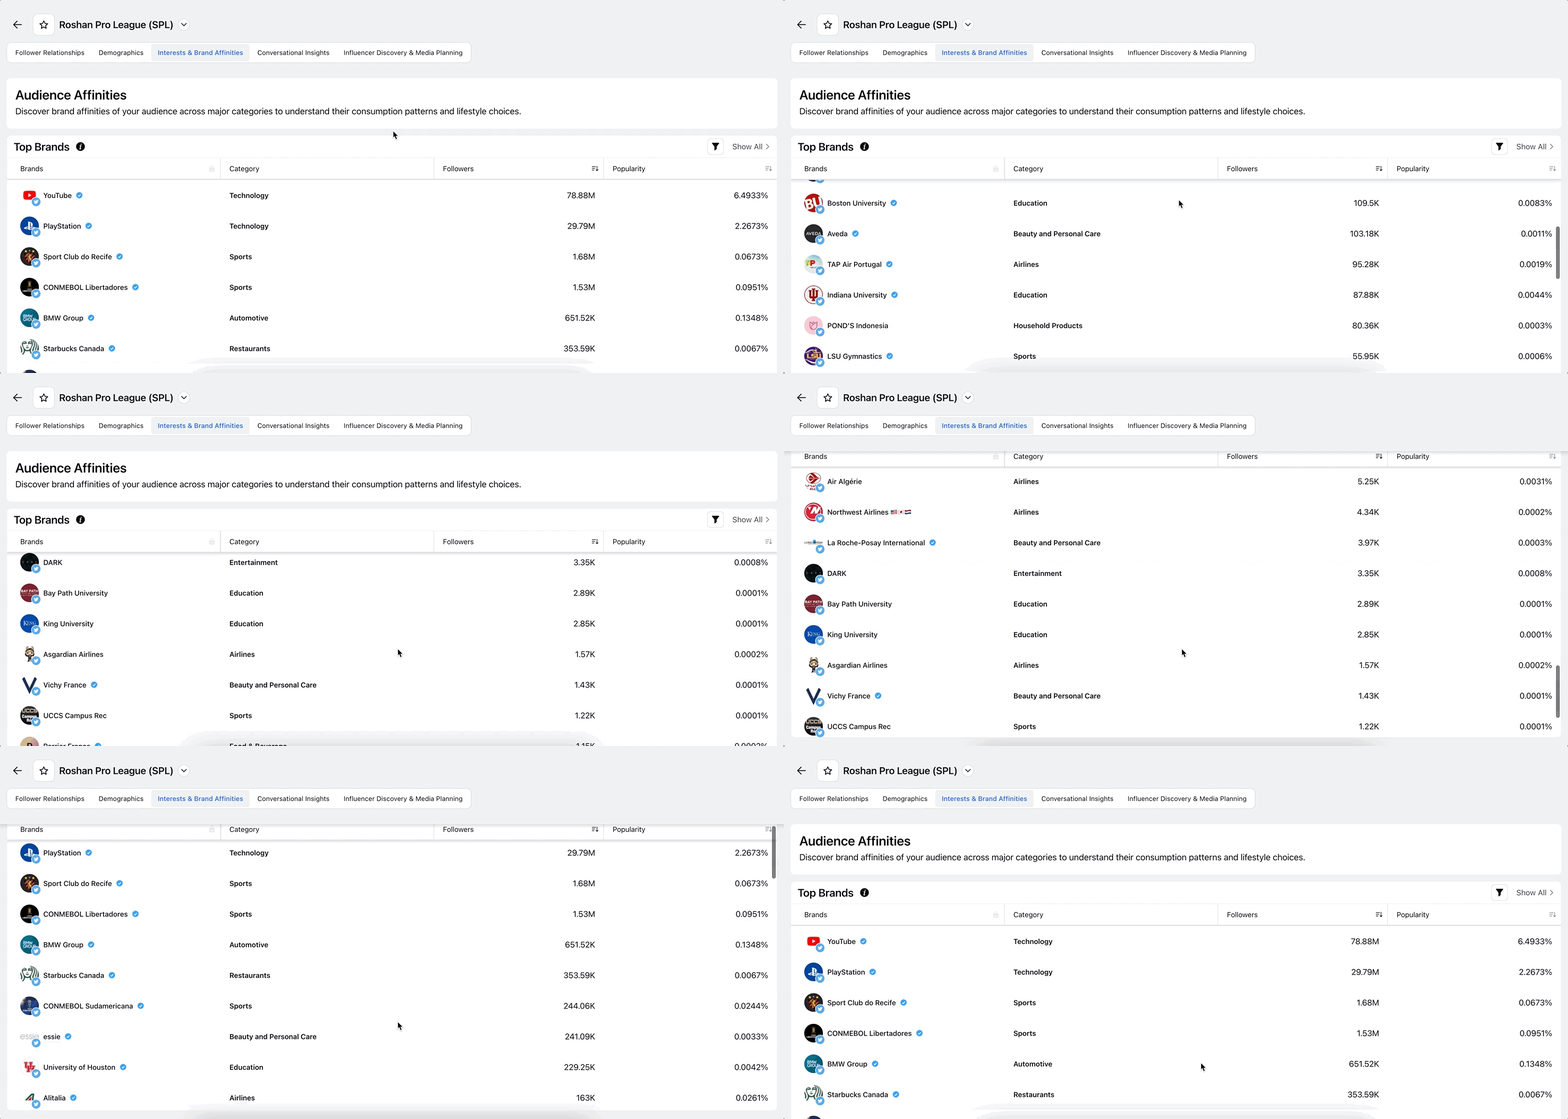
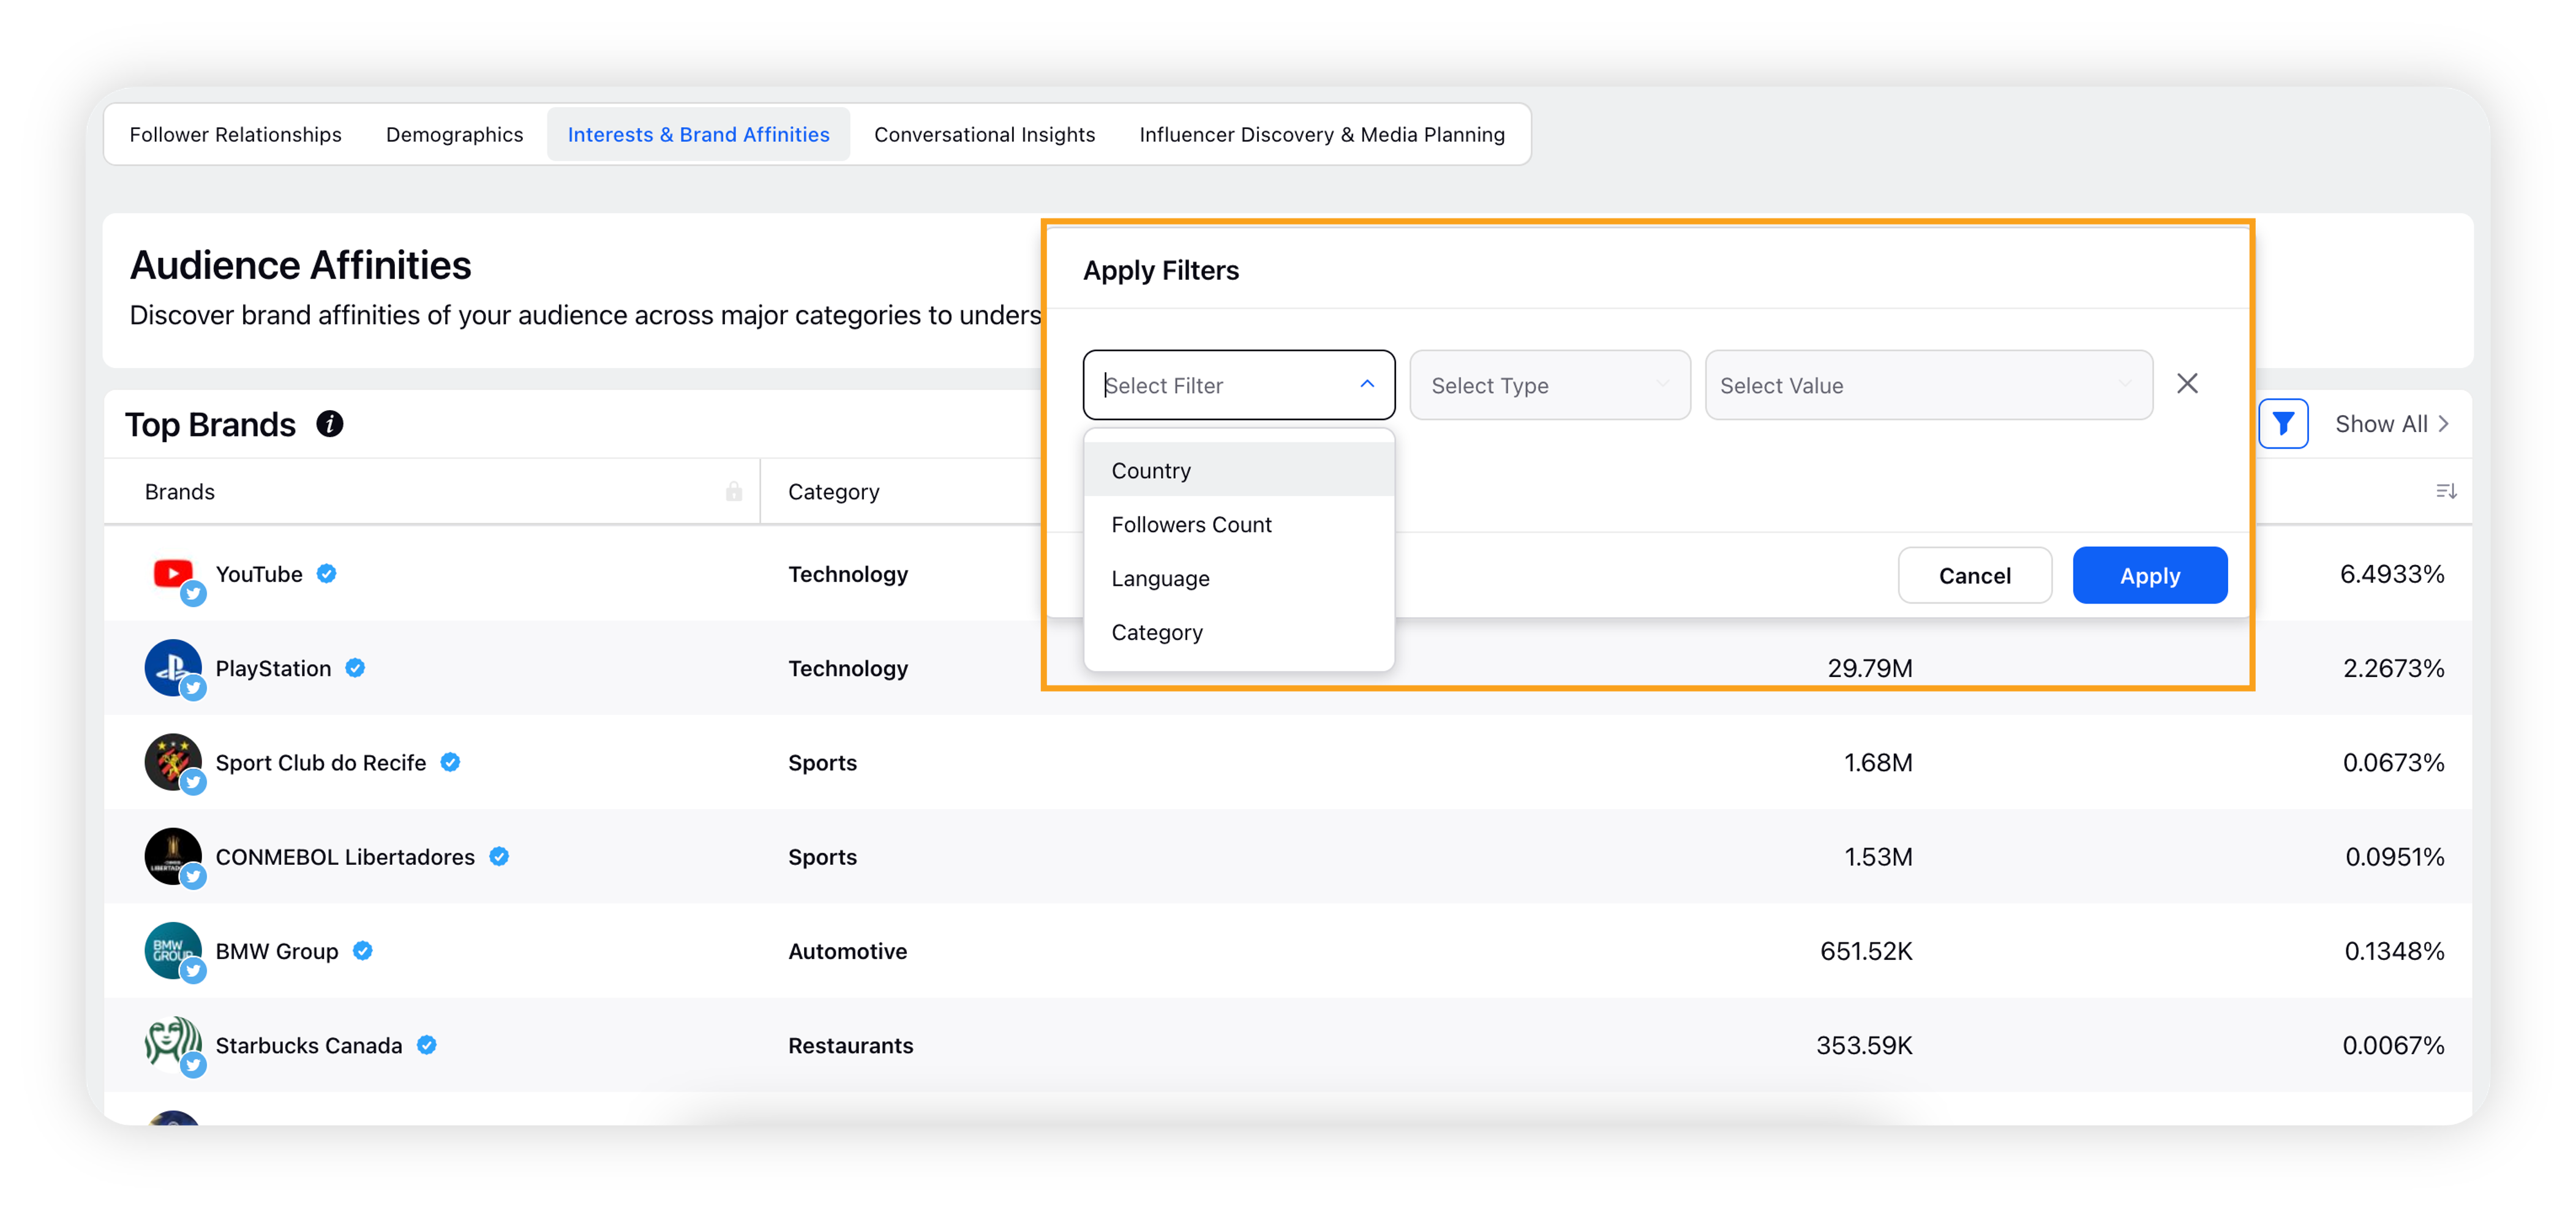
Note: Refine your interests and brand affinities search with the ability to filter by Country, Language, Followers, and/or Category.
Conversation Insights: Create powerful content ideas that will resonate with your audience by identifying key themes in conversation, top trending hashtags and visual media from popular conversations.
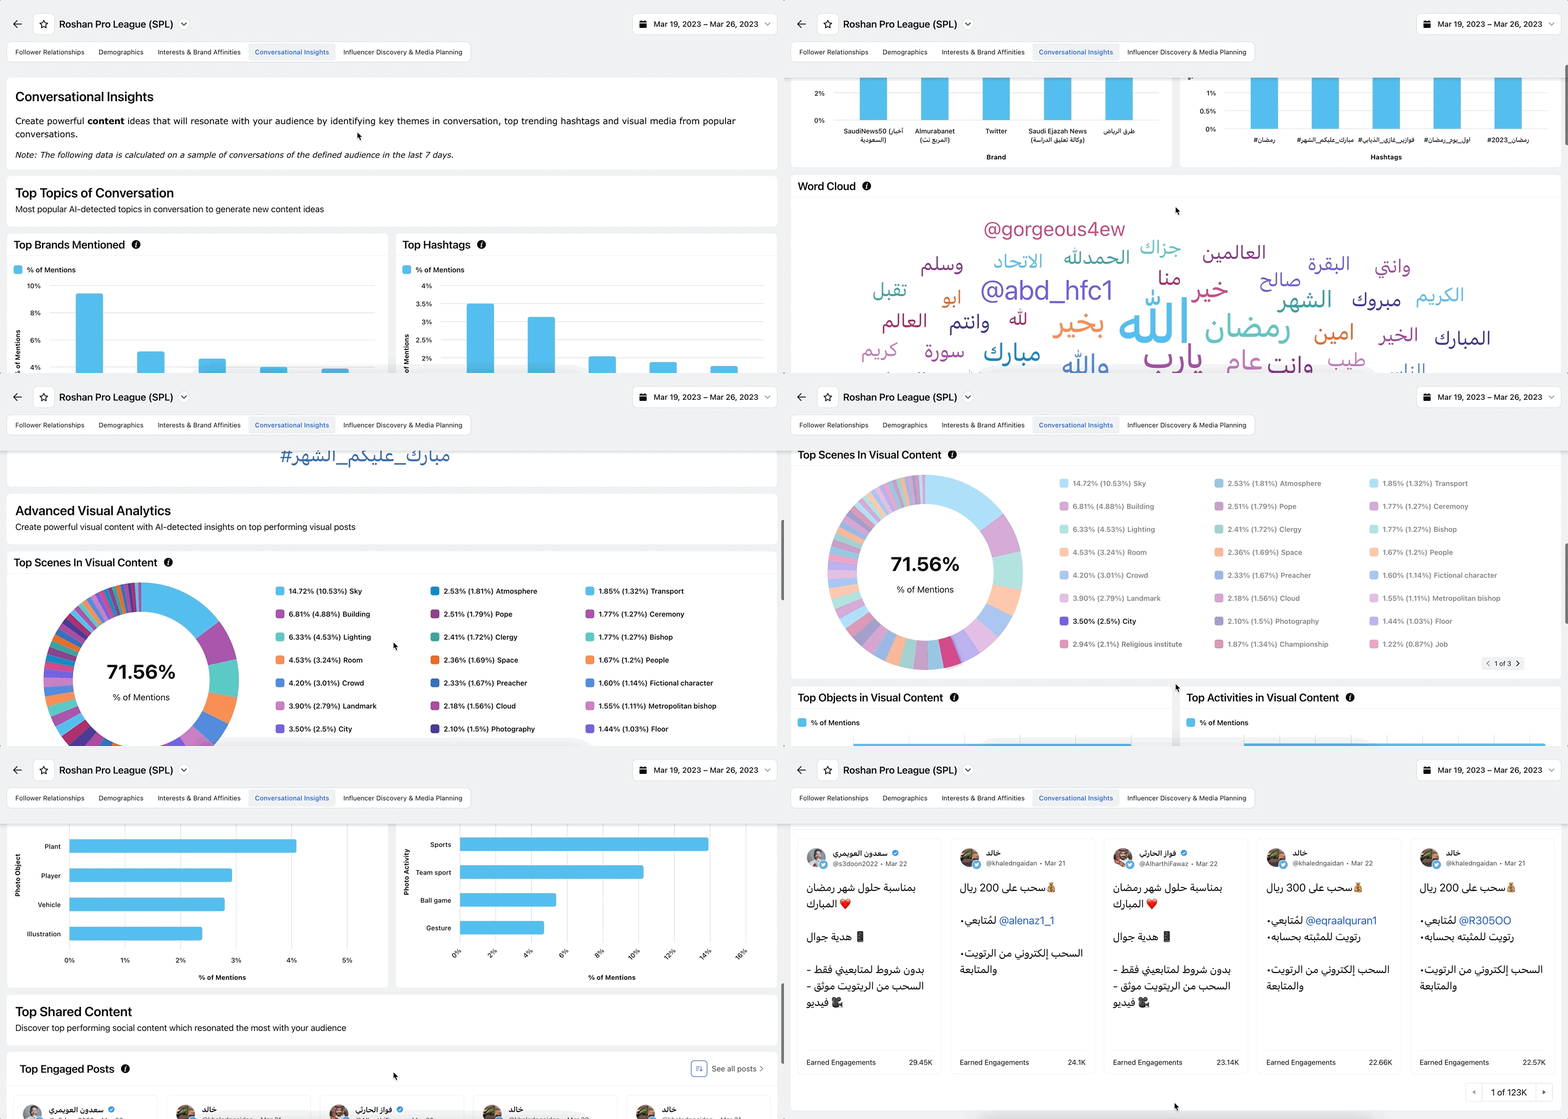
Note: Conversations for all audience members are fetched for the last 7 days.
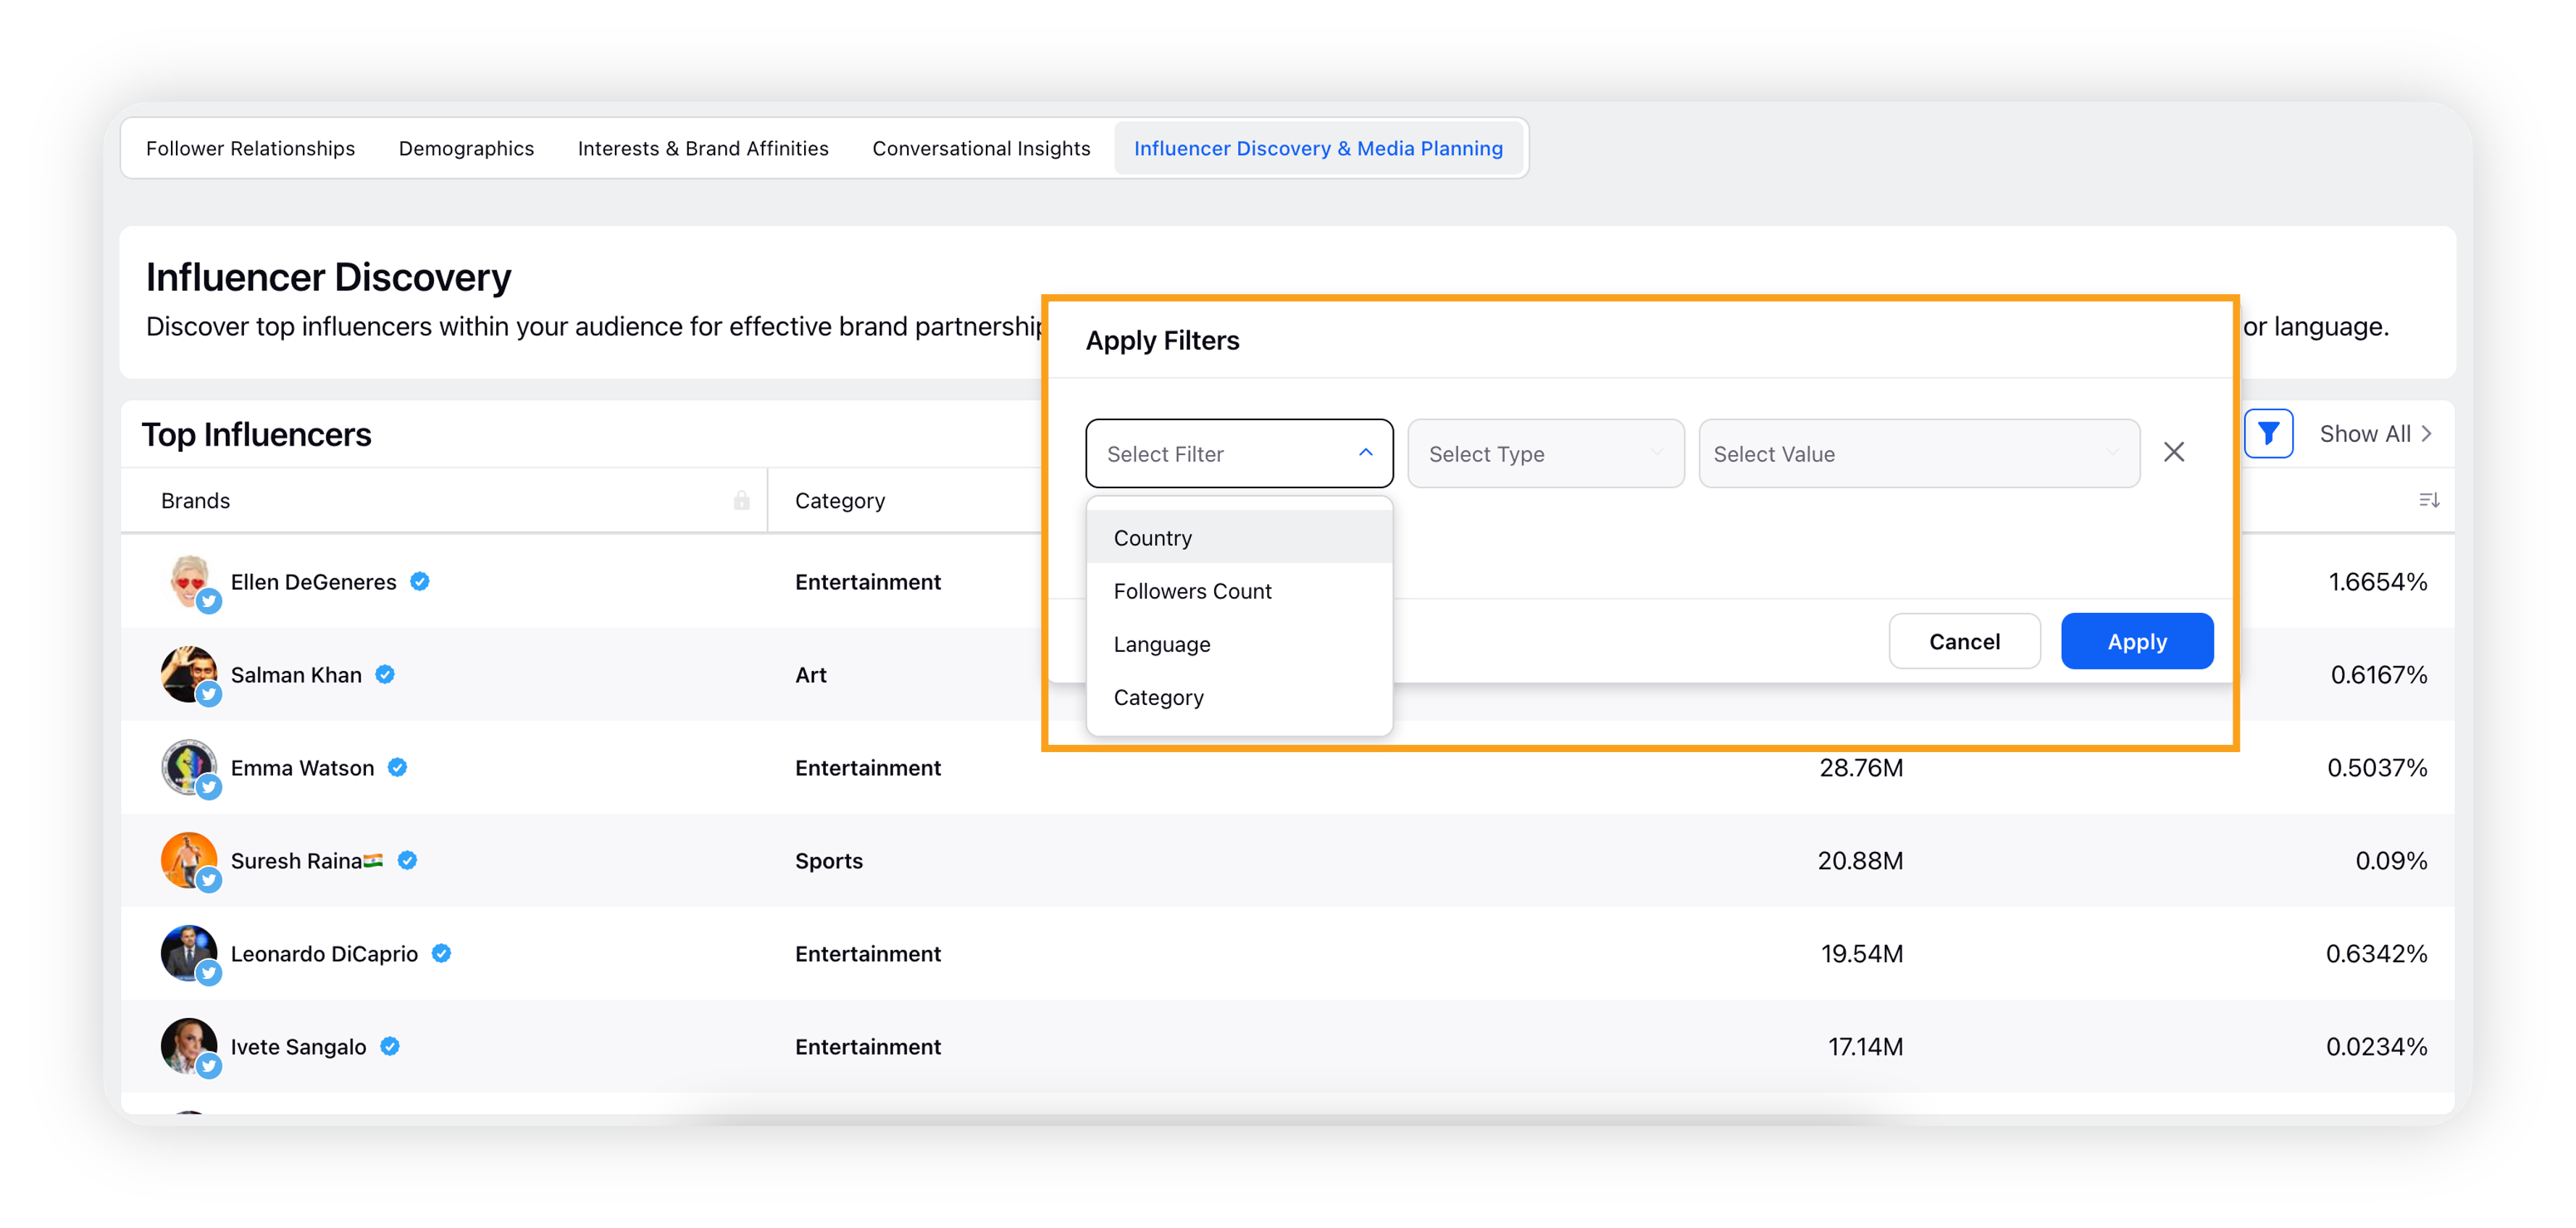
Influencer Discovery & Media Planning: Discover top influencers within your audience for effective brand partnerships and targeted advertising. You can search for relevant profiles by filtering on follower count, country, or language.
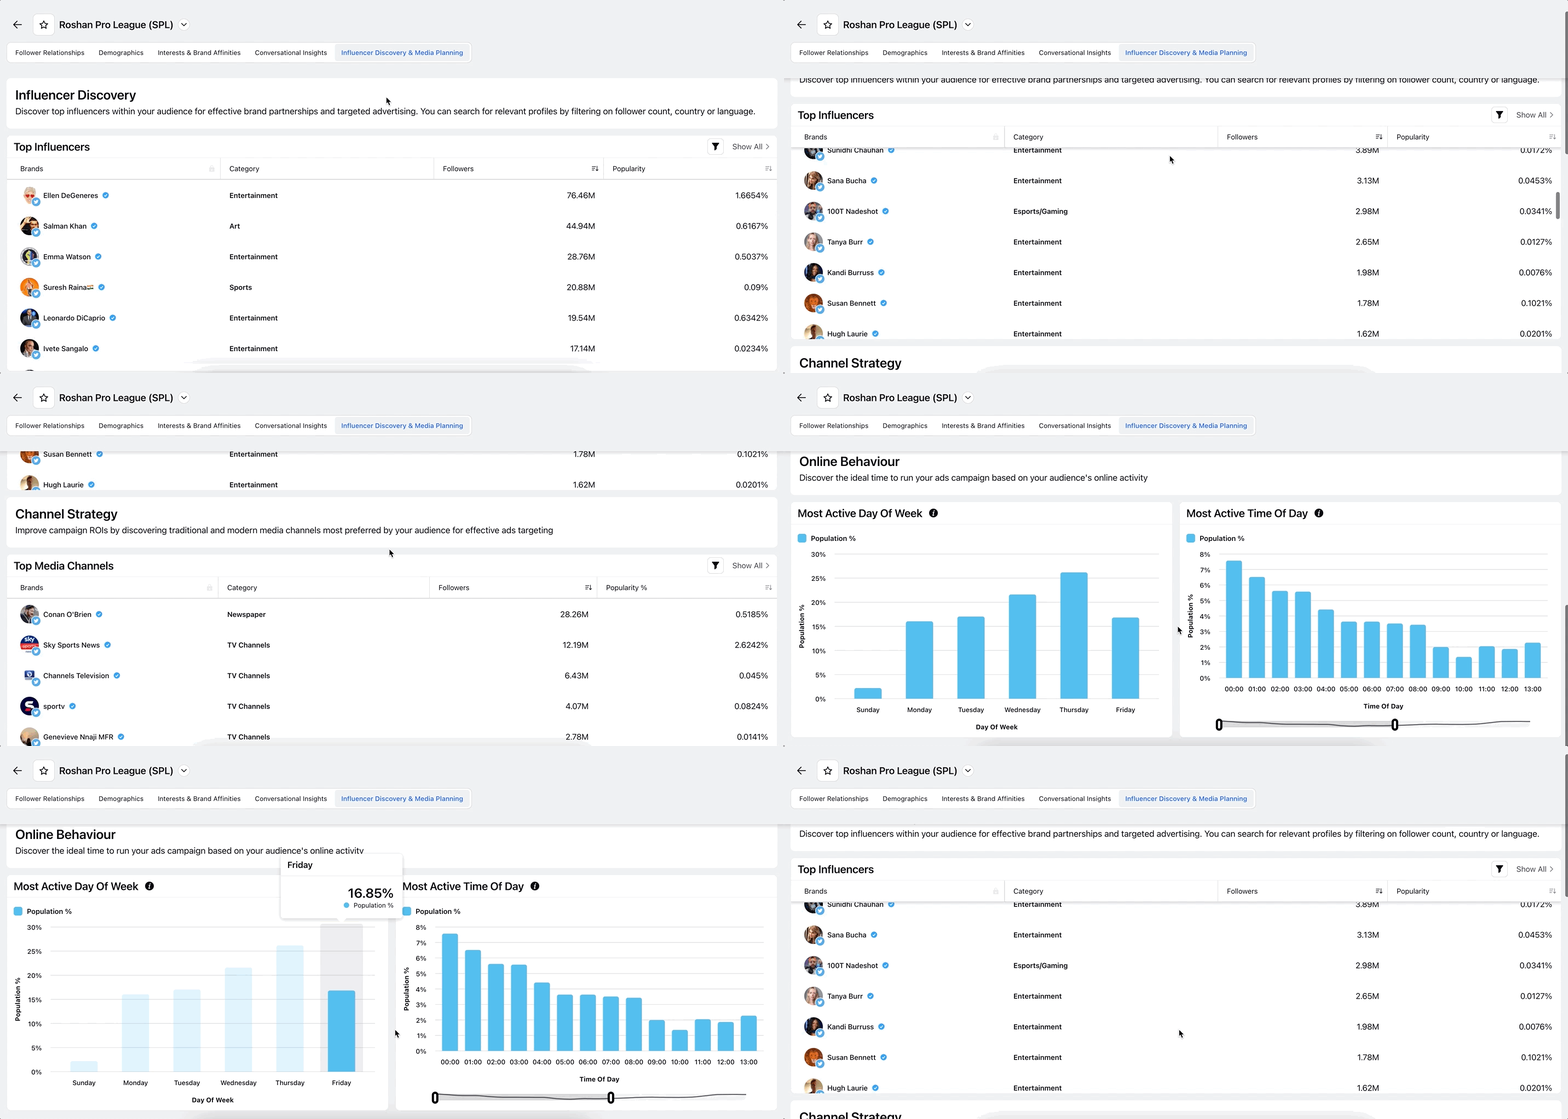
Note: Refine your influencer and media search with the ability to filter by Country, Language, Followers, and/or Category.
Drilldowns
You can drill-down on any data-point in the Conversation Insights tab by clicking on it, which will open a third-pane.
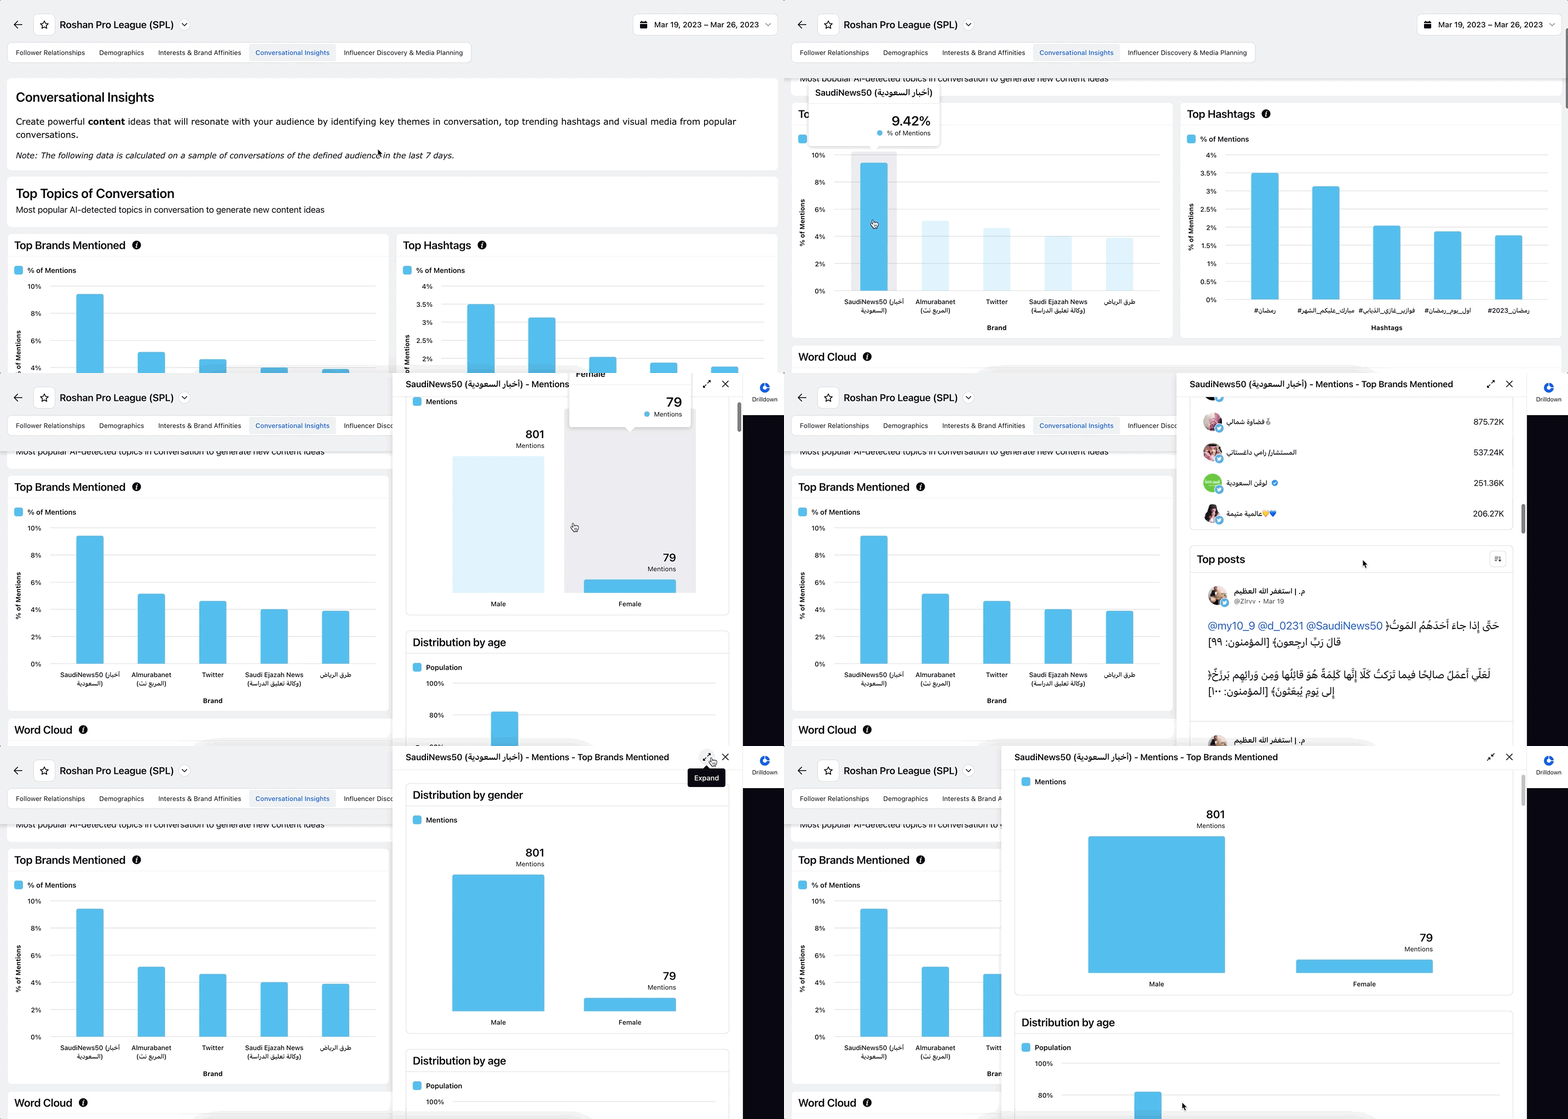
Third-pane drill-down contains the following widgets – Distribution by Gender, Distribution by Age, Distribution by Country, Distribution by Interests (AI-generated), Top Influencers & Top Posts.
Add Audience Insights widget to a custom dashboard
You can add the Advanced Audience Insights report generated to any custom Listening Dashboard as a separate widget.
In order to add it to any custom Listening dashboard of your choice:
Click the Add to Custom Dashboard button in the three-dot menu located on the top-right of the report.
The following dialog box will open. You have to enter the name of the widget & select whether you want to:
Add to an existing custom Dashboard. In this case, please select the name of the dashboard in the drop-down menu.
Create a new custom Dashboard. For this, enter the name of the new dashboard you want to create and add the report to.
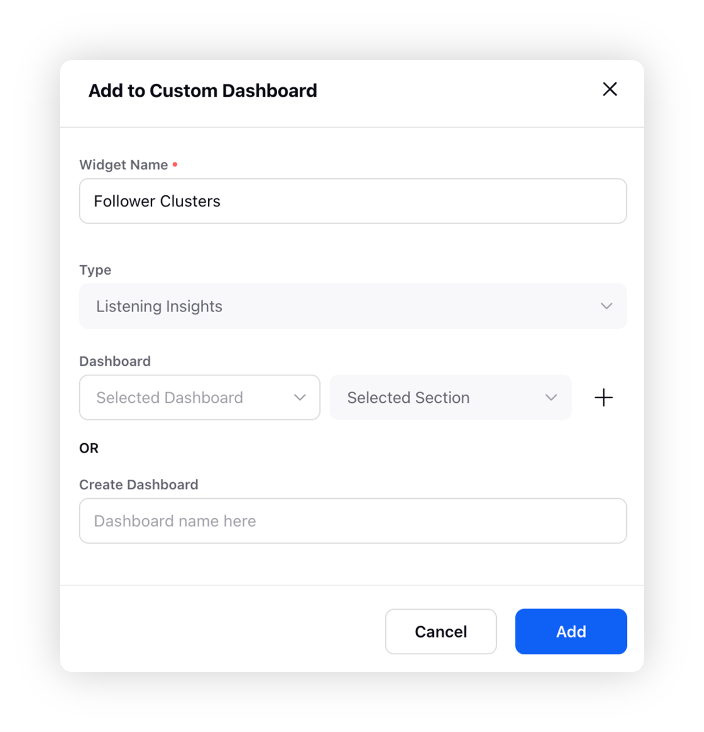
Click Add. The report will be added as a new tab in the existing/new custom Listening dashboard.
Share Followers Network report using external link
You can easily share the Followers Network Report with users outside of Sprinklr by generating a shareable external link. Click on the Get External Link button located on the top-right of the report to generate the external link.
Capabilities & limitations
Only Twitter is supported as a source.
Support to define an audience directly via referencing their conversations using a Topic or Keyword Query will be added in the coming releases.
Support for Exports will be added in the coming release patches as well.
Ability to save any set of profiles in a profile list will also be supported in the coming releases.