Instagram as a Benchmarking source
Updated
Instagram is a photo and video-sharing social networking service that allows users to upload media that can be edited with filters and organized by hashtags and geographical tagging. Posts can be shared with publicly or preapproved followers. Users can browse other users' content by tag and location, view trending content, like photos and follow other users to add their content to a personal feed. Around 1.28 billion people use Instagram daily and thus it is one of the most trafficked social media platforms, so brands must know how they and their competitors are performing on Instagram.
Overview of Instagram as a source
Source: Instagram
Source of data: Public APIs
Latency
Every 2 hours for the first 3 days after posting
Once a day for the rest period of monitoring
The followers count is refreshed every 24 hours
Historical data
Auto backfill: 2 years from the addition of account in Sprinklr
Manual backfill: 3 years from the addition of account in Sprinklr
Duration of monitoring: 60 days
Instagram-specific data entities in benchmarking and major engagement stats
Name | Type | Definition |
Instagram fan comment count | Metric | This is a common metric that calculates the sum of various types of "comments" across social networks. |
Post likes | Metric | This is a Sprinklr common metric that totals "likes" across various social networks. |
Post comments | Metric | This is a common metric that calculates the sum of various types of "comments" across social networks. These include Facebook Post Stream Comments, Twitter Reply, G+ Post Comments, YouTube Video Comments, and Instagram Post Comments. |
Account Followers | Metric | This is a Sprinklr common metric to total all of the various types of "followers" across social networks. |
Volume of published messages | Metric | The number of outbound messages that have been published. |
Brand messages | Metric | The number of outbound messages that have been published by the brand page. |
Account Total engagements | Metric | Account Total Engagement is the sum of engagements for an account per day. This will also include engagements on posts published outside the selected time range |
Account Earned Impressions | Metric | The number of social accounts that could potentially see a company or brand's communications from shared posts such as re-posts and retweets. This number is multiplied by a factor of (1.0 + 0.013 * (1.0 / 3.0)) which represents a generally accepted virality score to account for other users that might have also seen the message. |
Account Owned Impressions | Metric | The number of social accounts that could potentially see a company or brand's communications from its followers. |
Account Total Impressions | Metric | The total number of social accounts that could potentially see a company or brand's communications either directly or through messages such as re-posts and re-tweets. This combines Owned and Earned Impressions. |
Average Engagements per Post | Metric | Average Engagements Per Post = Total Engagements / Volume of Published Messages |
Post Total Impression | Metric | Provides the public view count for Instagram Reels, including both paid and organic metrics |
Average Engagement Rate per Post | Metric | Average Engagement Rate (%) Per Post = Average Engagements per Post / Average of followers at Post Time x 100 |
Brand Messages Count | Metric | The number of outbound messages that have been published by the brand page. This metric can be used with dimensions like Message Subtype |
% Paid Posts | Metric | Ratio of Paid posts (as predicted by AI) to overall posts from Brand pages |
Organic Efficiency | Metric | This metric is a measure of how efficient a Brand's organic publishing is at increasing engagement without the benefit of promotion. It is calculated as Total Organic Engagement / Non-Promoted Post Count. |
![]() Note: Engagement statistics for the post will be tracked every 2 hours during the initial 3 days, followed by daily monitoring for the subsequent 60 days.
Note: Engagement statistics for the post will be tracked every 2 hours during the initial 3 days, followed by daily monitoring for the subsequent 60 days.
How to add Instagram link to the brand?
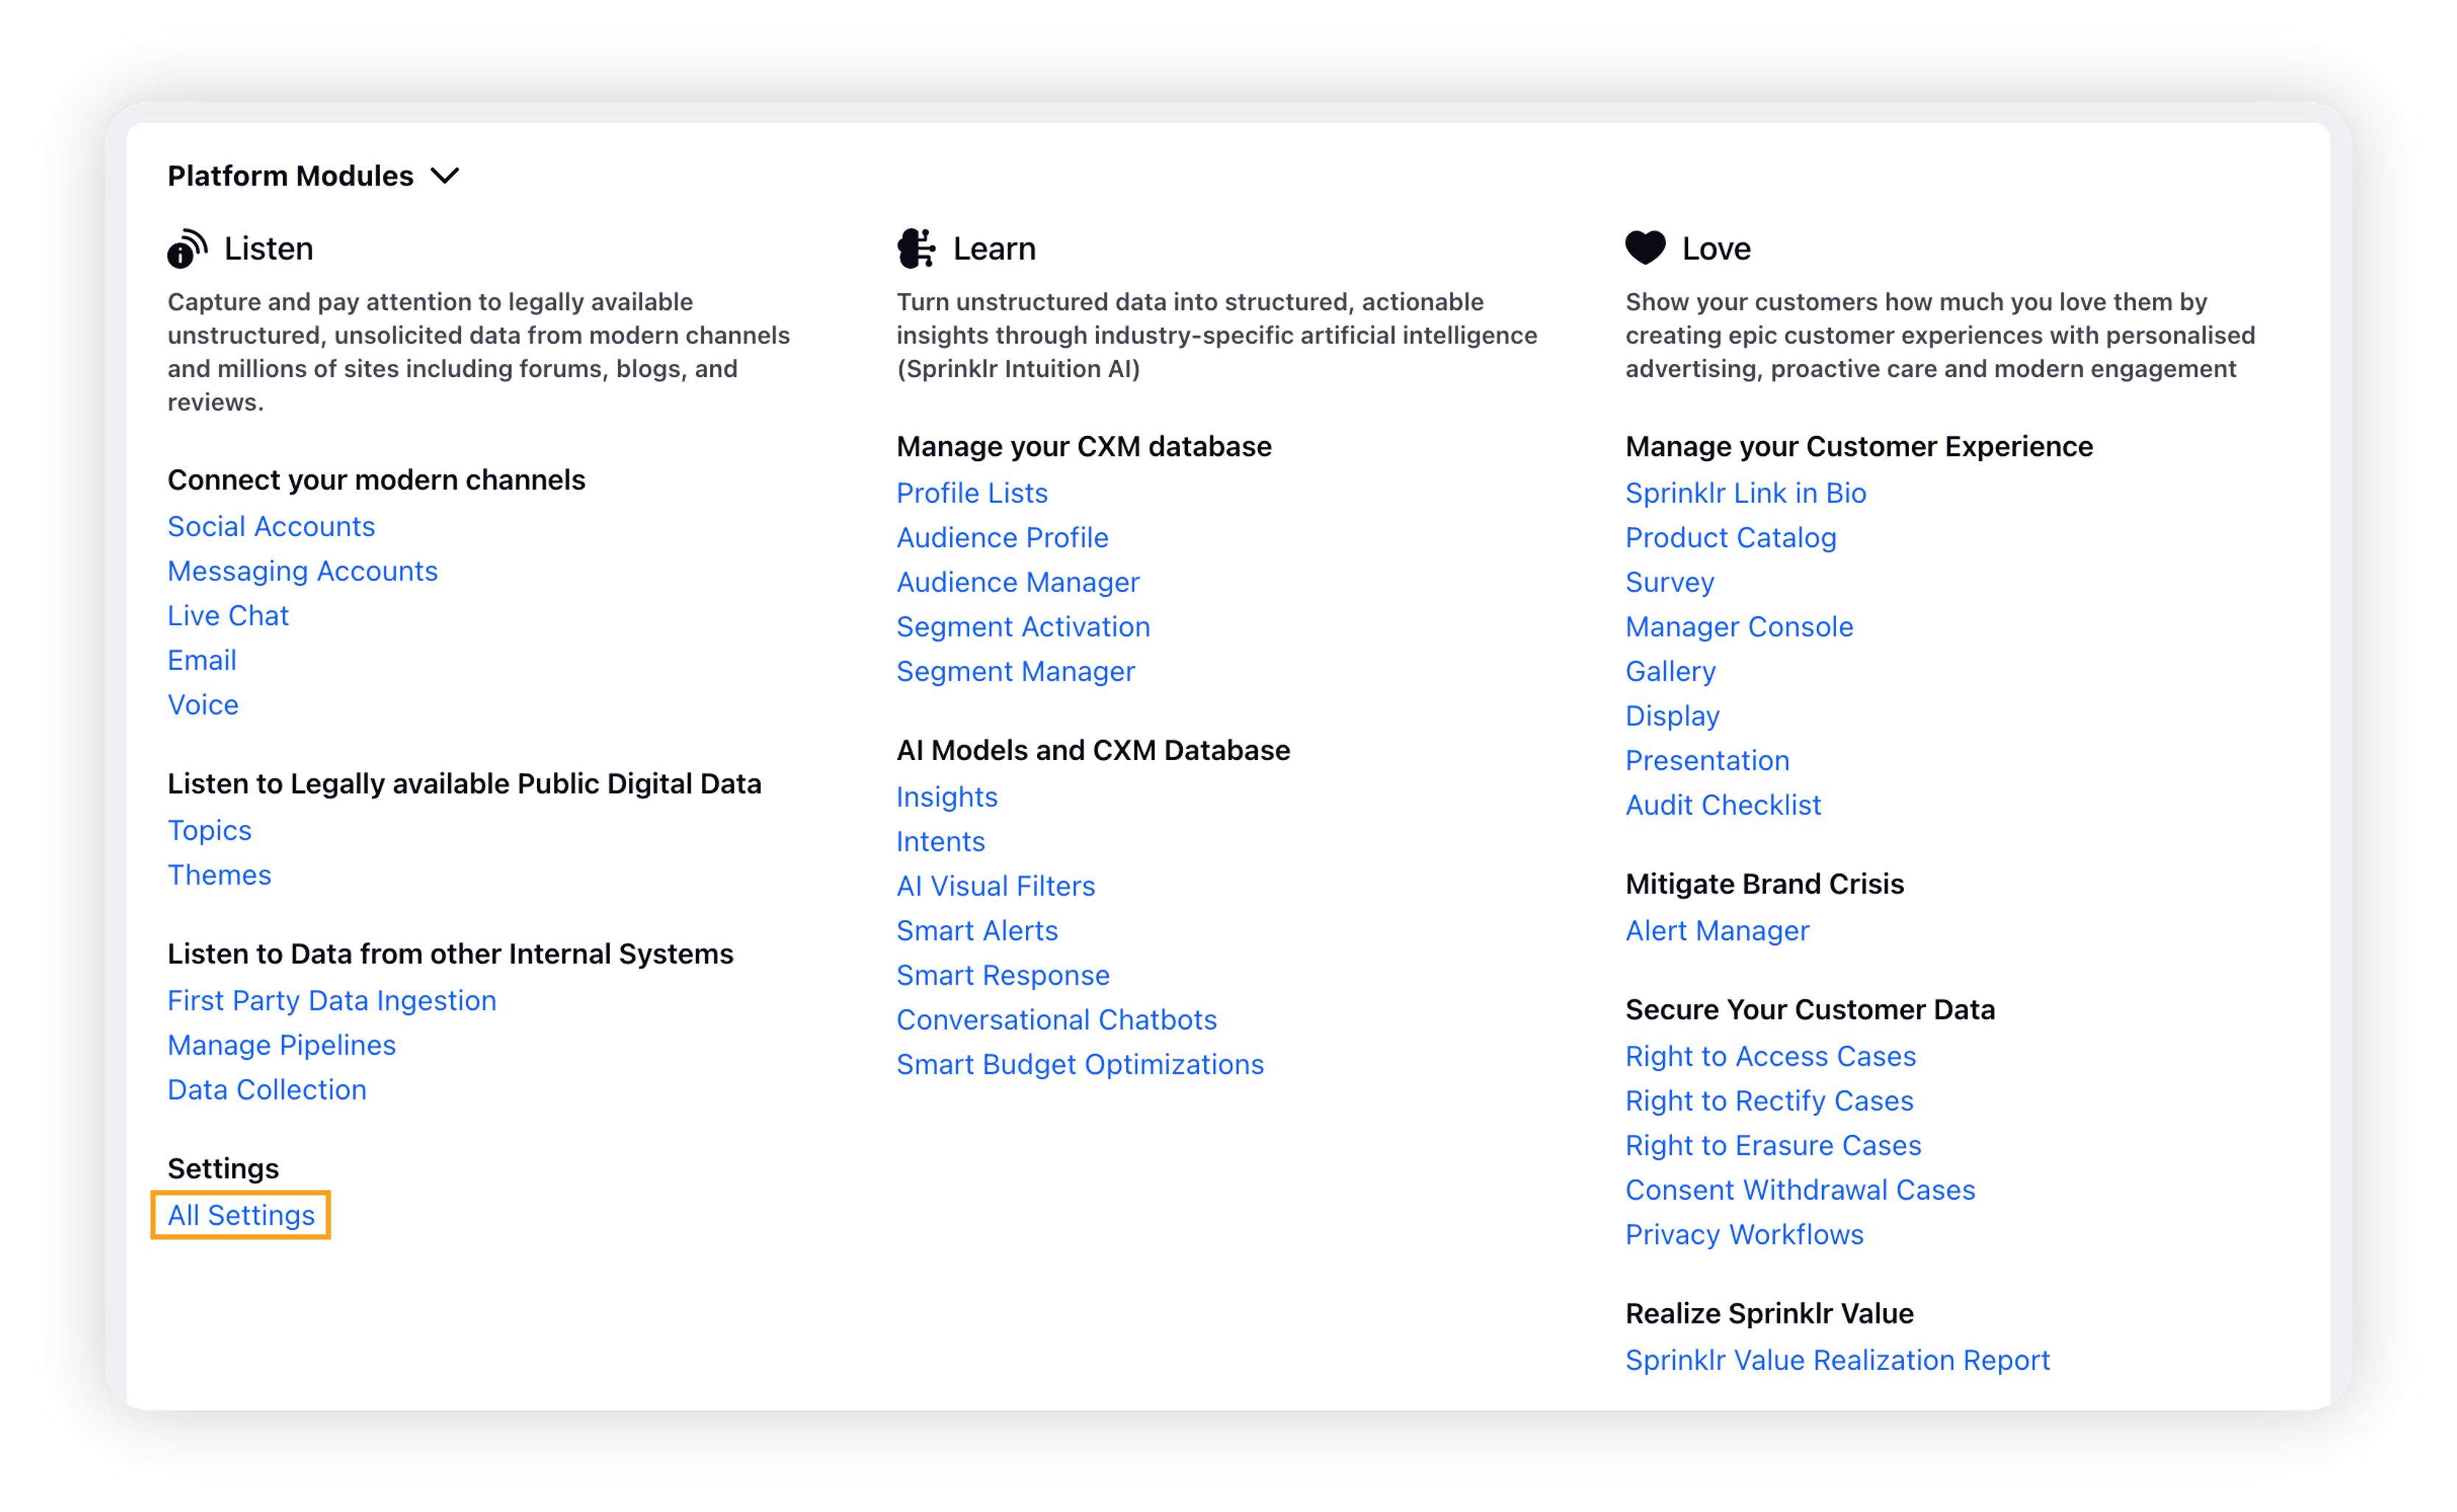
Click the New Tab icon. Under Platform Modules, click All Settings within Listen.
On the Platform Settings window, search and select Brands within Manage Customer.
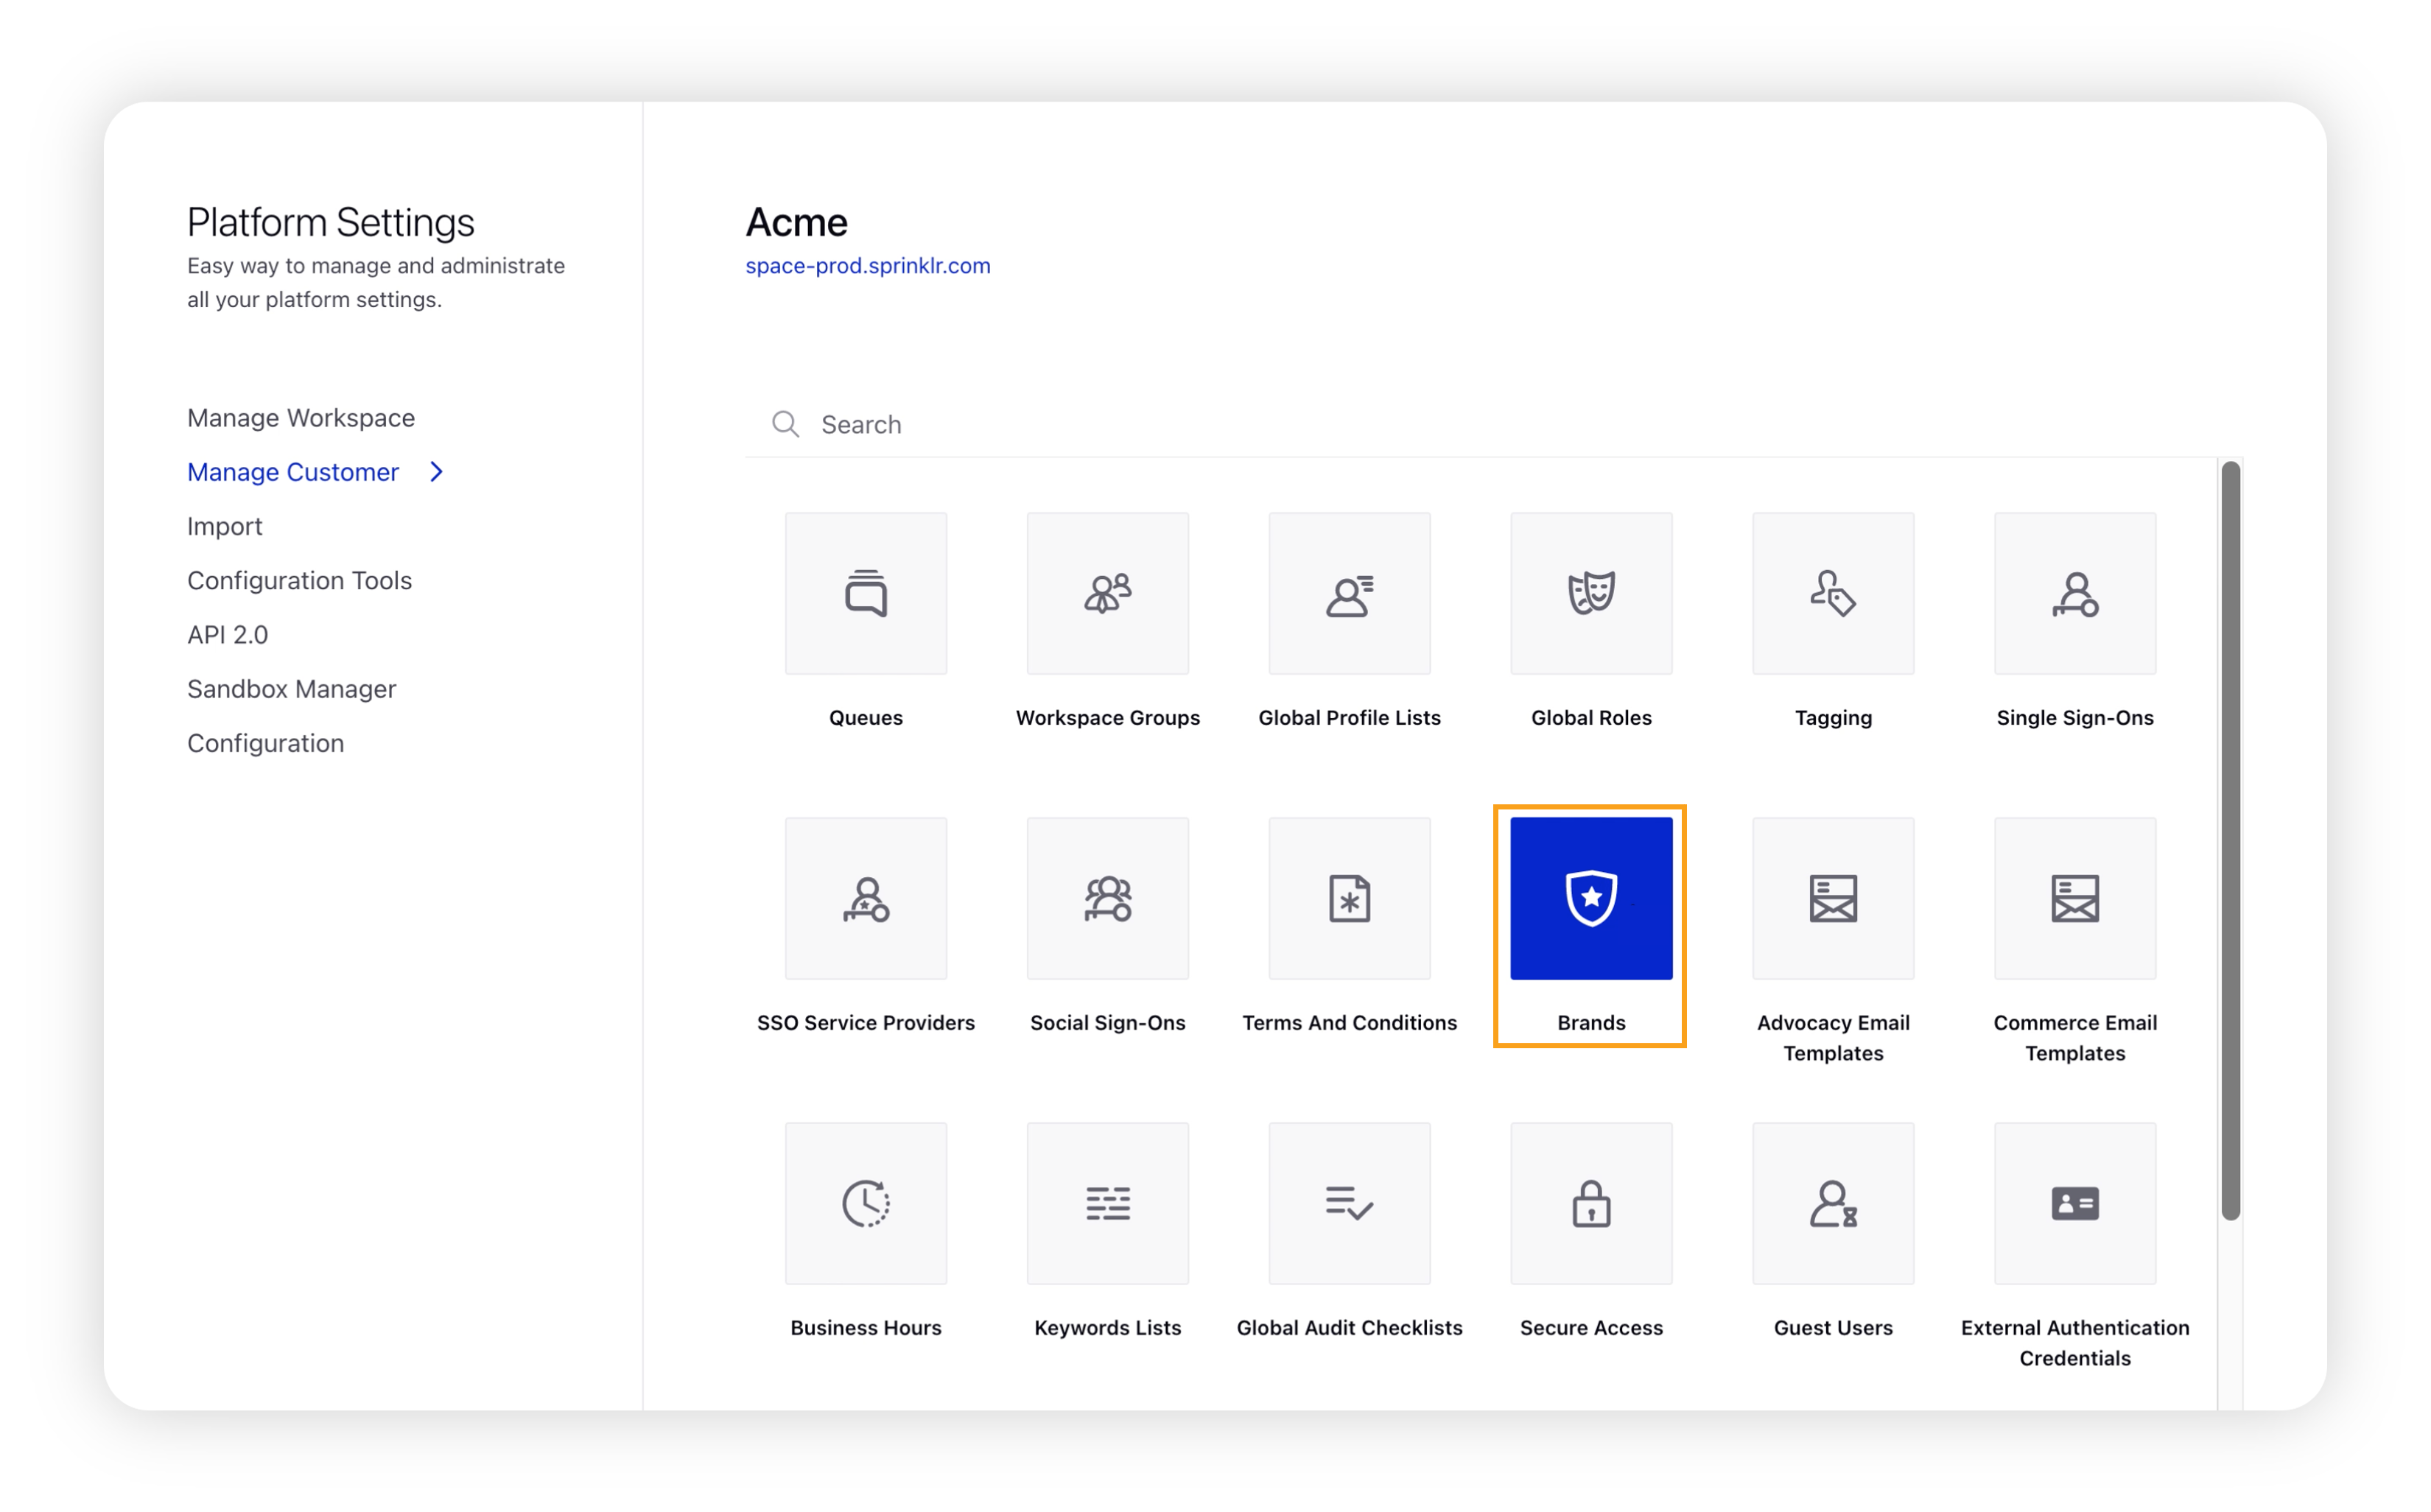
Click Add Brand in the top right corner of the Brands window.
Under the Account section, click Add More Accounts to add a new account.
On the Add More Accounts popup window, enter single or multiple URLs of the Instagram accounts to be added.
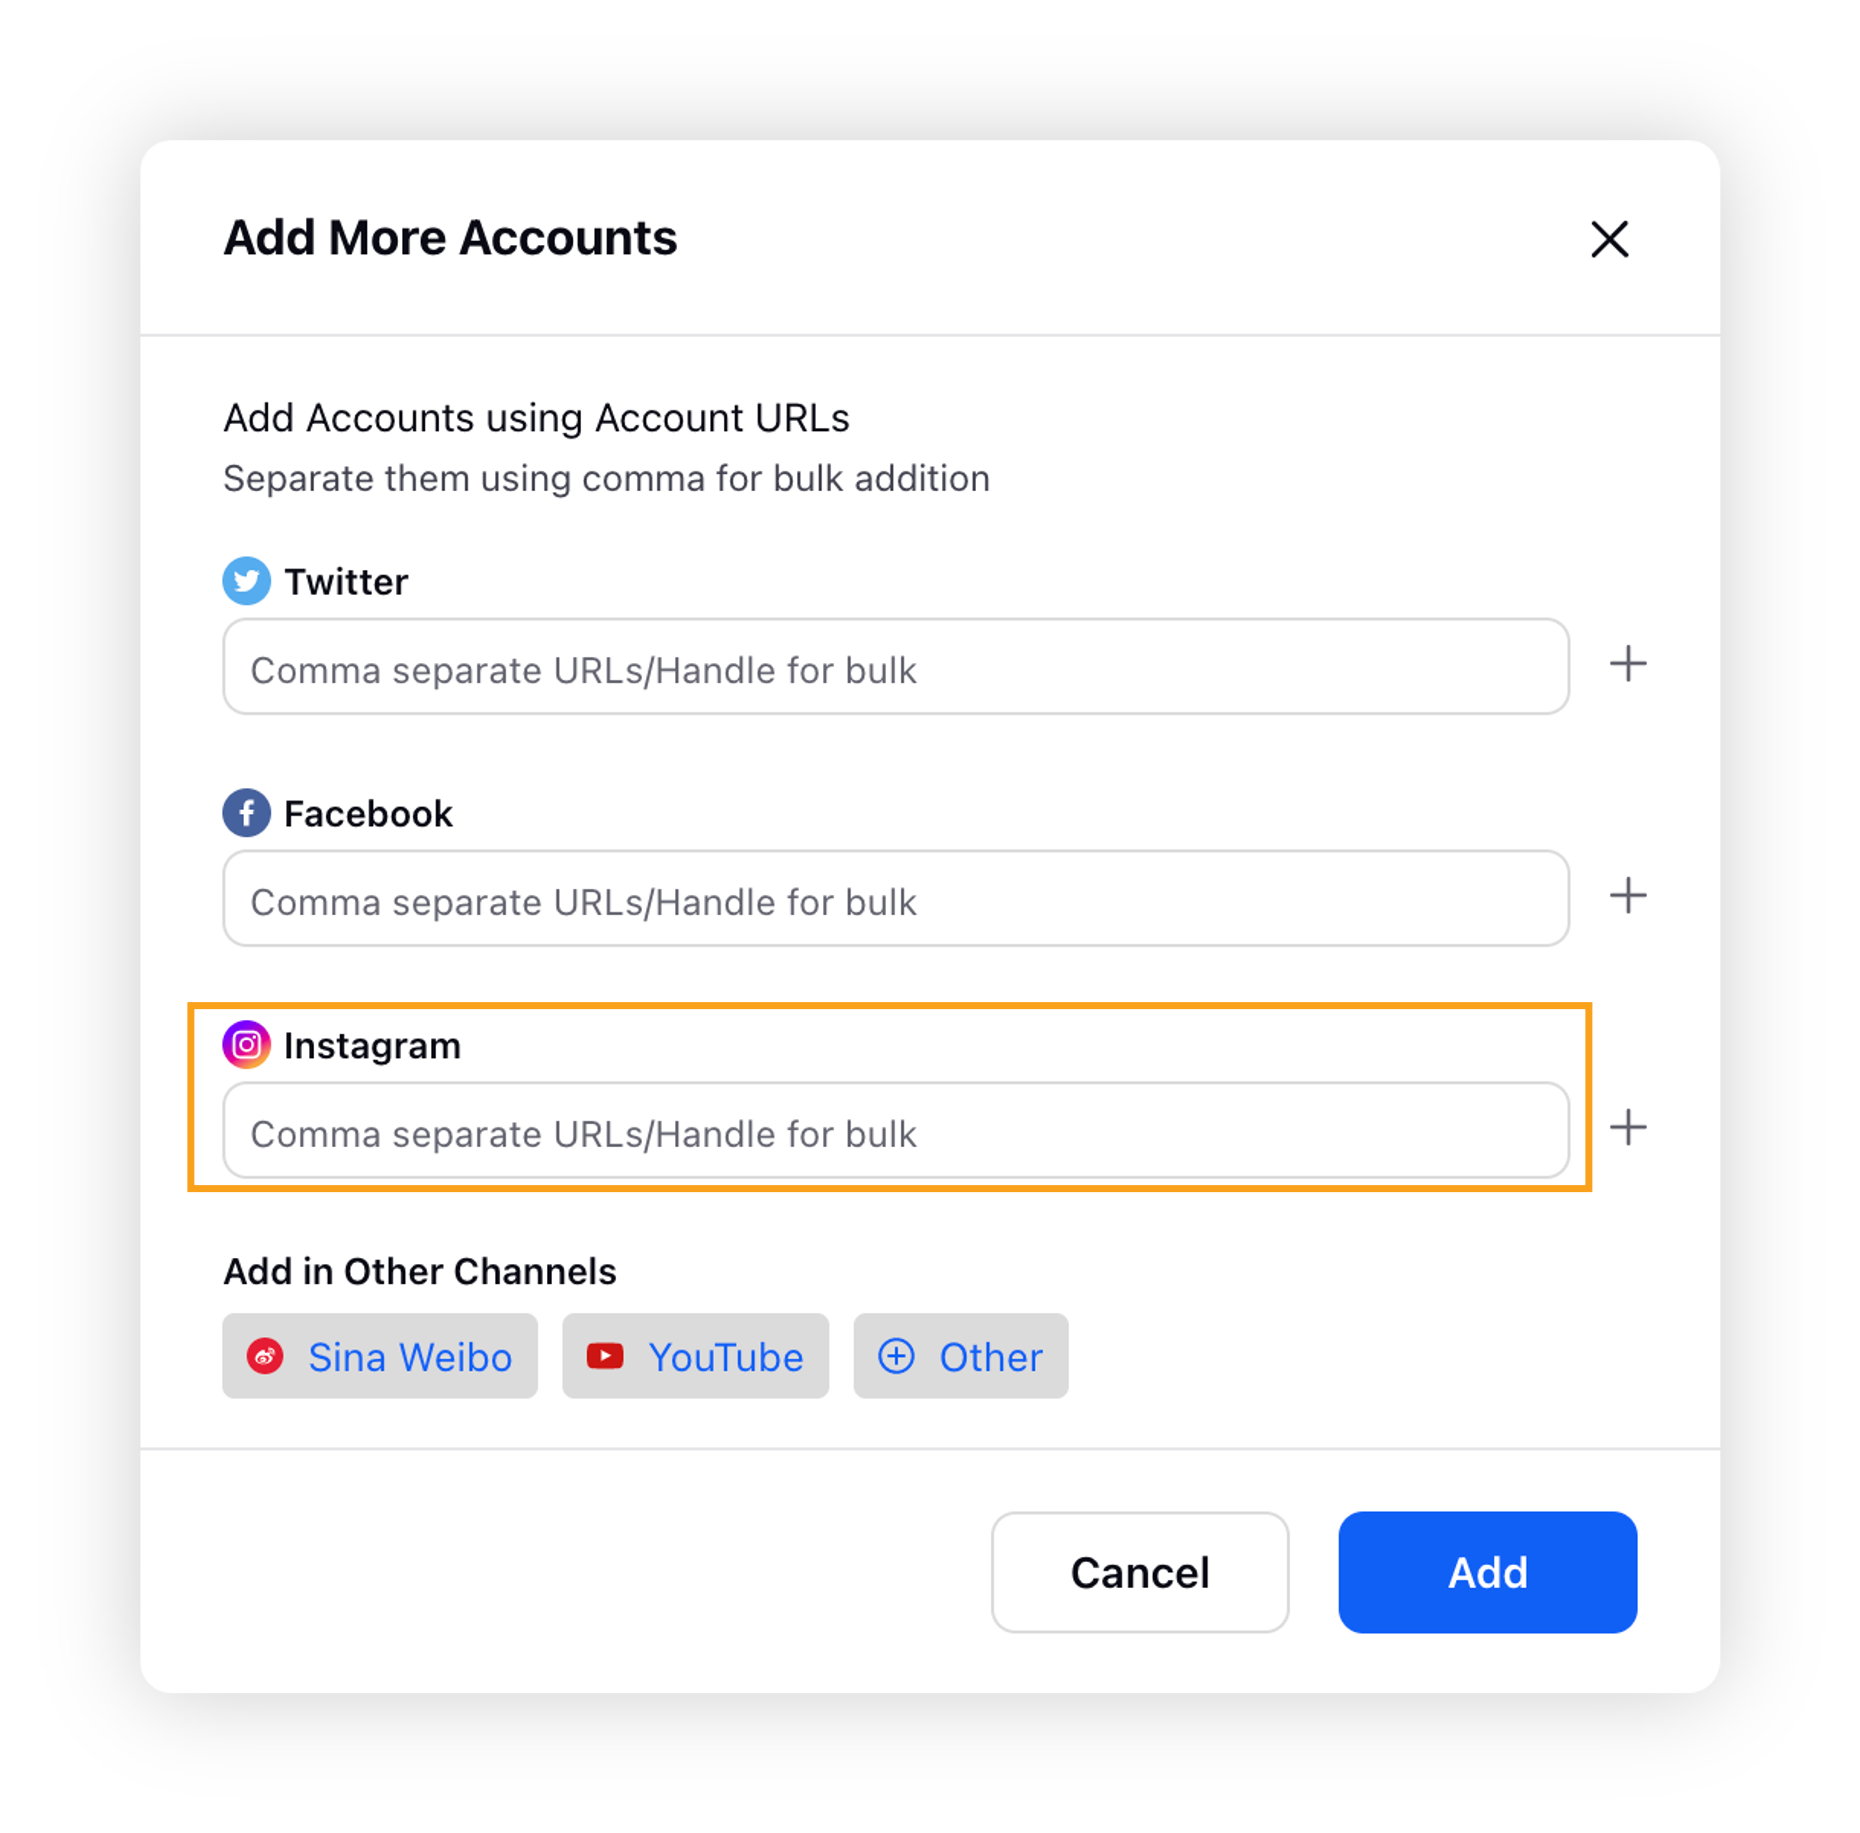
Click Add. For successful addition, a success message will be displayed saying "URLs have been successfully added to our database". On failure, an error message will be displayed as "Please correct the errors and resubmit".
Click Save.
Limitations
It might take between 2 to 24 hours for data to populate on the Benchmarking dashboards. There is no fixed time frame.
While adding account URLs, make sure you keep your account URLs fixed to the domain name, excluding the remaining path in the Add Account URL fields. For example –
Incorrect way – http://abc123.com/solutions/example=...test2#section3 (will not fetch results for that account)
Correct way – http://abc123.com/solutions
A maximum of 10 accounts can be added at a time in the Add URL section with comma(,) separated.
Only Public pages can be accessed in Benchmarking. Group pages, community pages, and private accounts are not supported in Benchmarking.
![]() Note: Instagram as a benchmarking data source only considers organic data/results. Due to API limitations, no paid data will be present.
Note: Instagram as a benchmarking data source only considers organic data/results. Due to API limitations, no paid data will be present.