Survey Analytics Overview
Updated
The upgraded Survey reporting features provide detailed, user-friendly analysis with interactive widgets summarizing each question’s results. Users can filter and analyze data by specific time frames for more focused insights.
Each question section automatically generates dynamic insights, including descriptive, correlational, trend, and regression analyses, offering deeper insights without extra clicks. This streamlined, interactive process allows for comprehensive data exploration.
The Analytics Module offers a powerful suite of tools tailored to diverse organizational needs, enabling users to extract actionable insights, prioritize improvements, and align feedback with business goals for more informed decision-making.It includes:
Standard Analytics Feed: An auto-generated report offering quick survey insights, powered by AI for hypothesis validation and text analytics.
Custom Reporting: A flexible solution for creating customized dashboards, enabling targeted analysis and comparison of key metrics across different dimensions.
Hierarchical Reporting: Survey data organized according to organizational hierarchies, providing relevant insights for teams at all levels.
This module ensures users can efficiently derive actionable insights, prioritize improvements, and align feedback with business objectives.
Business Problems Solved
Strategic Feedback Monitoring Across Hierarchies: To get a consolidated view of feedback across various locations to monitor trends and assess initiatives. Hierarchical Reporting can organise feedback by organization, region, and location, providing high-level insights and helping identify recurring issues. This data can then be used to prioritize investments and improve overall satisfaction.
Custom Insights for Segment Analysis: Custom Reporting can create tailored dashboards to analyze feedback by various factors like industry, usage and NPS. These insights help align features with your needs, improving customer satisfaction and adoption.
Quick Campaign Feedback for Marketing: The Standard Analytics Feed which helps they gain AI-powered insights, such as recurring feedback themes and text analysis, that helps refine future campaigns and improve engagement and ROI.
This feature helps extract meaningful insights from survey data, enhancing decision-making.
This feature includes several analytical steps, types of analytics, and statistical tests that are applied to various question types. You can create visualizations, summarize data and derive insights from survey responses.
The major differentiator for the feature is AI-powered Insight stream drivers of customer sentiment, emerging themes, suggestions to improve sentiment, automated correlation and regression analysis
Value Additions
Standard Analytics Feed: Provides automatically generated reports reduce manual effort, while tools like text analytics and hypothesis validation enhance decision-making.
Custom Reporting: Helps to create customized dashboards to meet specific analysis needs, providing focused insights and enabling trend comparisons across segments.
Hierarchical Reporting: Aligns survey data with organizational hierarchies, delivering relevant insights at each level. Simplifies data management with easy Excel/CSV updates.
This combination of tools makes survey data accessible, actionable, and aligned with business objectives, making it a crucial element of any customer feedback strategy.
Prerequisites
You need to have access to View and Edit permissions for both Response and Analytics of the survey.
Configuration Steps
After the responses are gathered, advanced survey analytics will help to gather more insights about the survey. Follow the steps to understand survey analytics. Different kinds of questions can be used in a survey, and we can get an analysis for each question.
In the Builder, you can create the following types of questions:
Multiple Choice
Text Field
NPS rating
CSAT Rating
Slider
Rating Scale
Rank Order
Matrix
Let's look at analysis of each question type:
Anytime someone fills the survey the feed flowing into the builder automatically comes up to the Analytics tab and it gets updated automatically. The widgets are defined from the question type. Each question type governs certain visualizations.
Example: Multiple Choice would have different visualization and data representation.
Multiple Choice
Allows you to select options.
Steps
Click Analytics
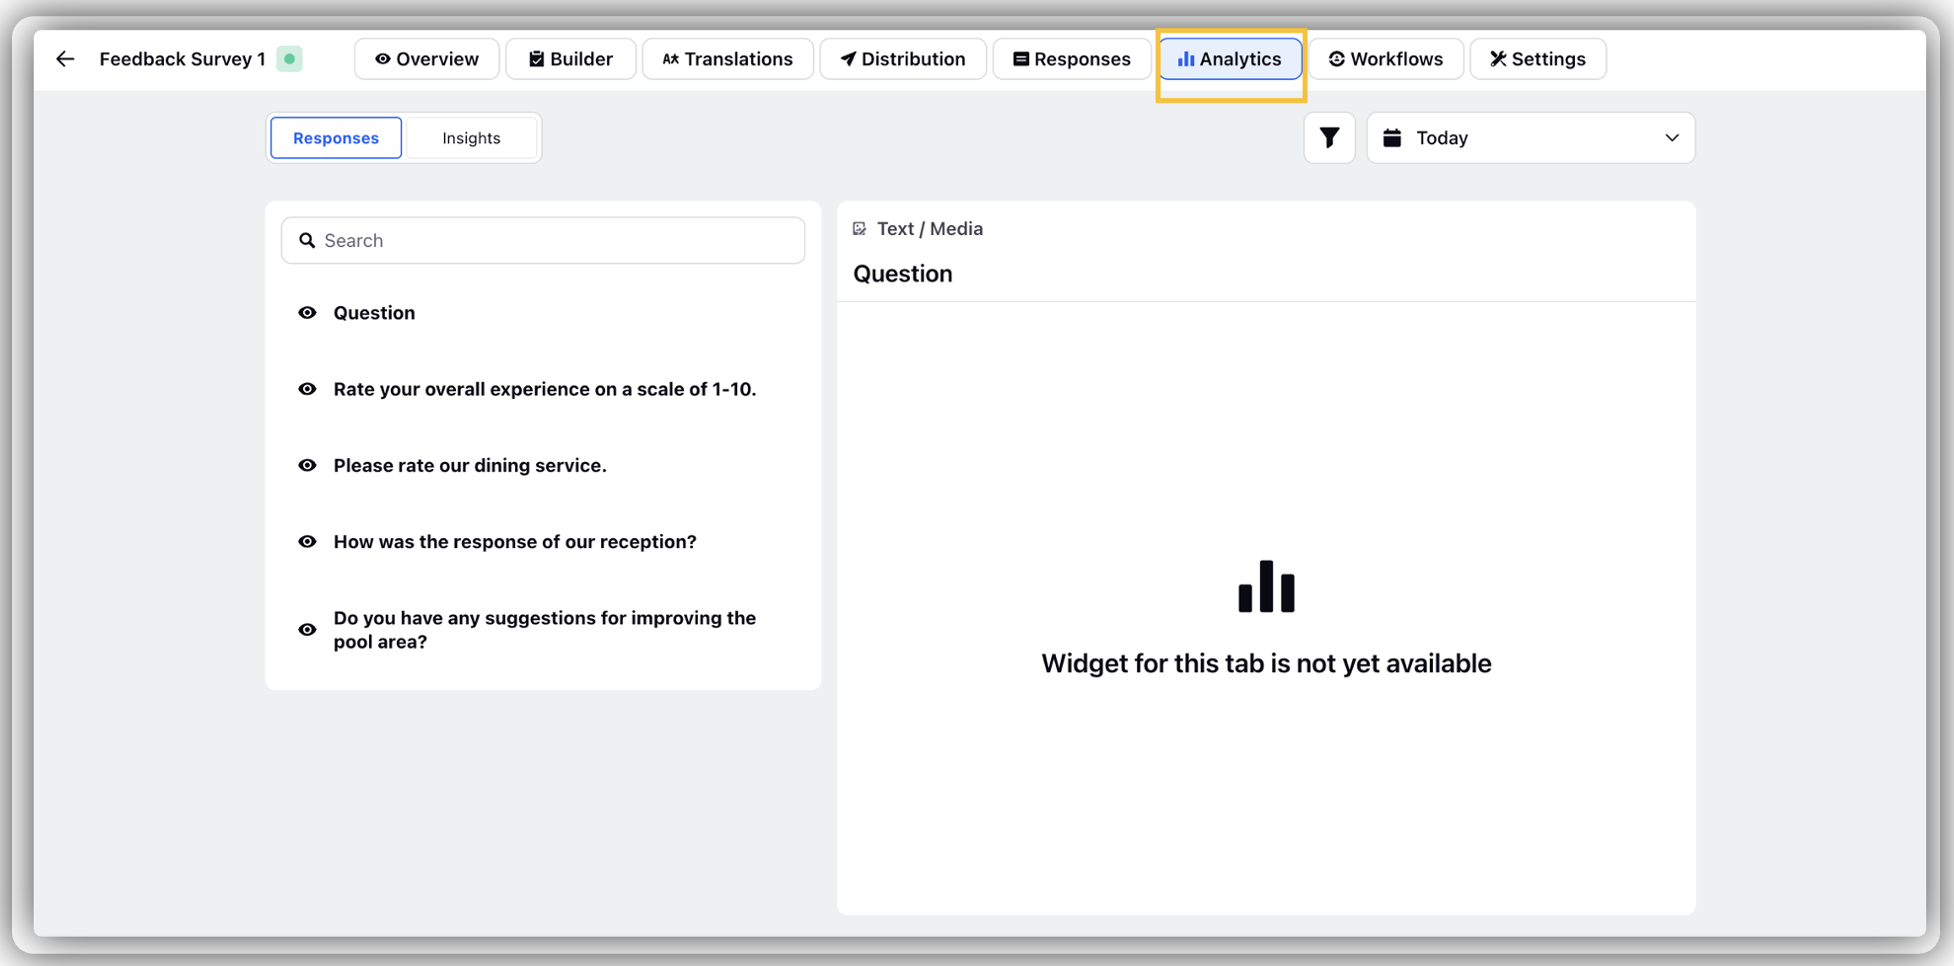
Click Response and click Multiple Choise Question
Click Response Distribution to find the response distrbution of the multiple choice options.
Widget level attributes
Sort Messages: Helps to sort the messages.
Refresh: Helps to refresh the widget.
Generate Summary: Helps to get the question summary.
Filter: Helps to apply filter.
Ellipses (...) : By click on that we can apply data label, show legend and show percentage.
Calendar option helps you to select the date range(last 30 days, today, lifetime, etc).
Red Dot: Red Dot on a question denotes that the question is mandatory.
Click on Hide (eye symbol) next to each question to hide that question from specific audience.
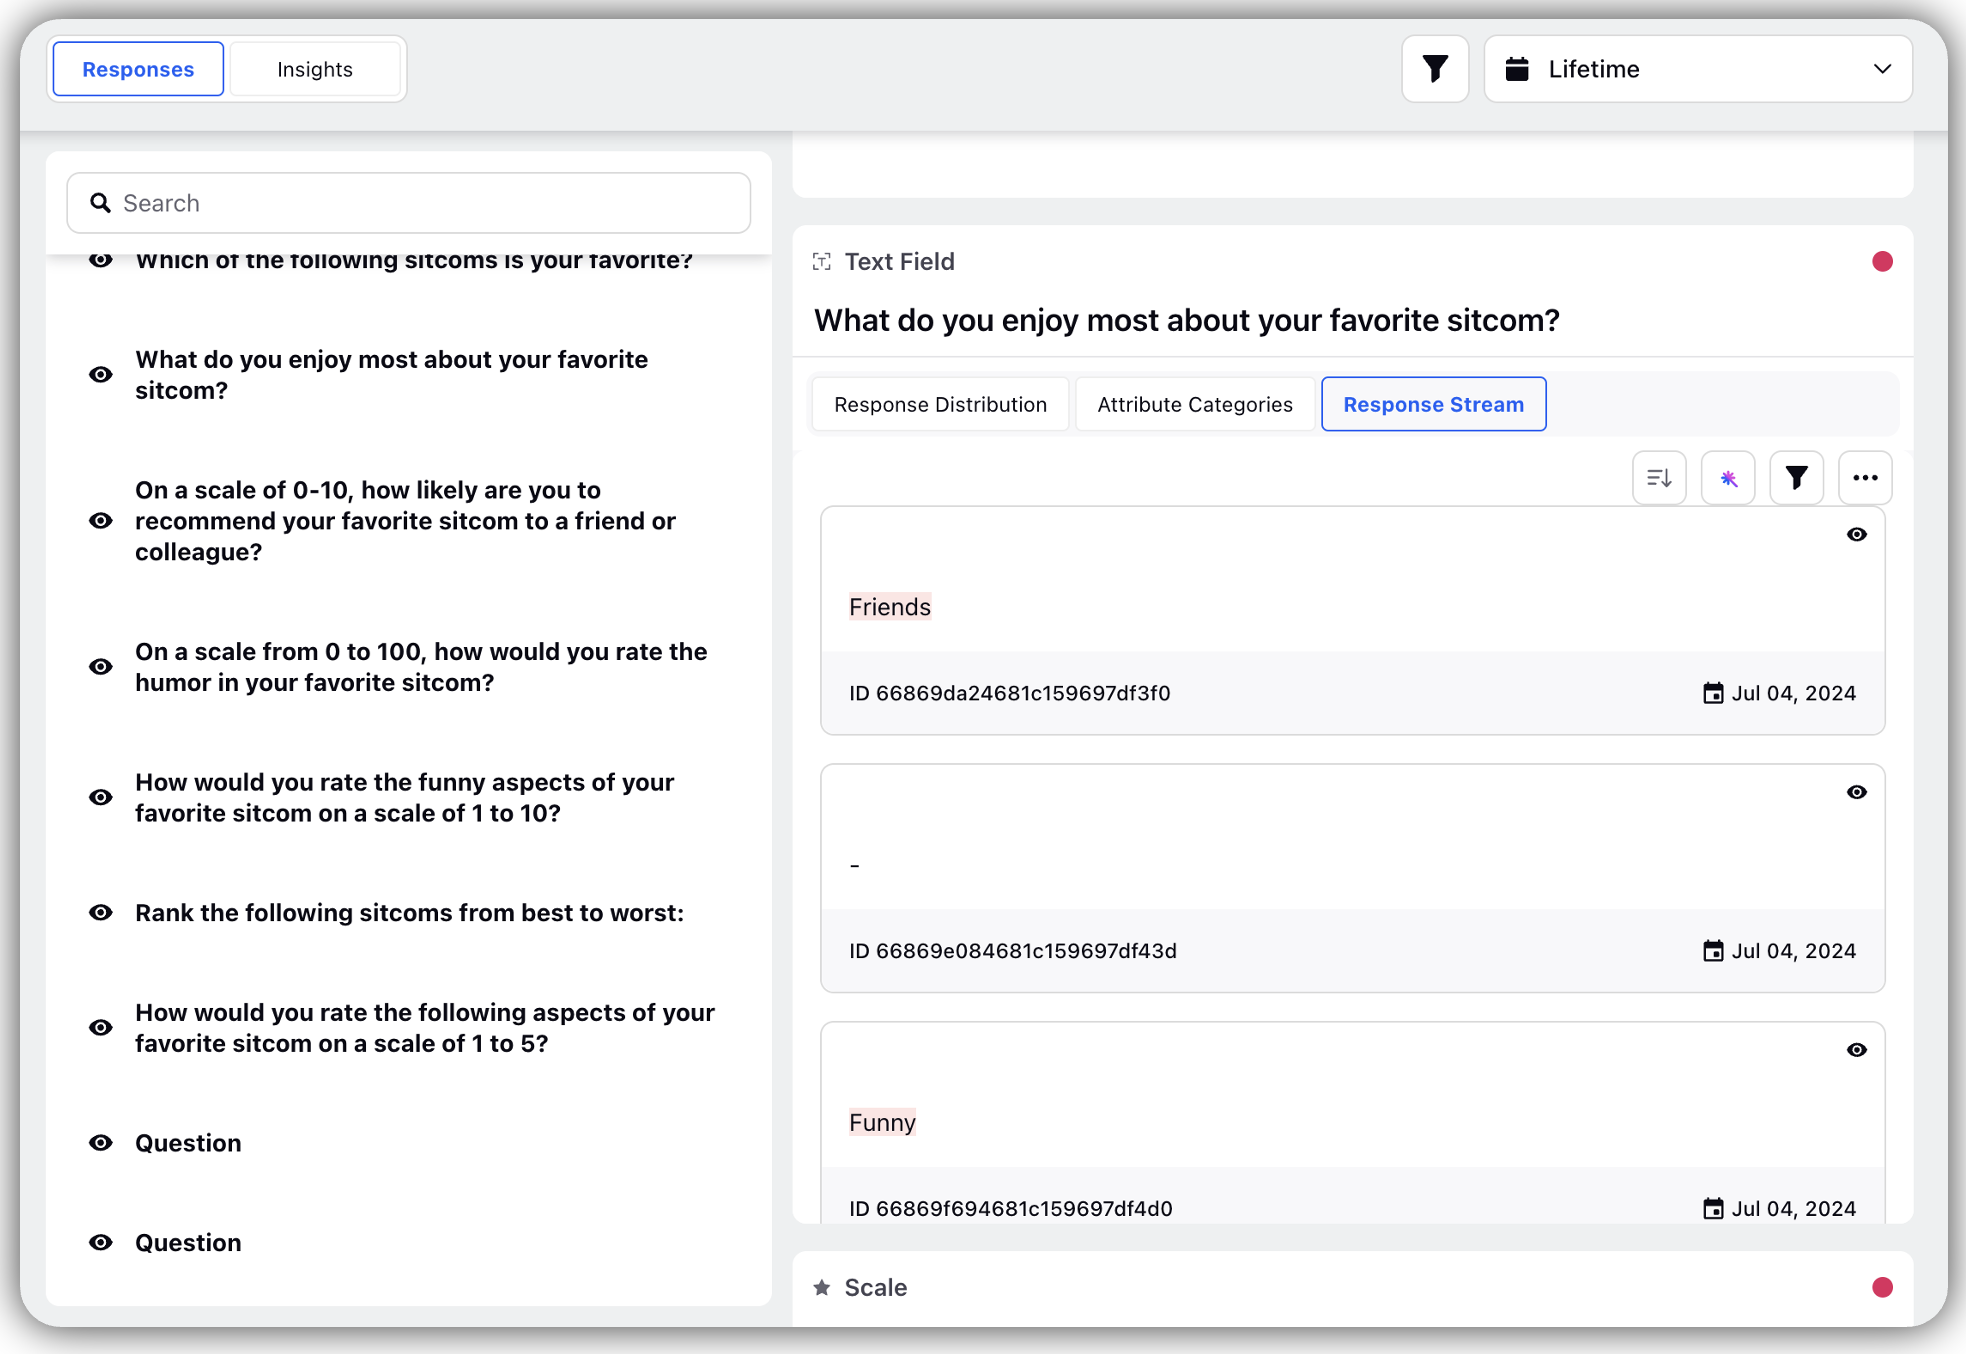
Text Field
Allows you to write text freely.
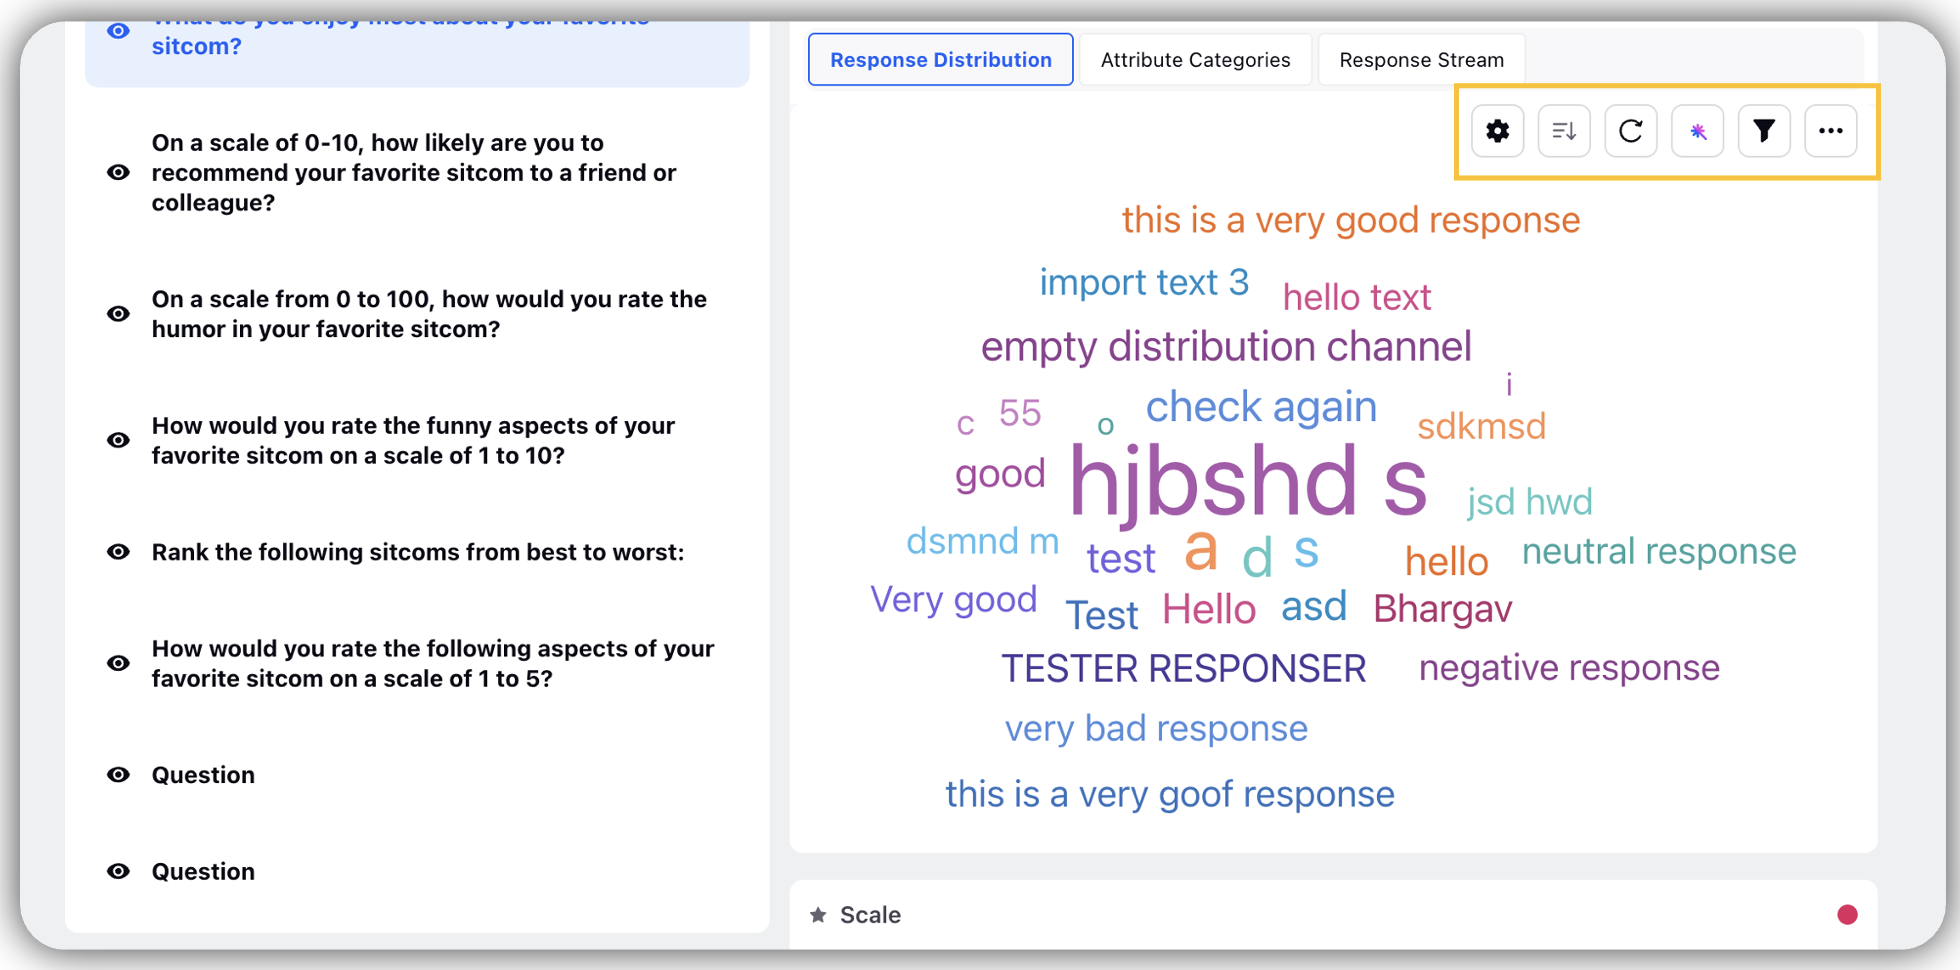
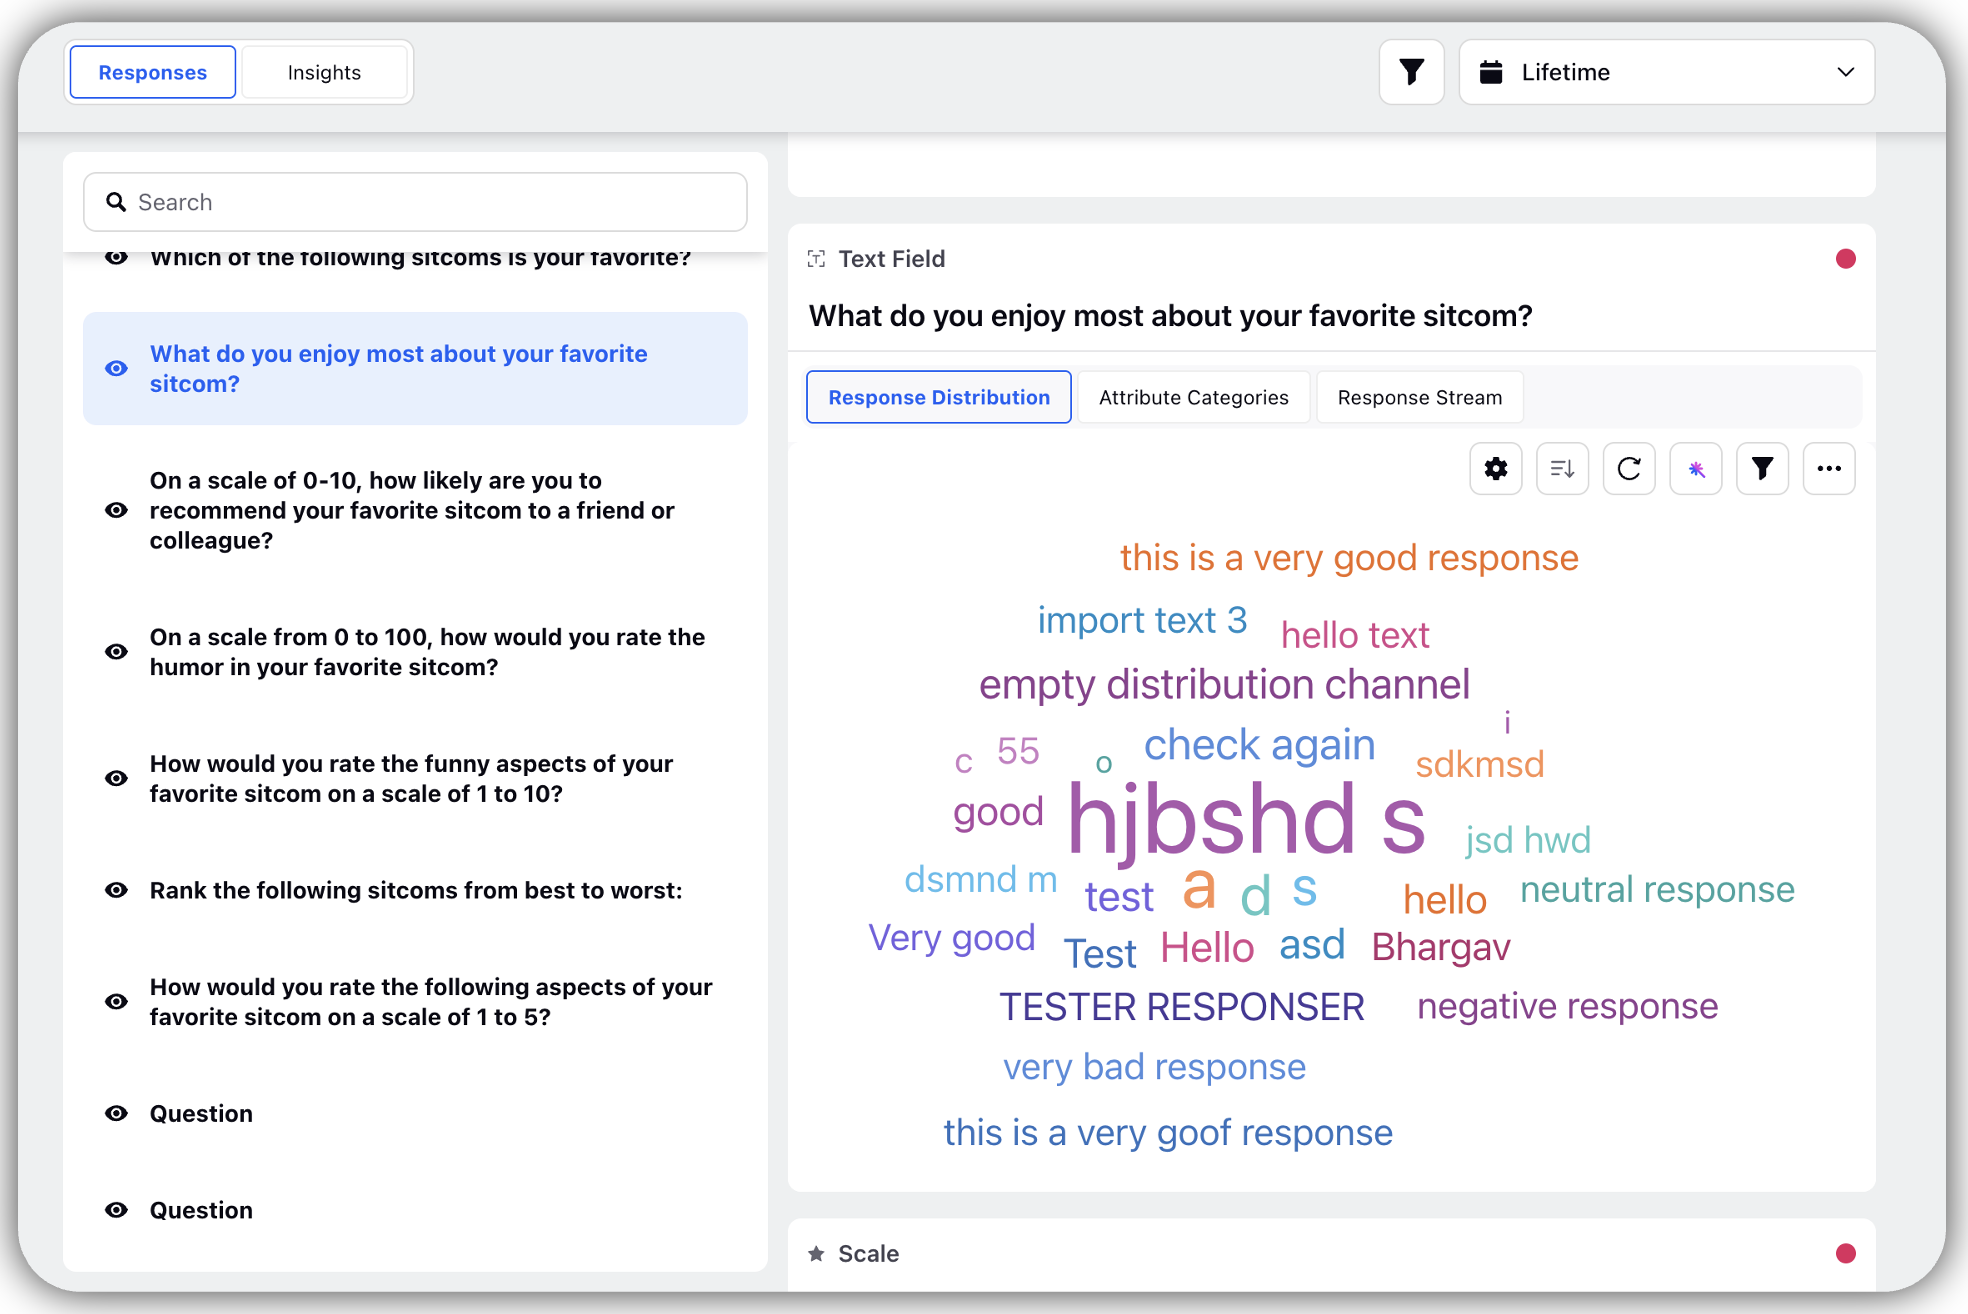
Steps
Click Response Distribution the AI would bucketize the response and create a word cloud.
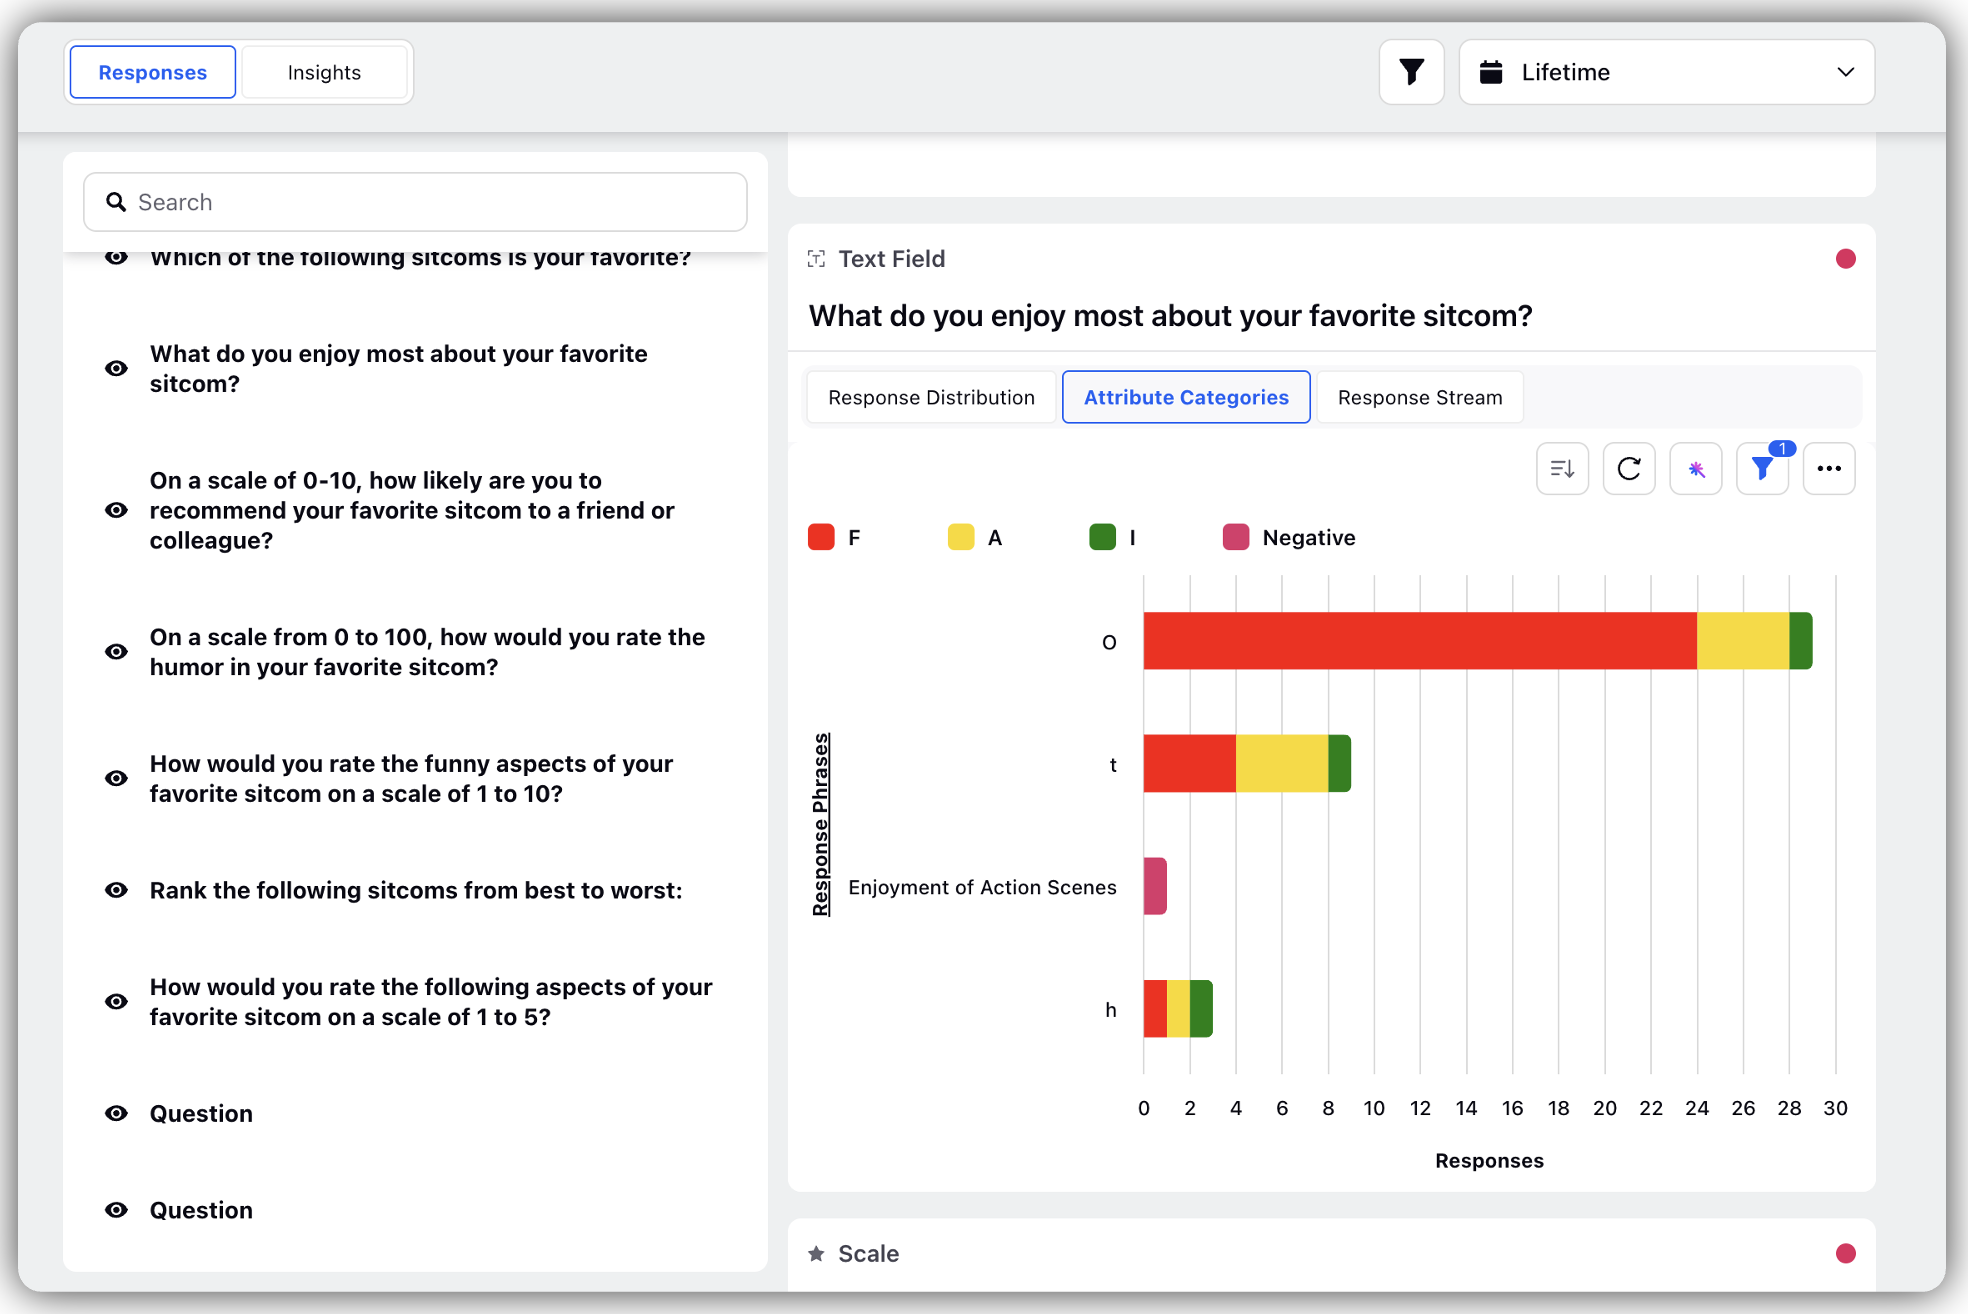
Click Attributes Category will break long messages into phrases and each phrase will be represented and categorized as positive, negative and neutral sentiment.
Click Response Stream where you can find actual response which is overlaid with the sentiment and attribute.
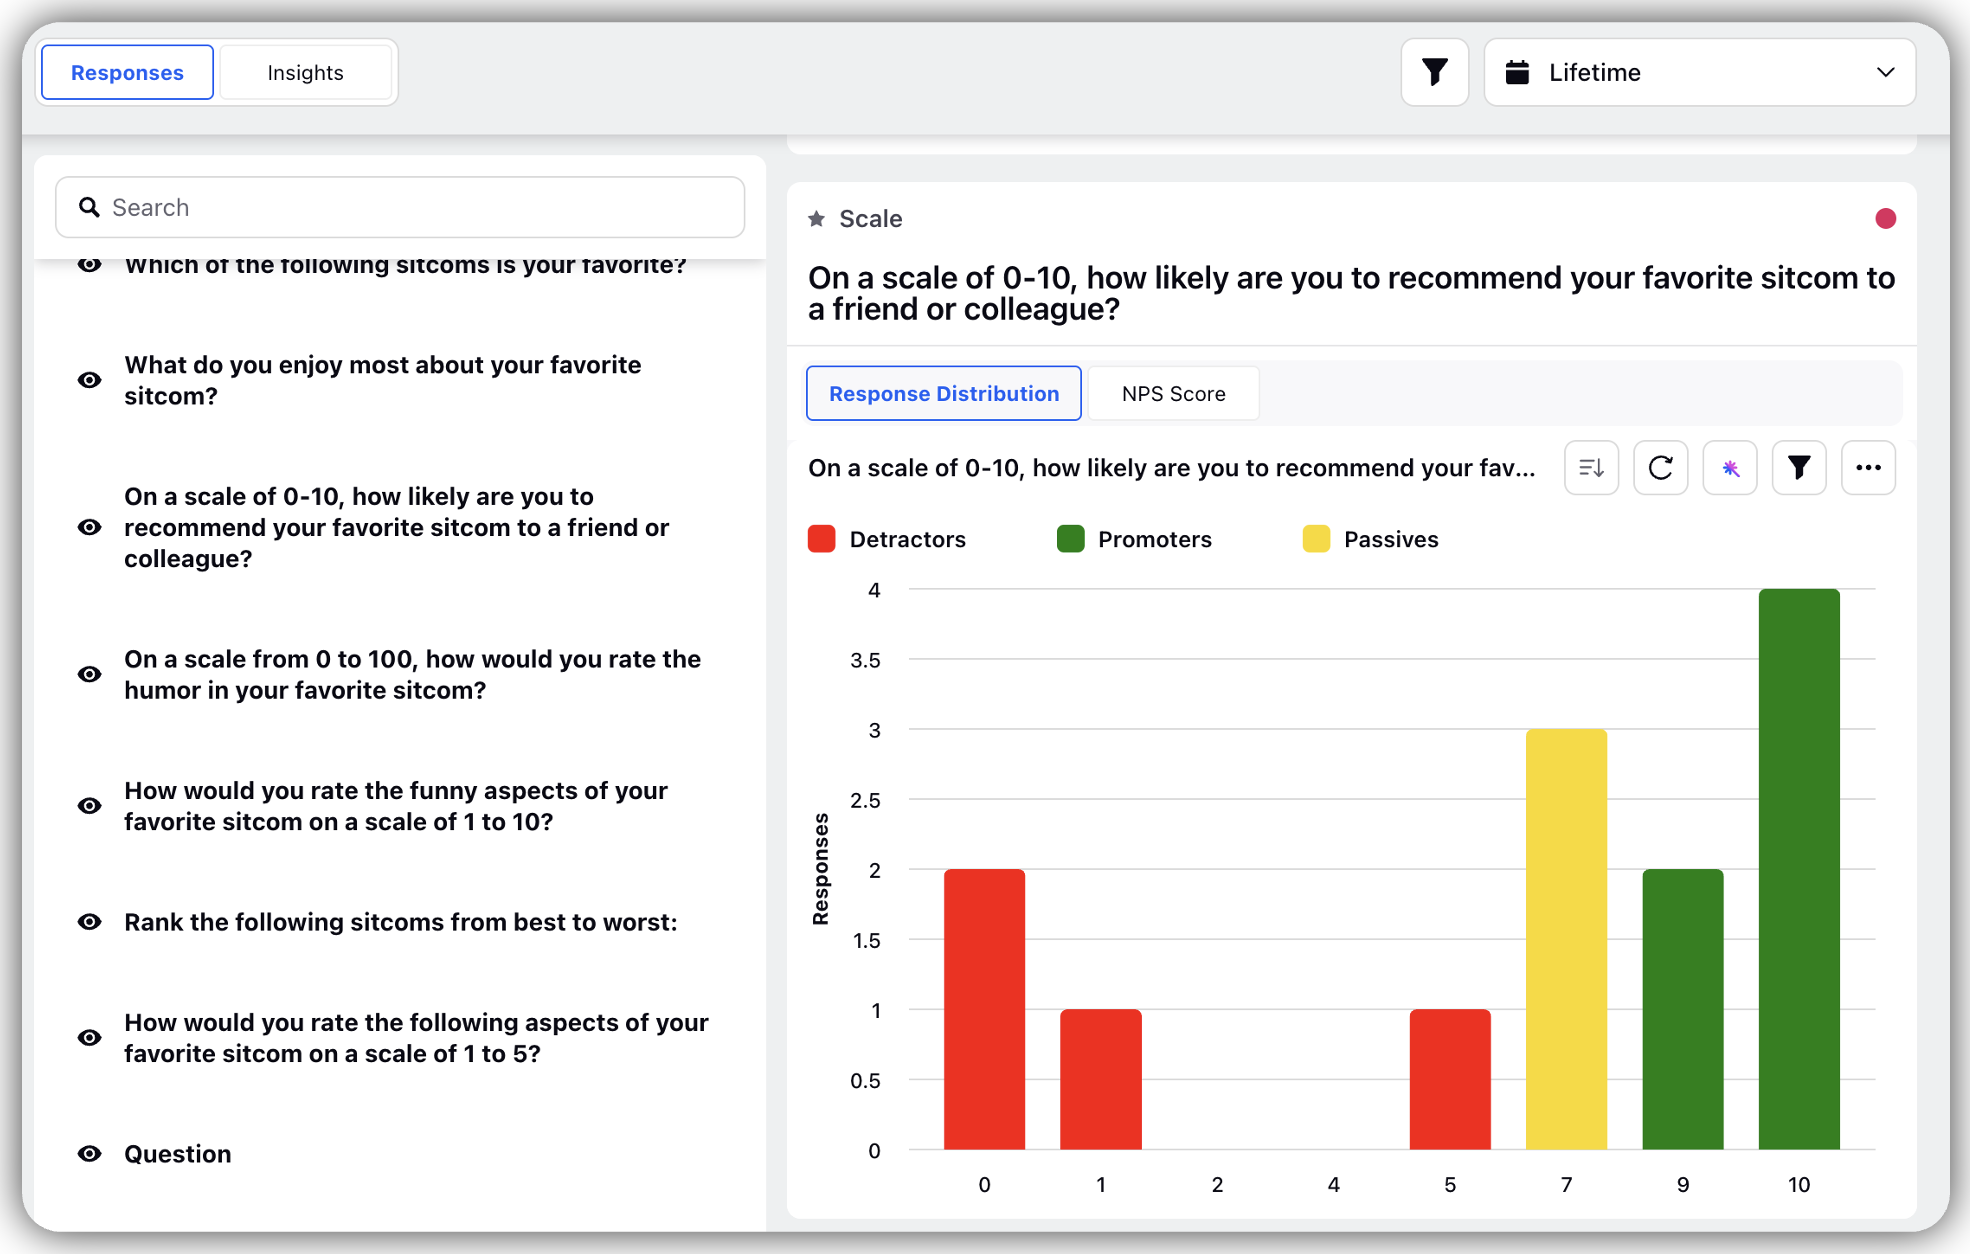
NPS Rating
Helps to gauge customer satisfraction of a survey
Steps
Click Response Distribution to check the distribution of responses. The bar chart represents the distribution of Promoters (8-10), Detractors (0-5) and Neutrals (6-7).
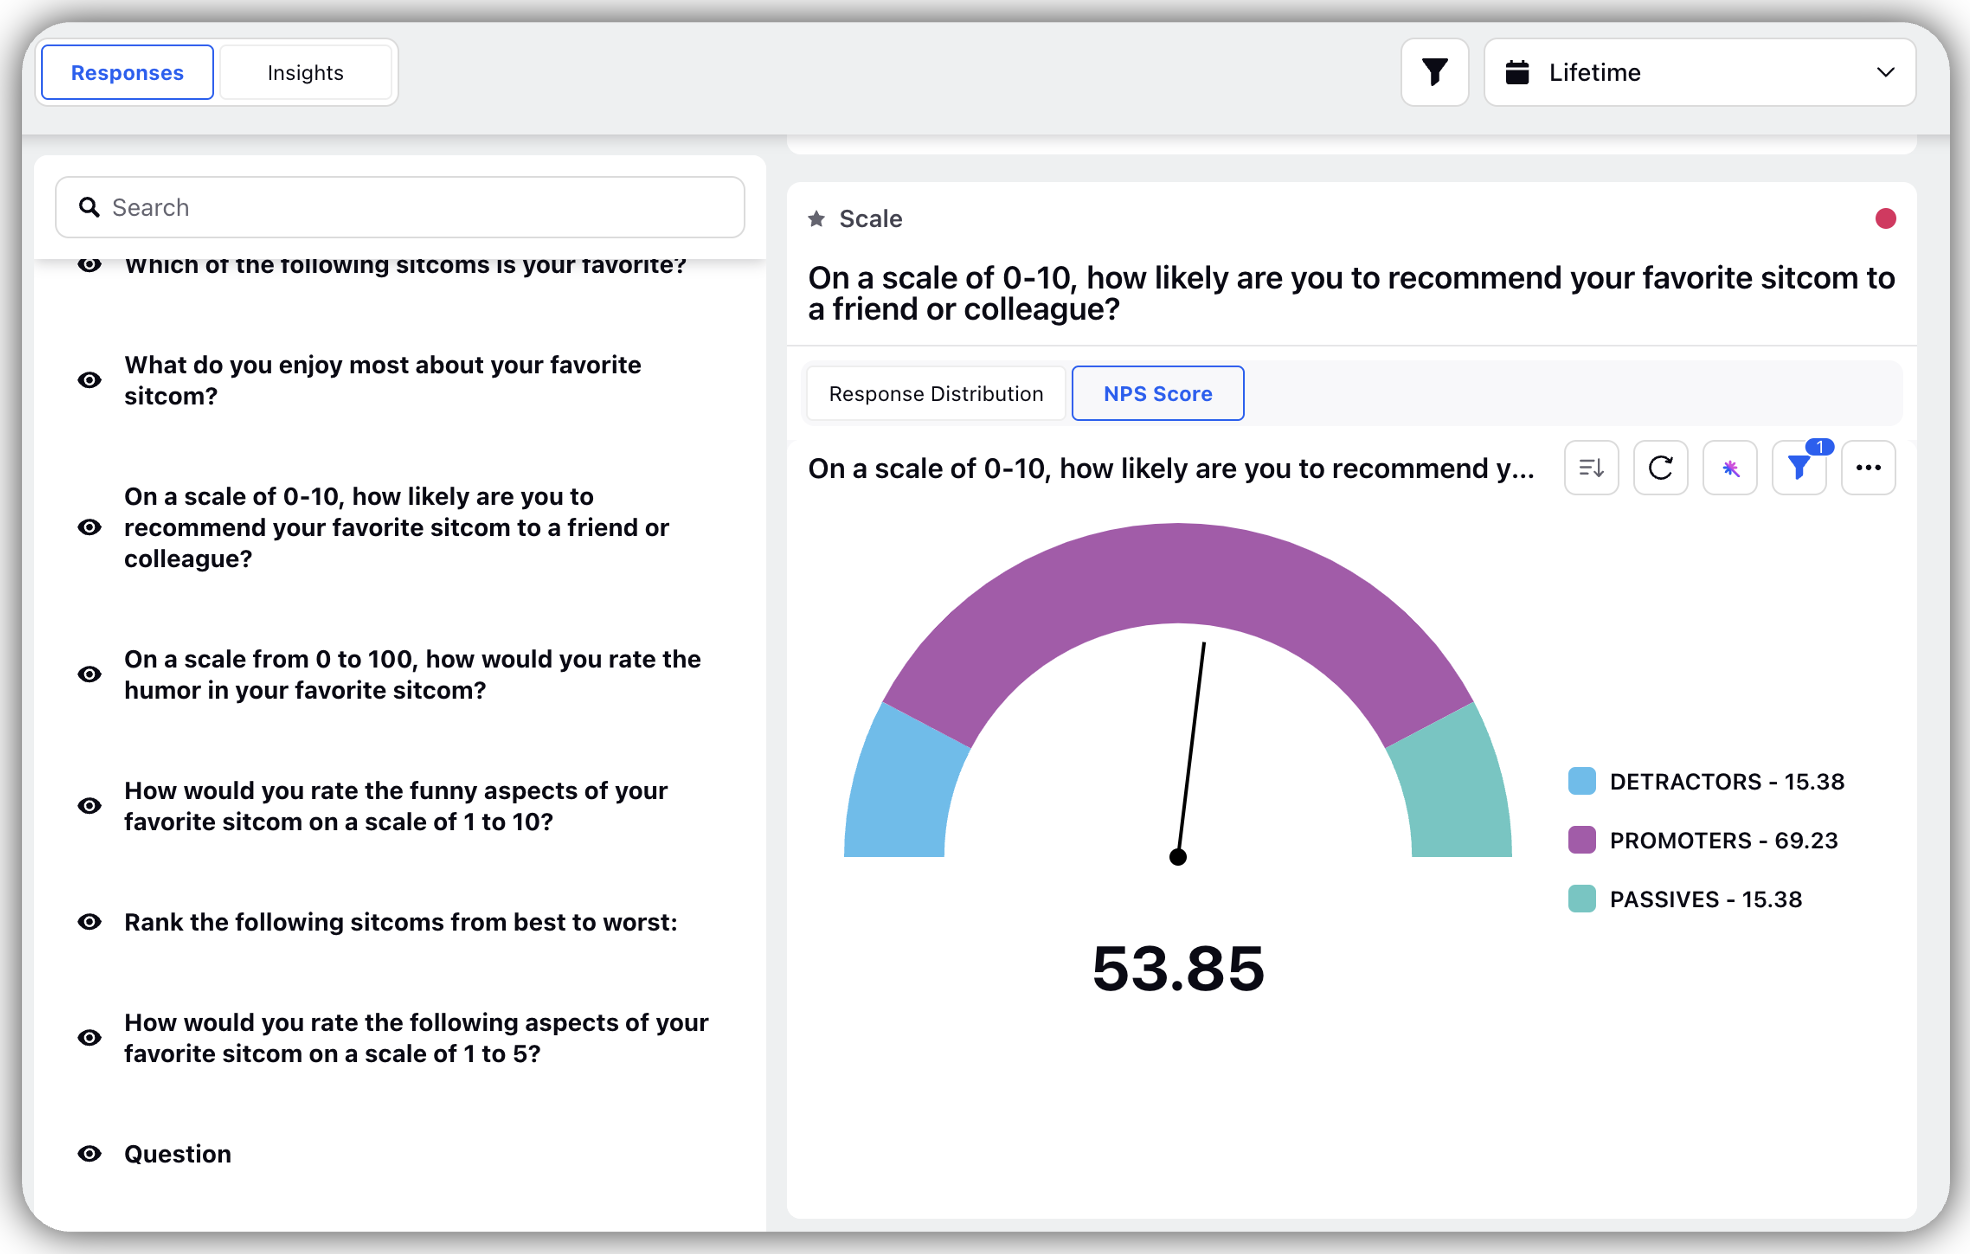
Click NPS Score which shows the overall score basis promoters, detractors and passives.
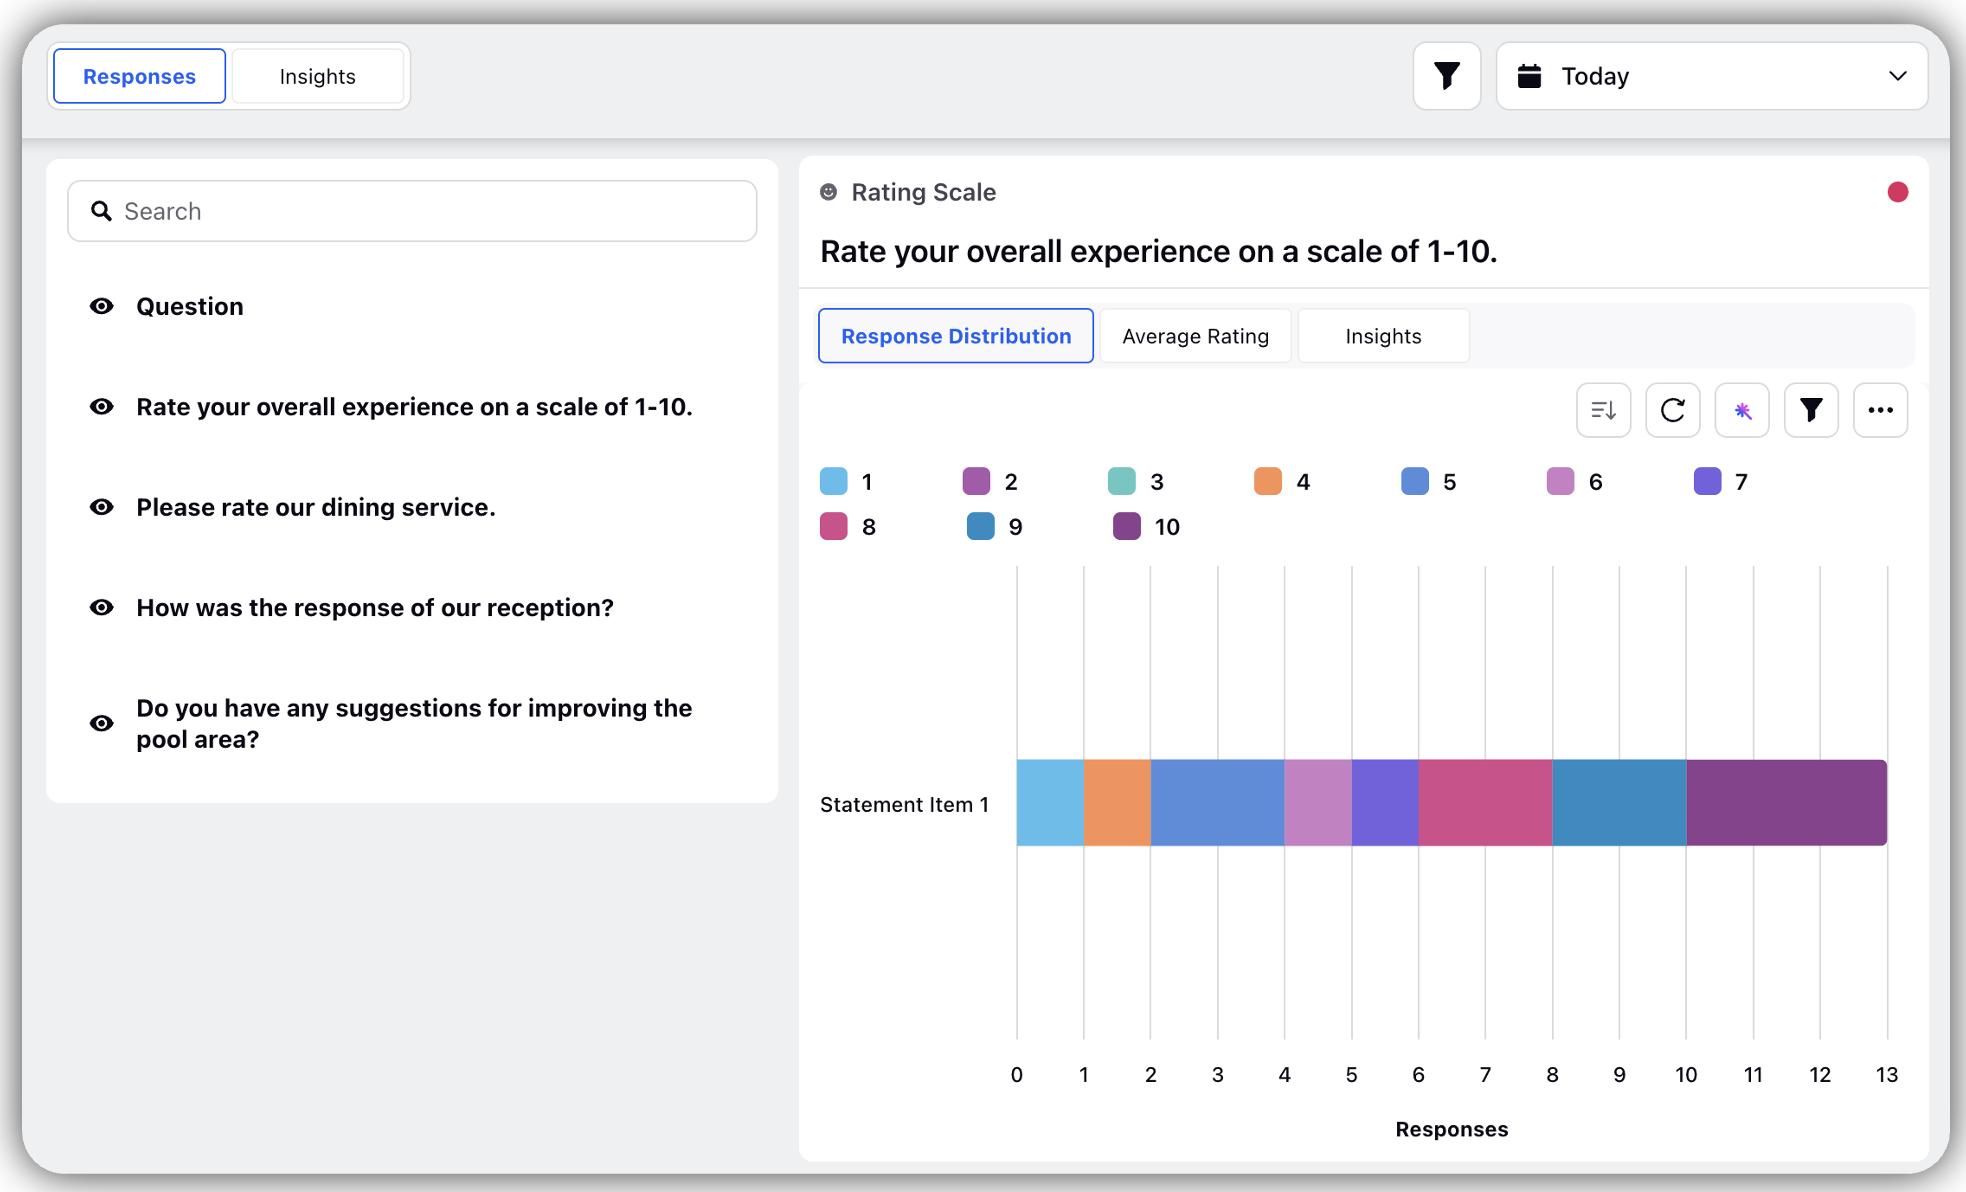
CSAT Rating
Helps to determine the customer satisfraction score on a scale of 0-10
Steps
Click Response Distribution to check the response against each scale.
Click CSAT Rating to check the average rating of that question.
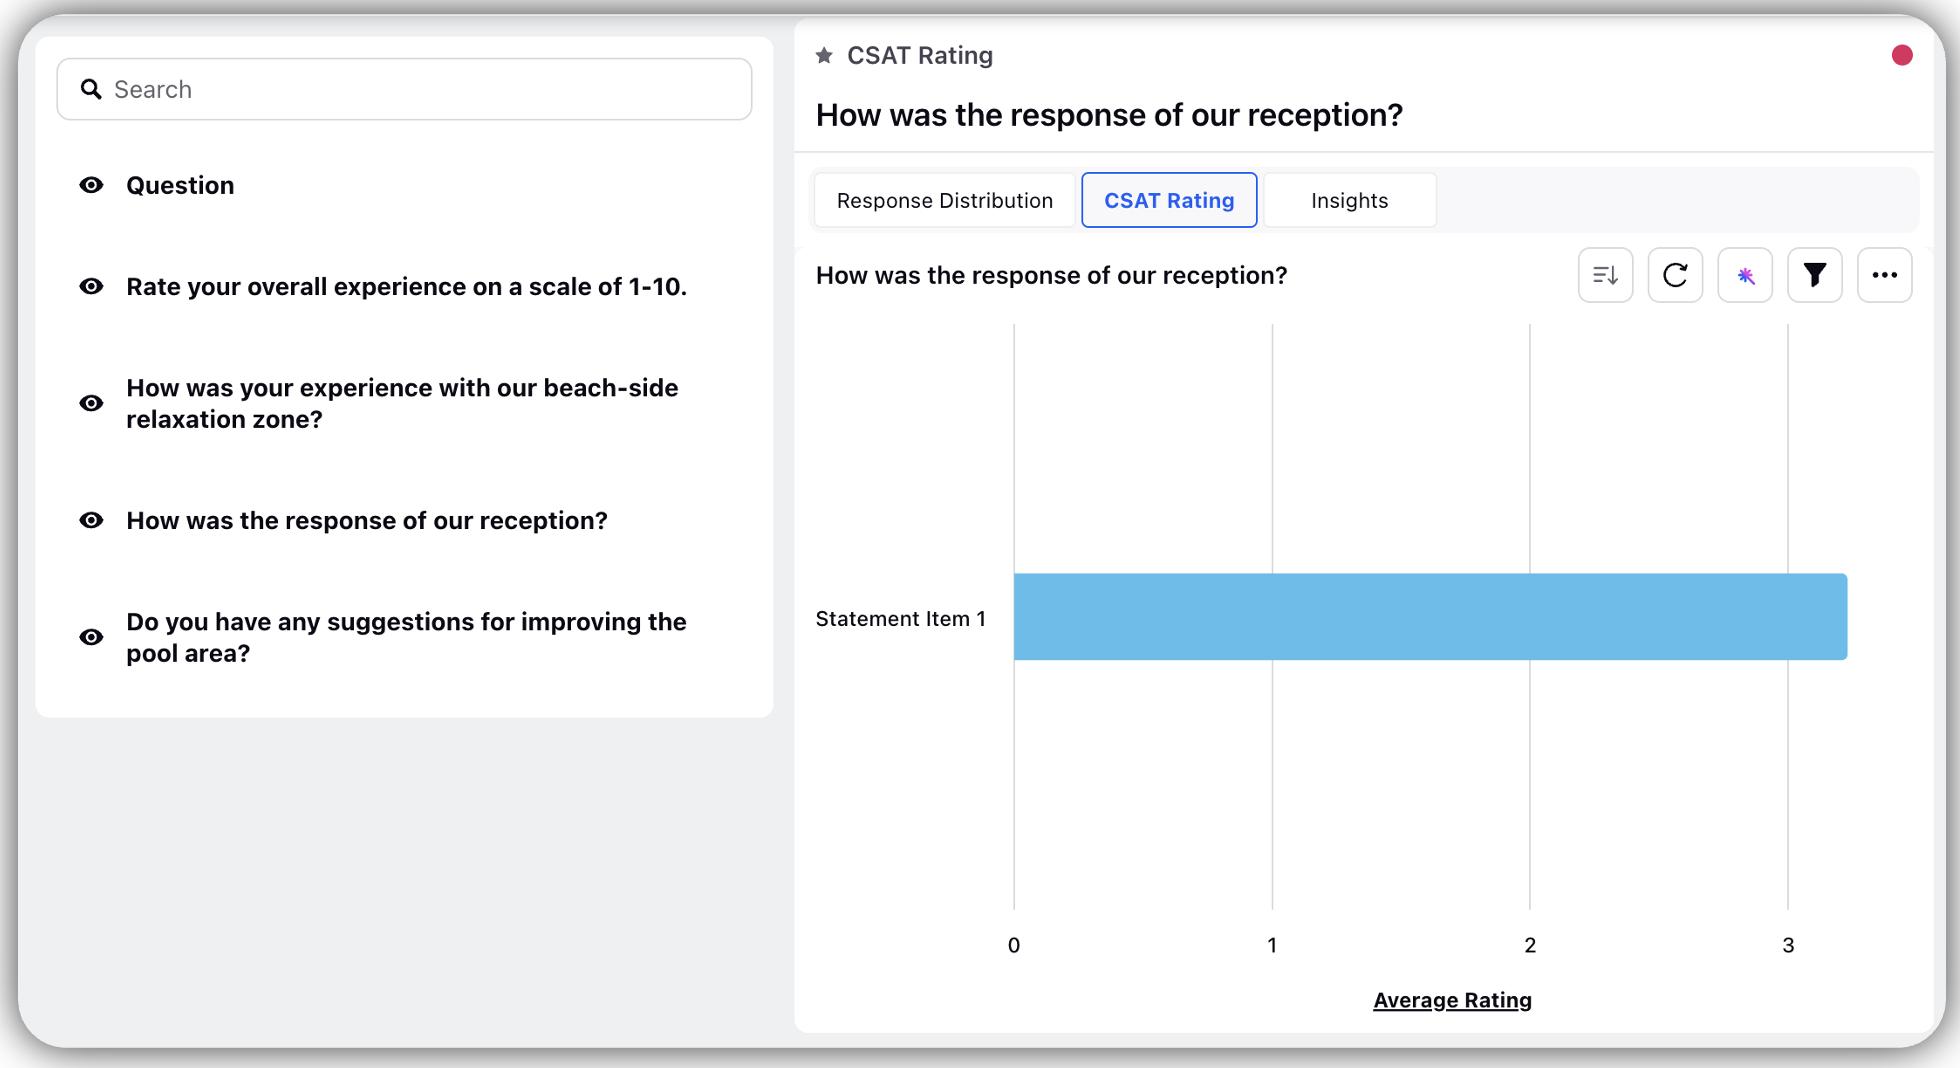
Click Insights to get insights of each response.
Slider
The horozontal slider under the question text helps to determine respondents response.
Steps
Click Response Distribution to find the bifuration of responses.
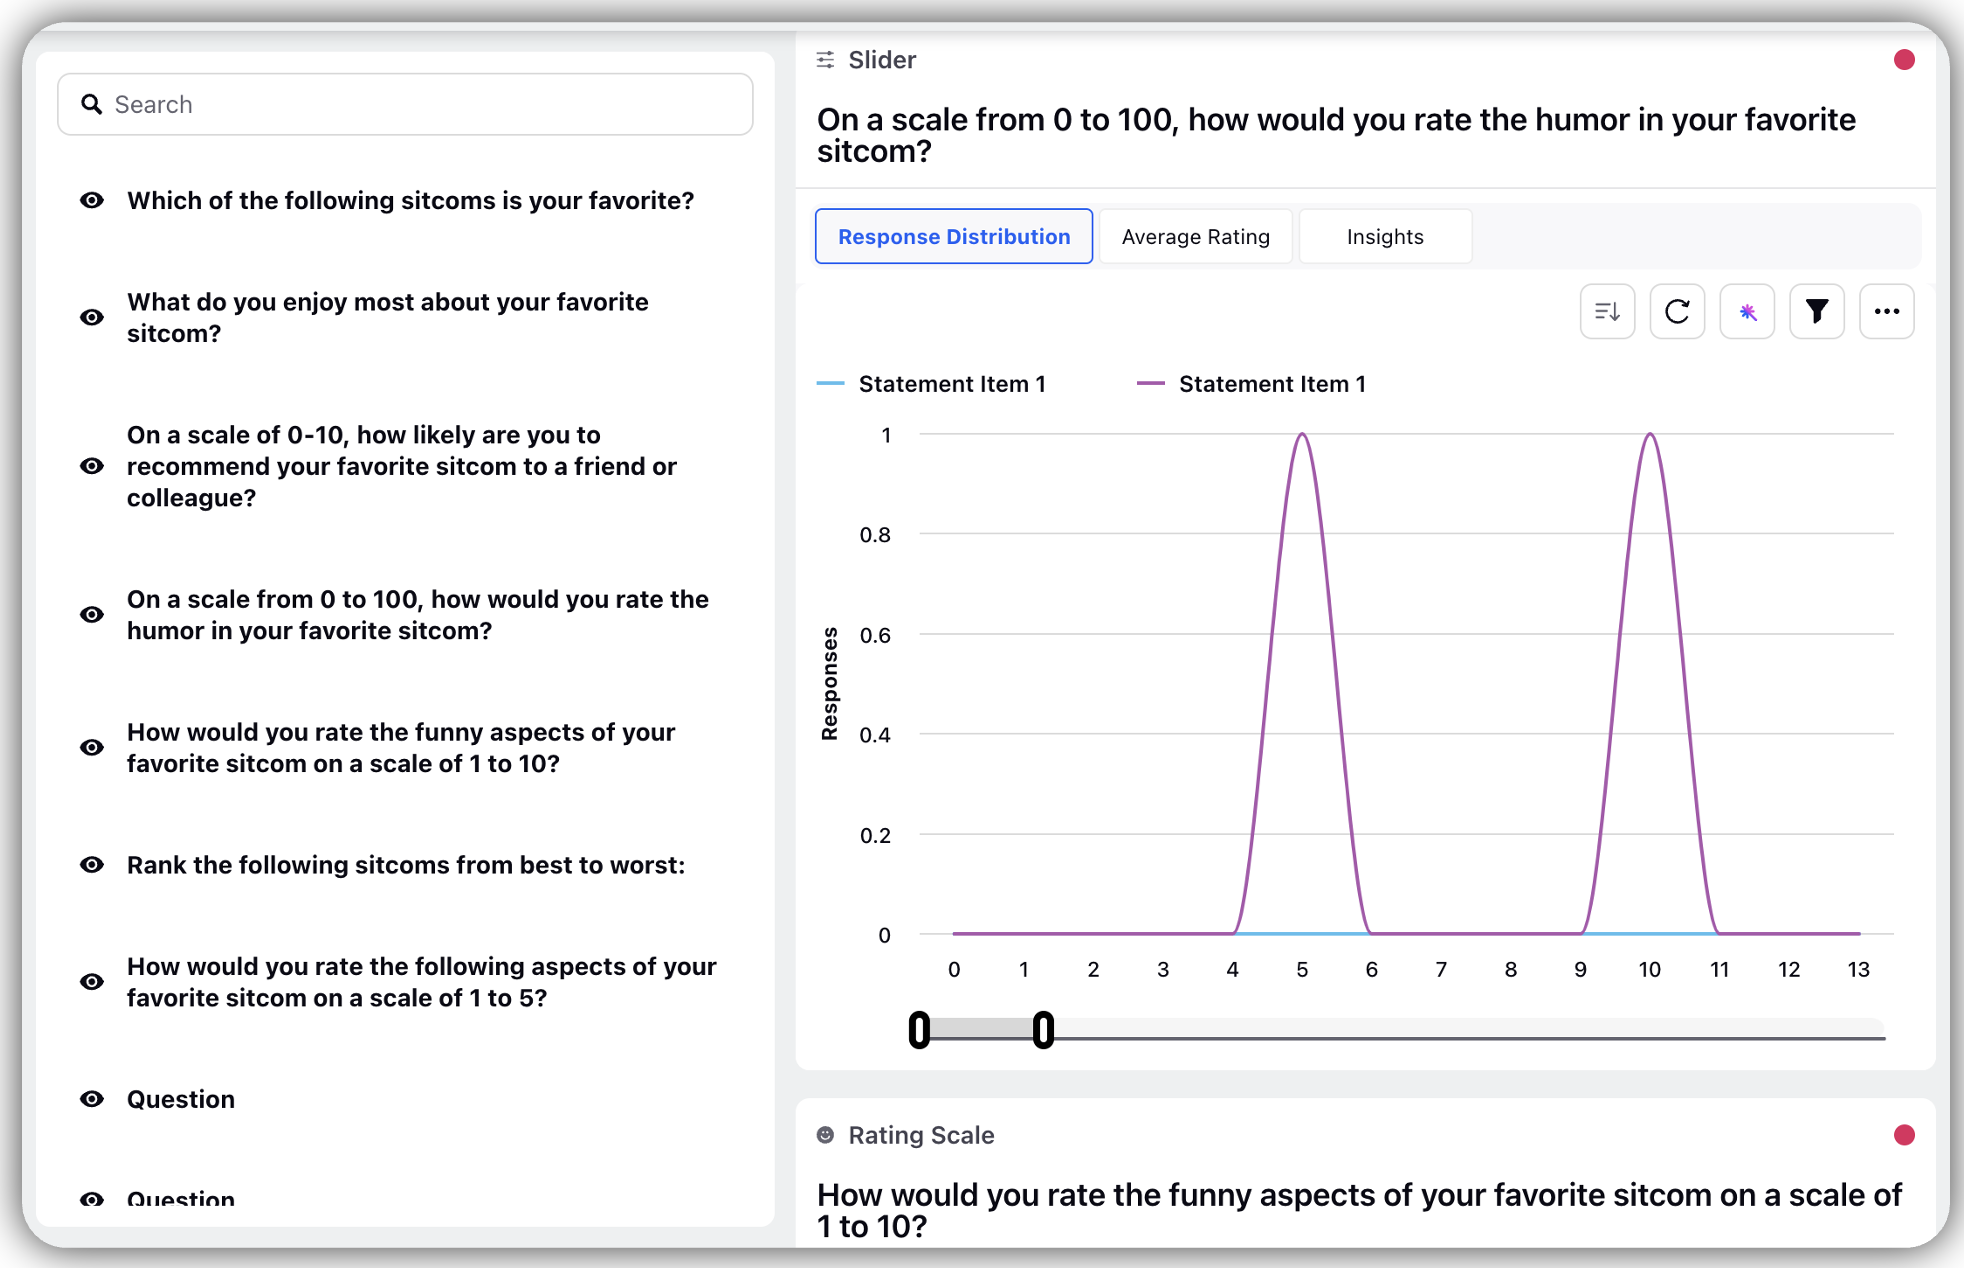
Click Average Rating to check average rating of all responses put together.
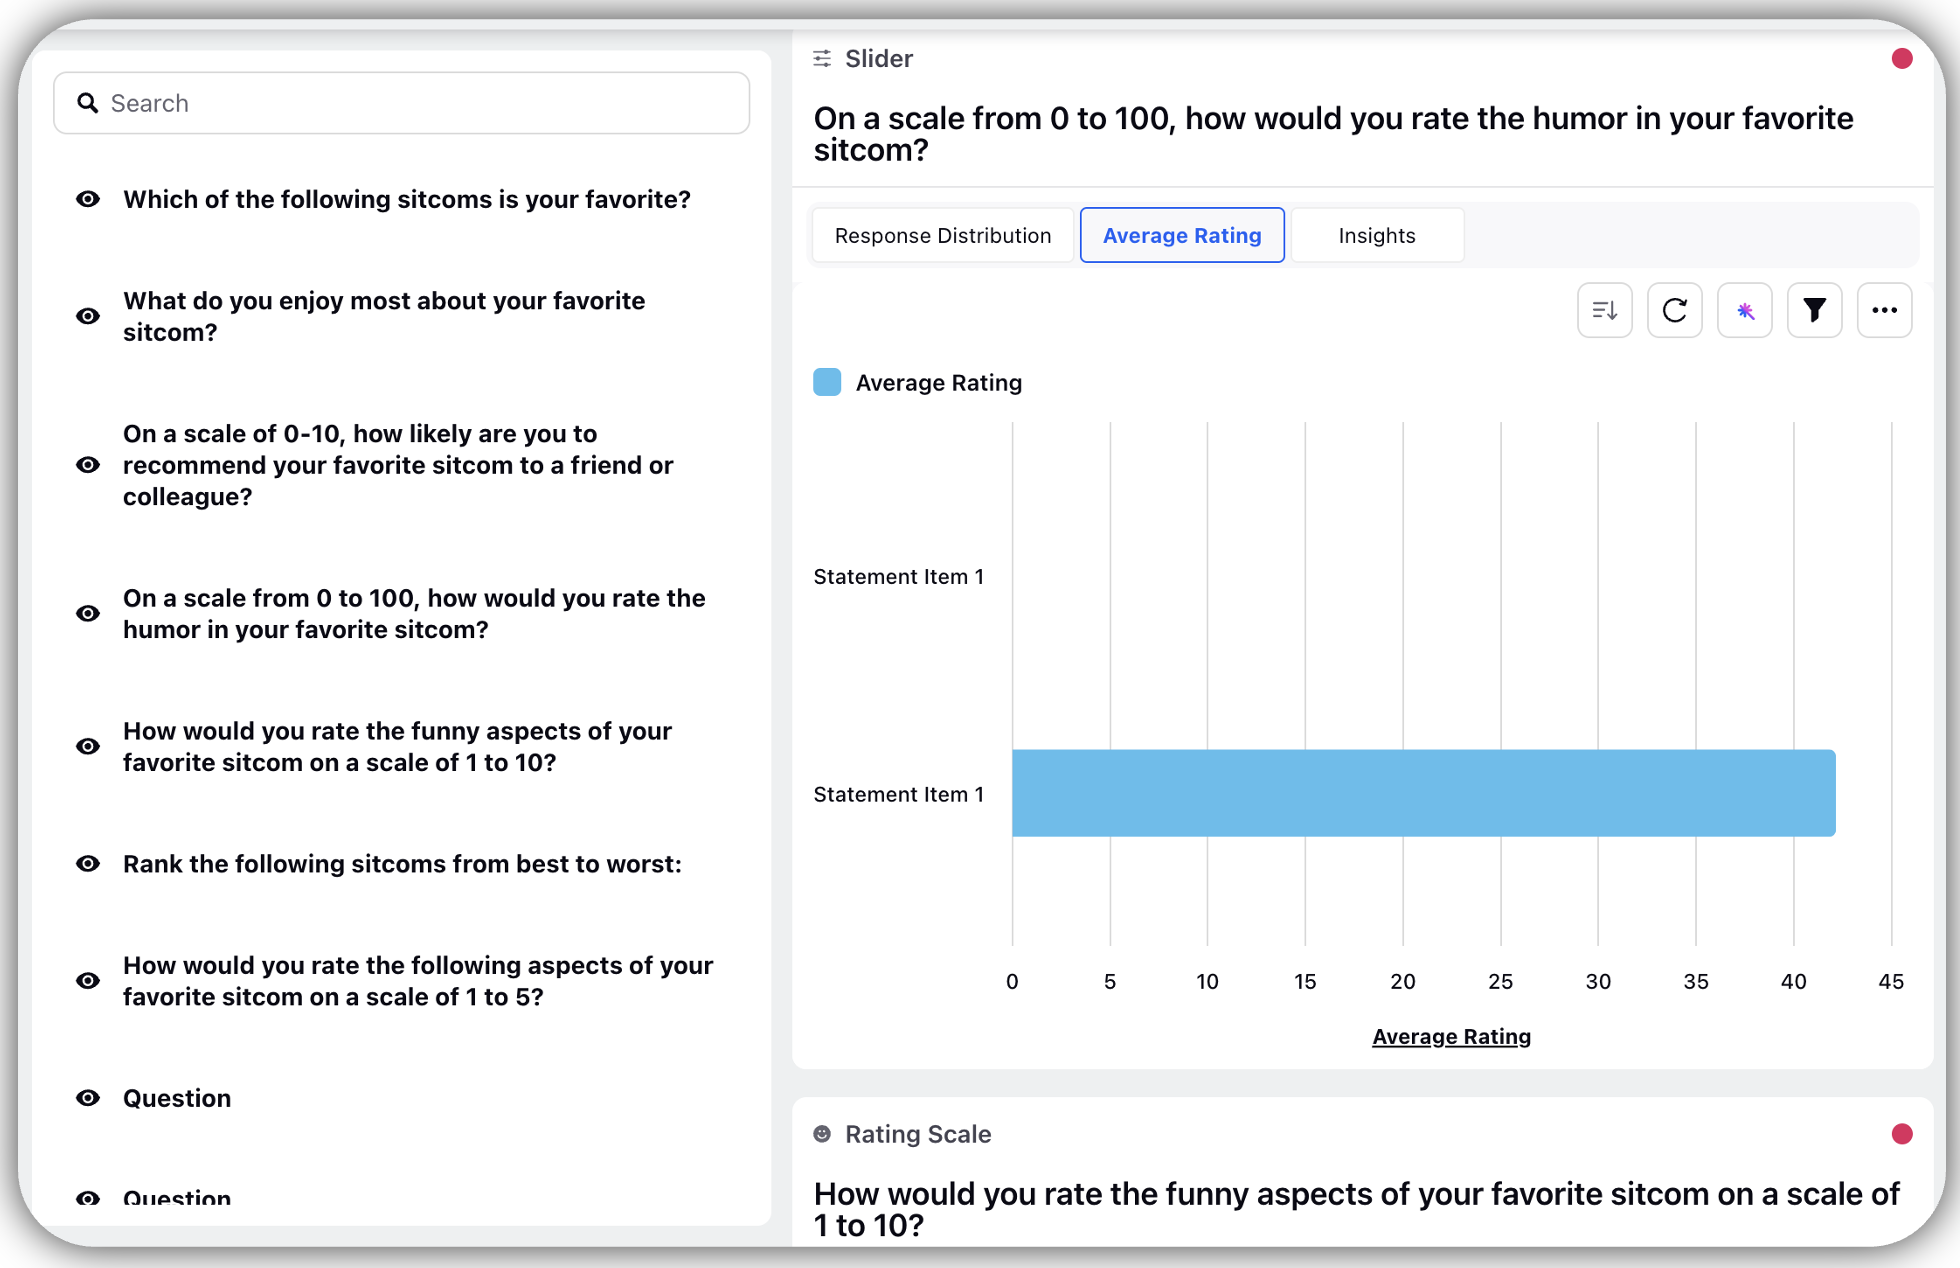
Click Insights to get insights of each response.
Rank Order
Enables you to get results as per the order of preference.
Steps
Click Response Distribution to get the distribution as per the order of preference by each respondent.
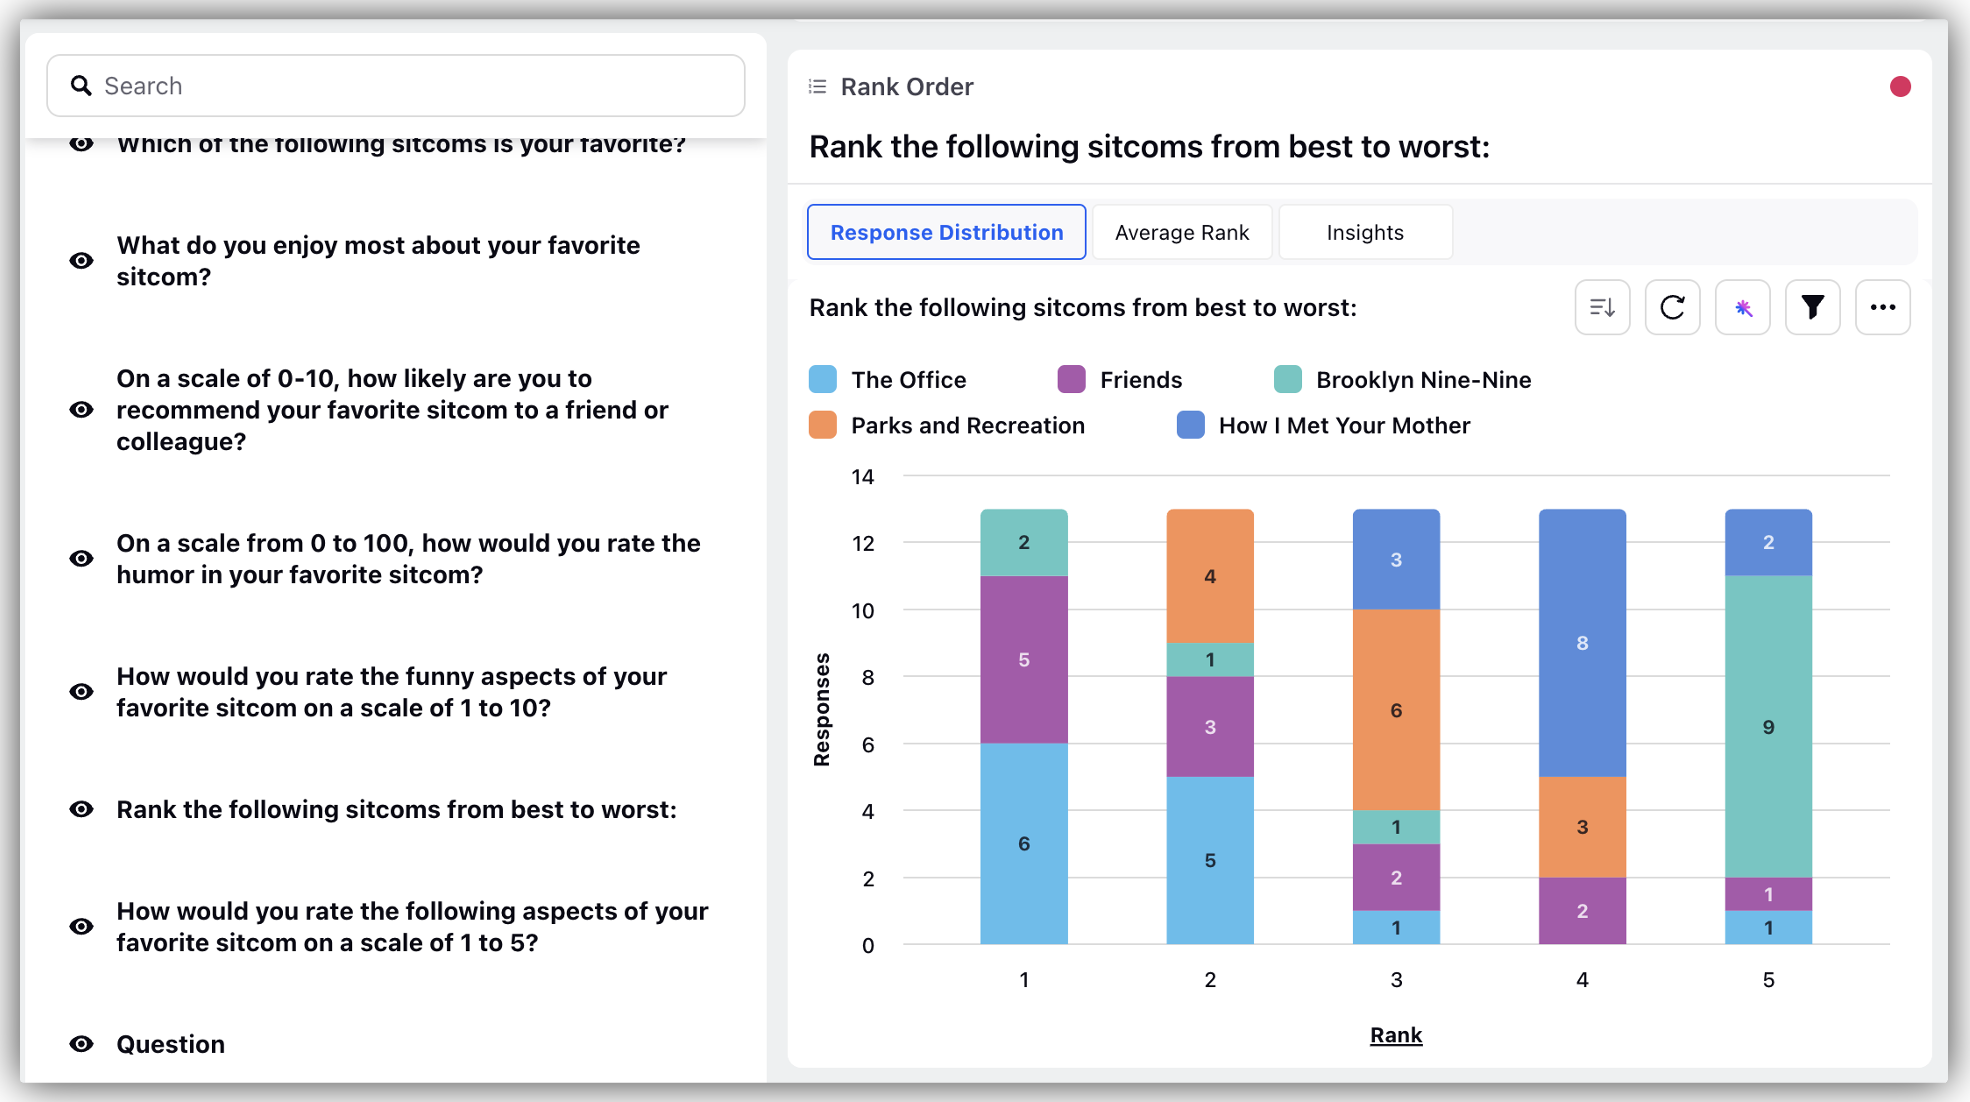
Click Average Rank to get the average score for each option.
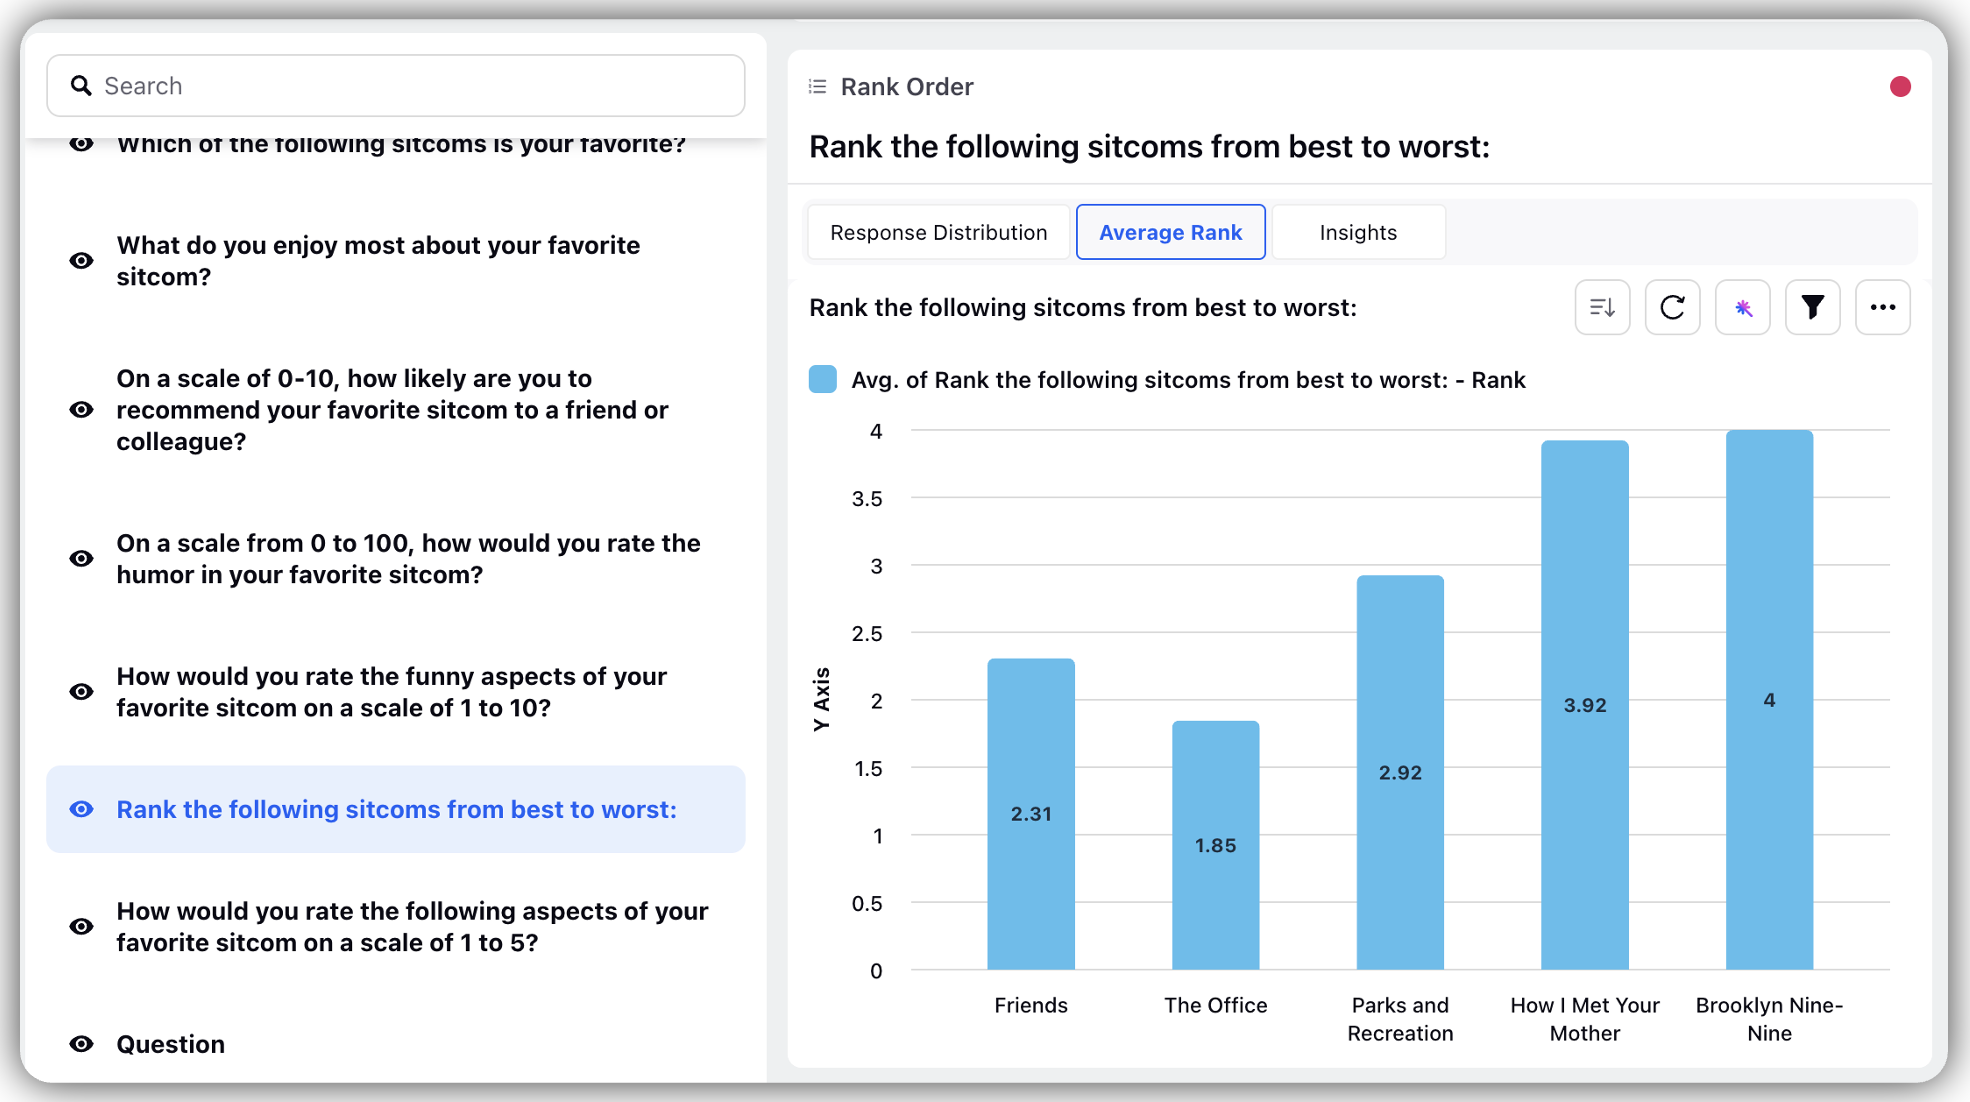
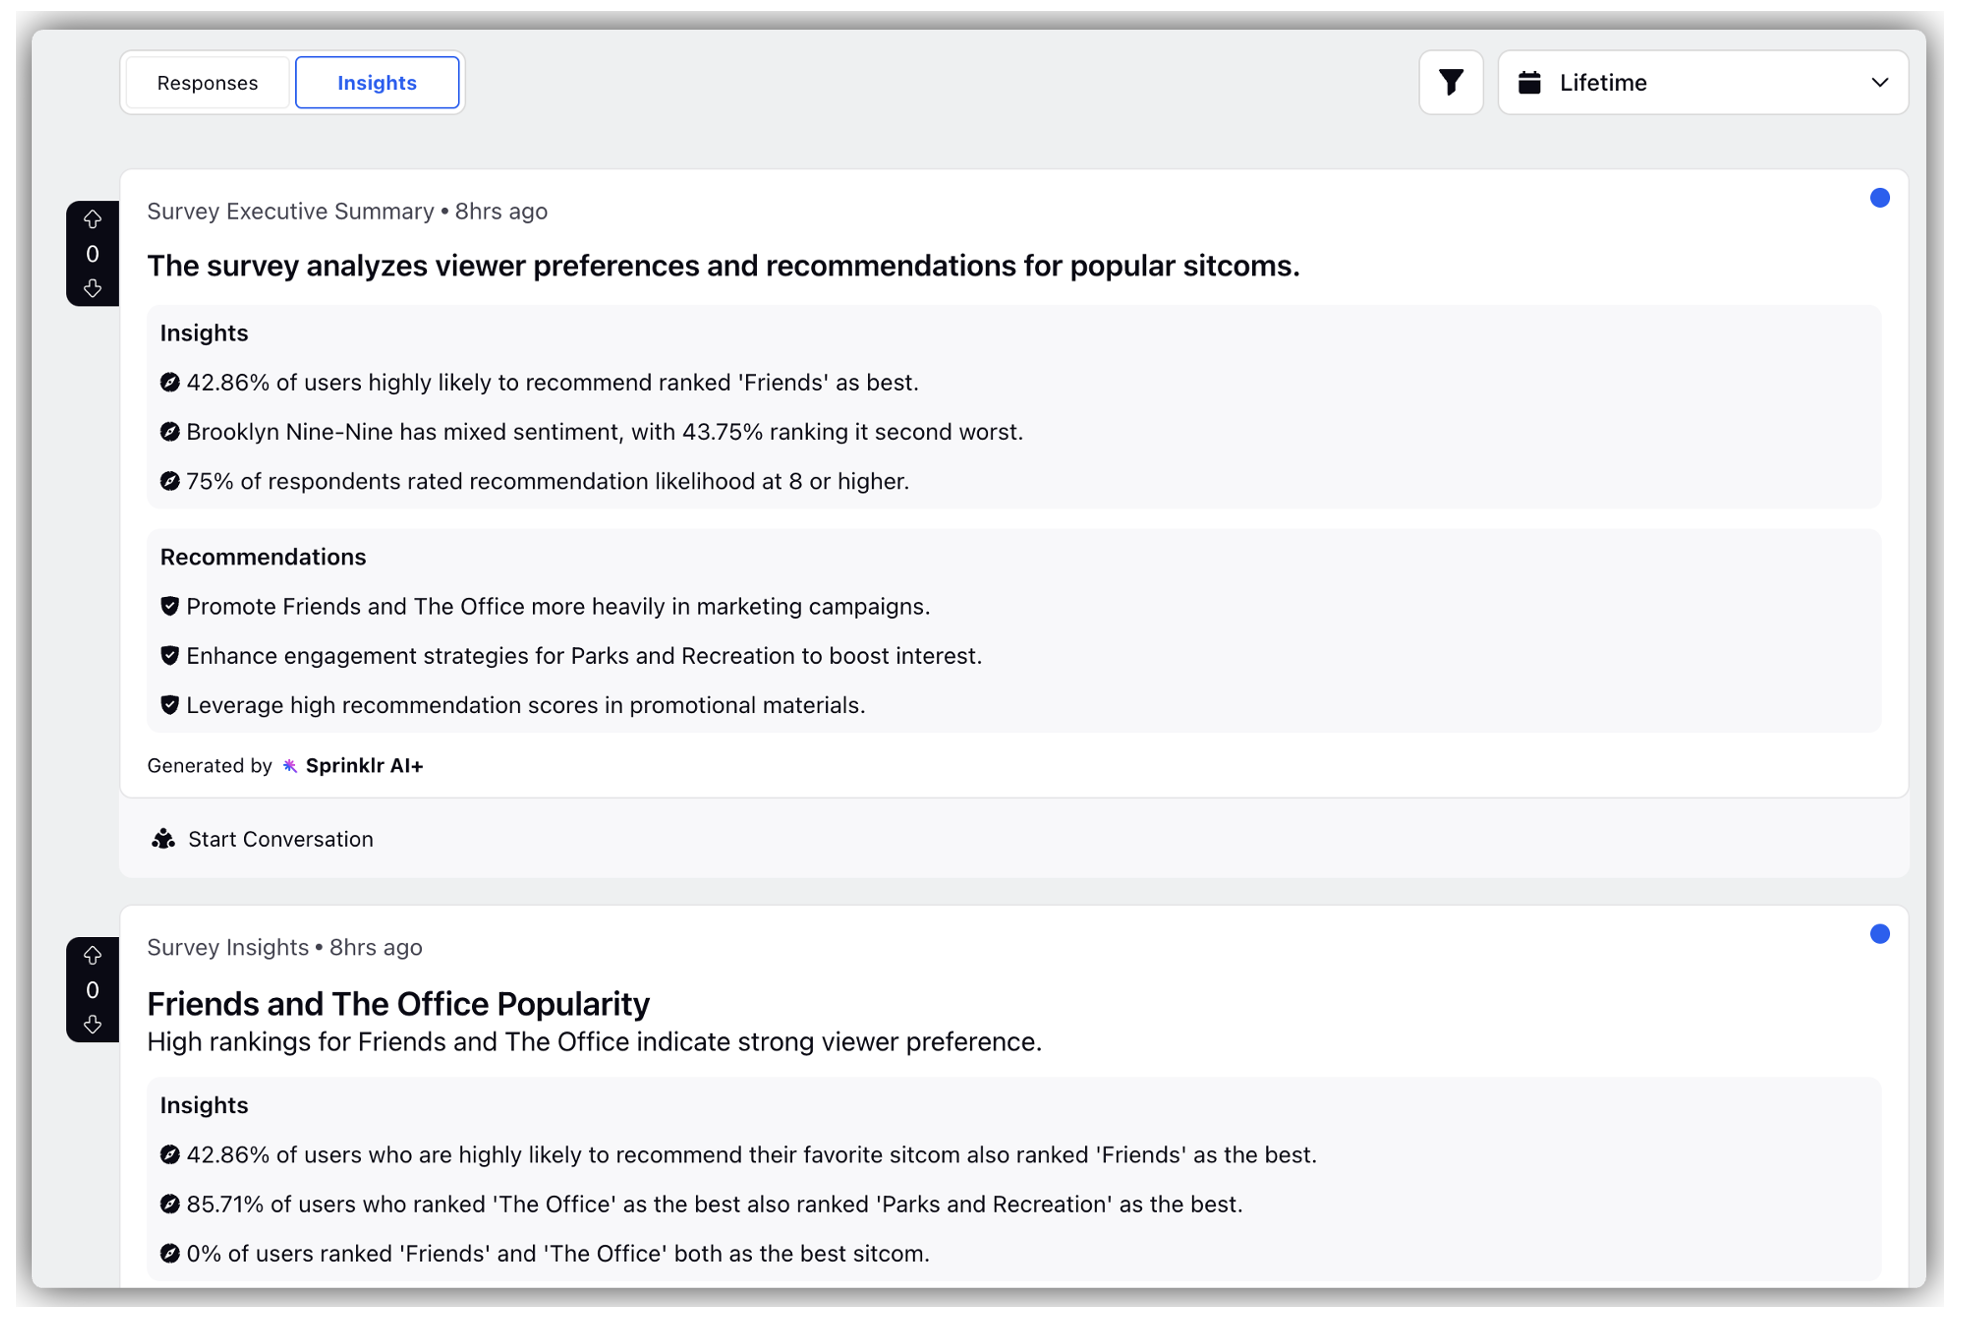
Click Insights to get insights of each response.
Insights
Click Insights to get insights on regression, correlation and analysis easily.
.