Create a Listening dashboard to listen, engage, and respond to conversations
Updated
Learn how to create a Custom Listening Dashboard to tune in to specific conversations — according to your particular needs and requirements.
Listening Dashboards enable you to analyze topic queries via widgets within Standard and Custom dashboards. You can visualize data in the form of charts and graphs in the Listening widgets. You can create the Listening dashboards and customize them by adding widgets and tuning in to specific conversations — allowing you to engage, respond, and take appropriate action.
Enablement note: In order to use this feature, Social Listening should be enabled in your environment. To learn more about Social Listening, please reach out to your Success Manager. |
Before you begin
Prior to creating a Listening Dashboard, you must create Topic(s). Topics are the fundamental units — aiding you to listen within Sprinklr. Therefore, it is essential to create Topics to cater to your listening requirements. For more information on this, visit Listening Topics.
To create a Listening dashboard
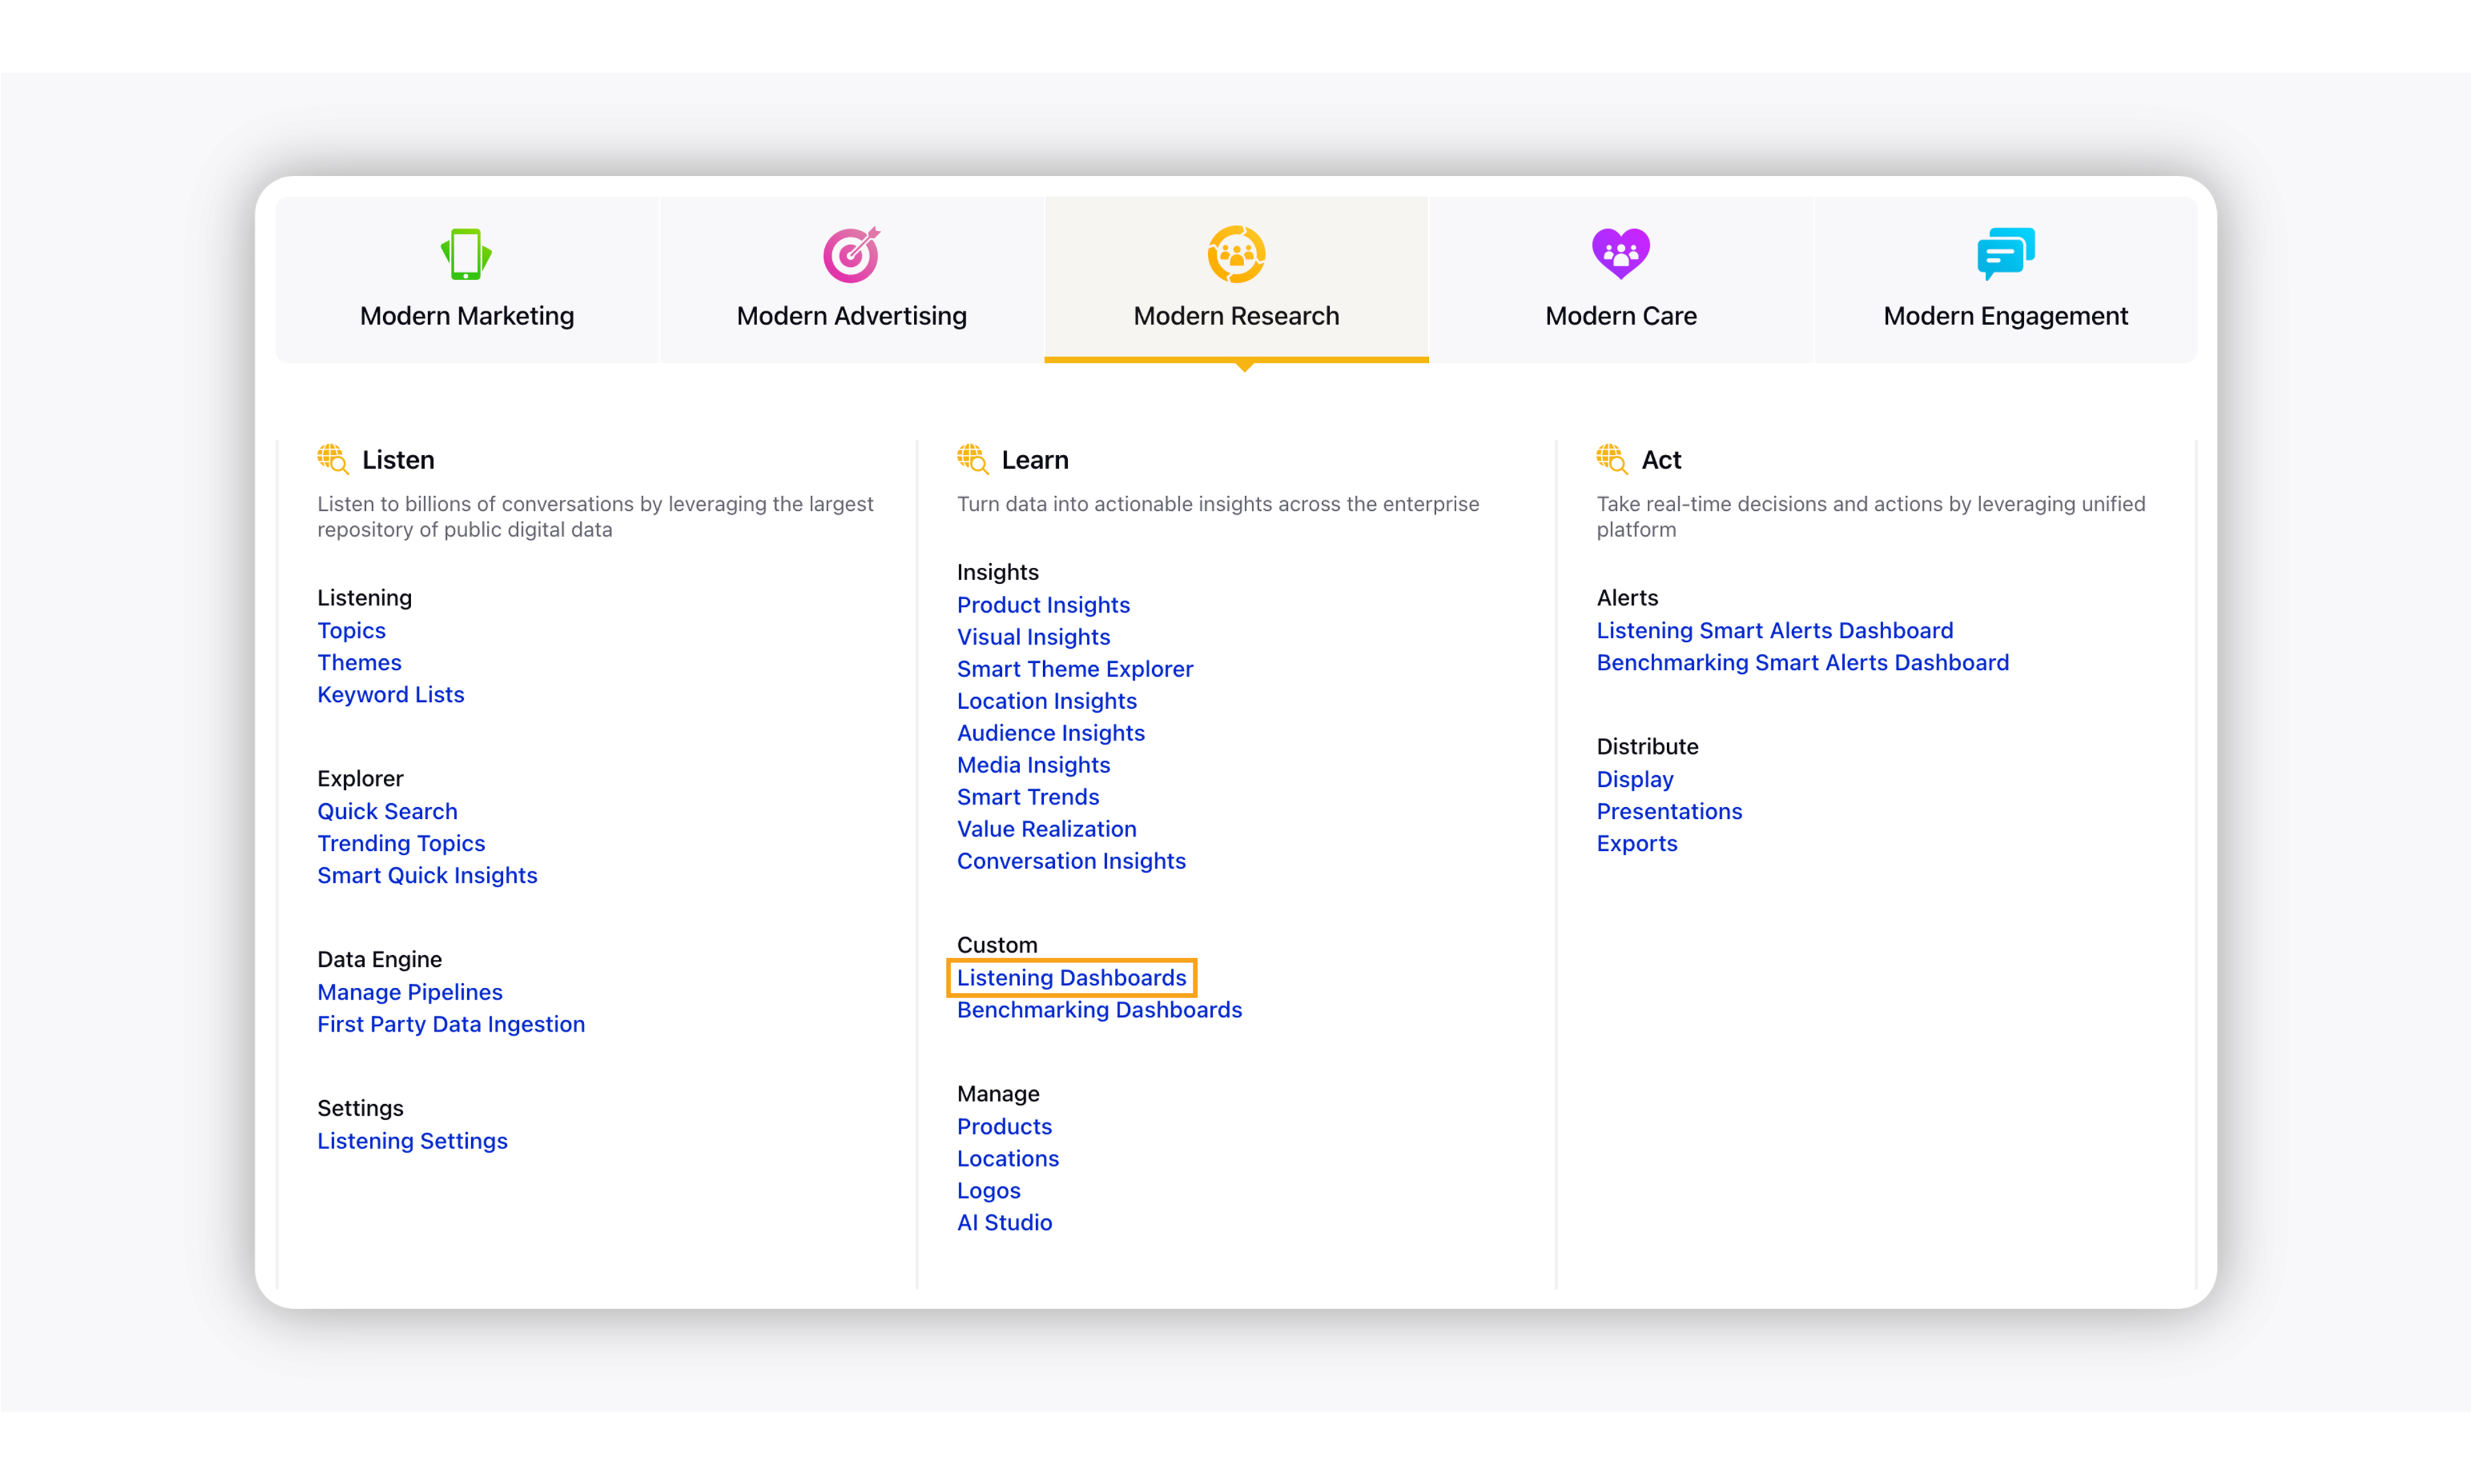
Click the New Tab icon. Under the Sprinklr Insights tab, select Listening Dashboards within Learn.
On Listening Home, click the Create Dashboard button in the top right corner.
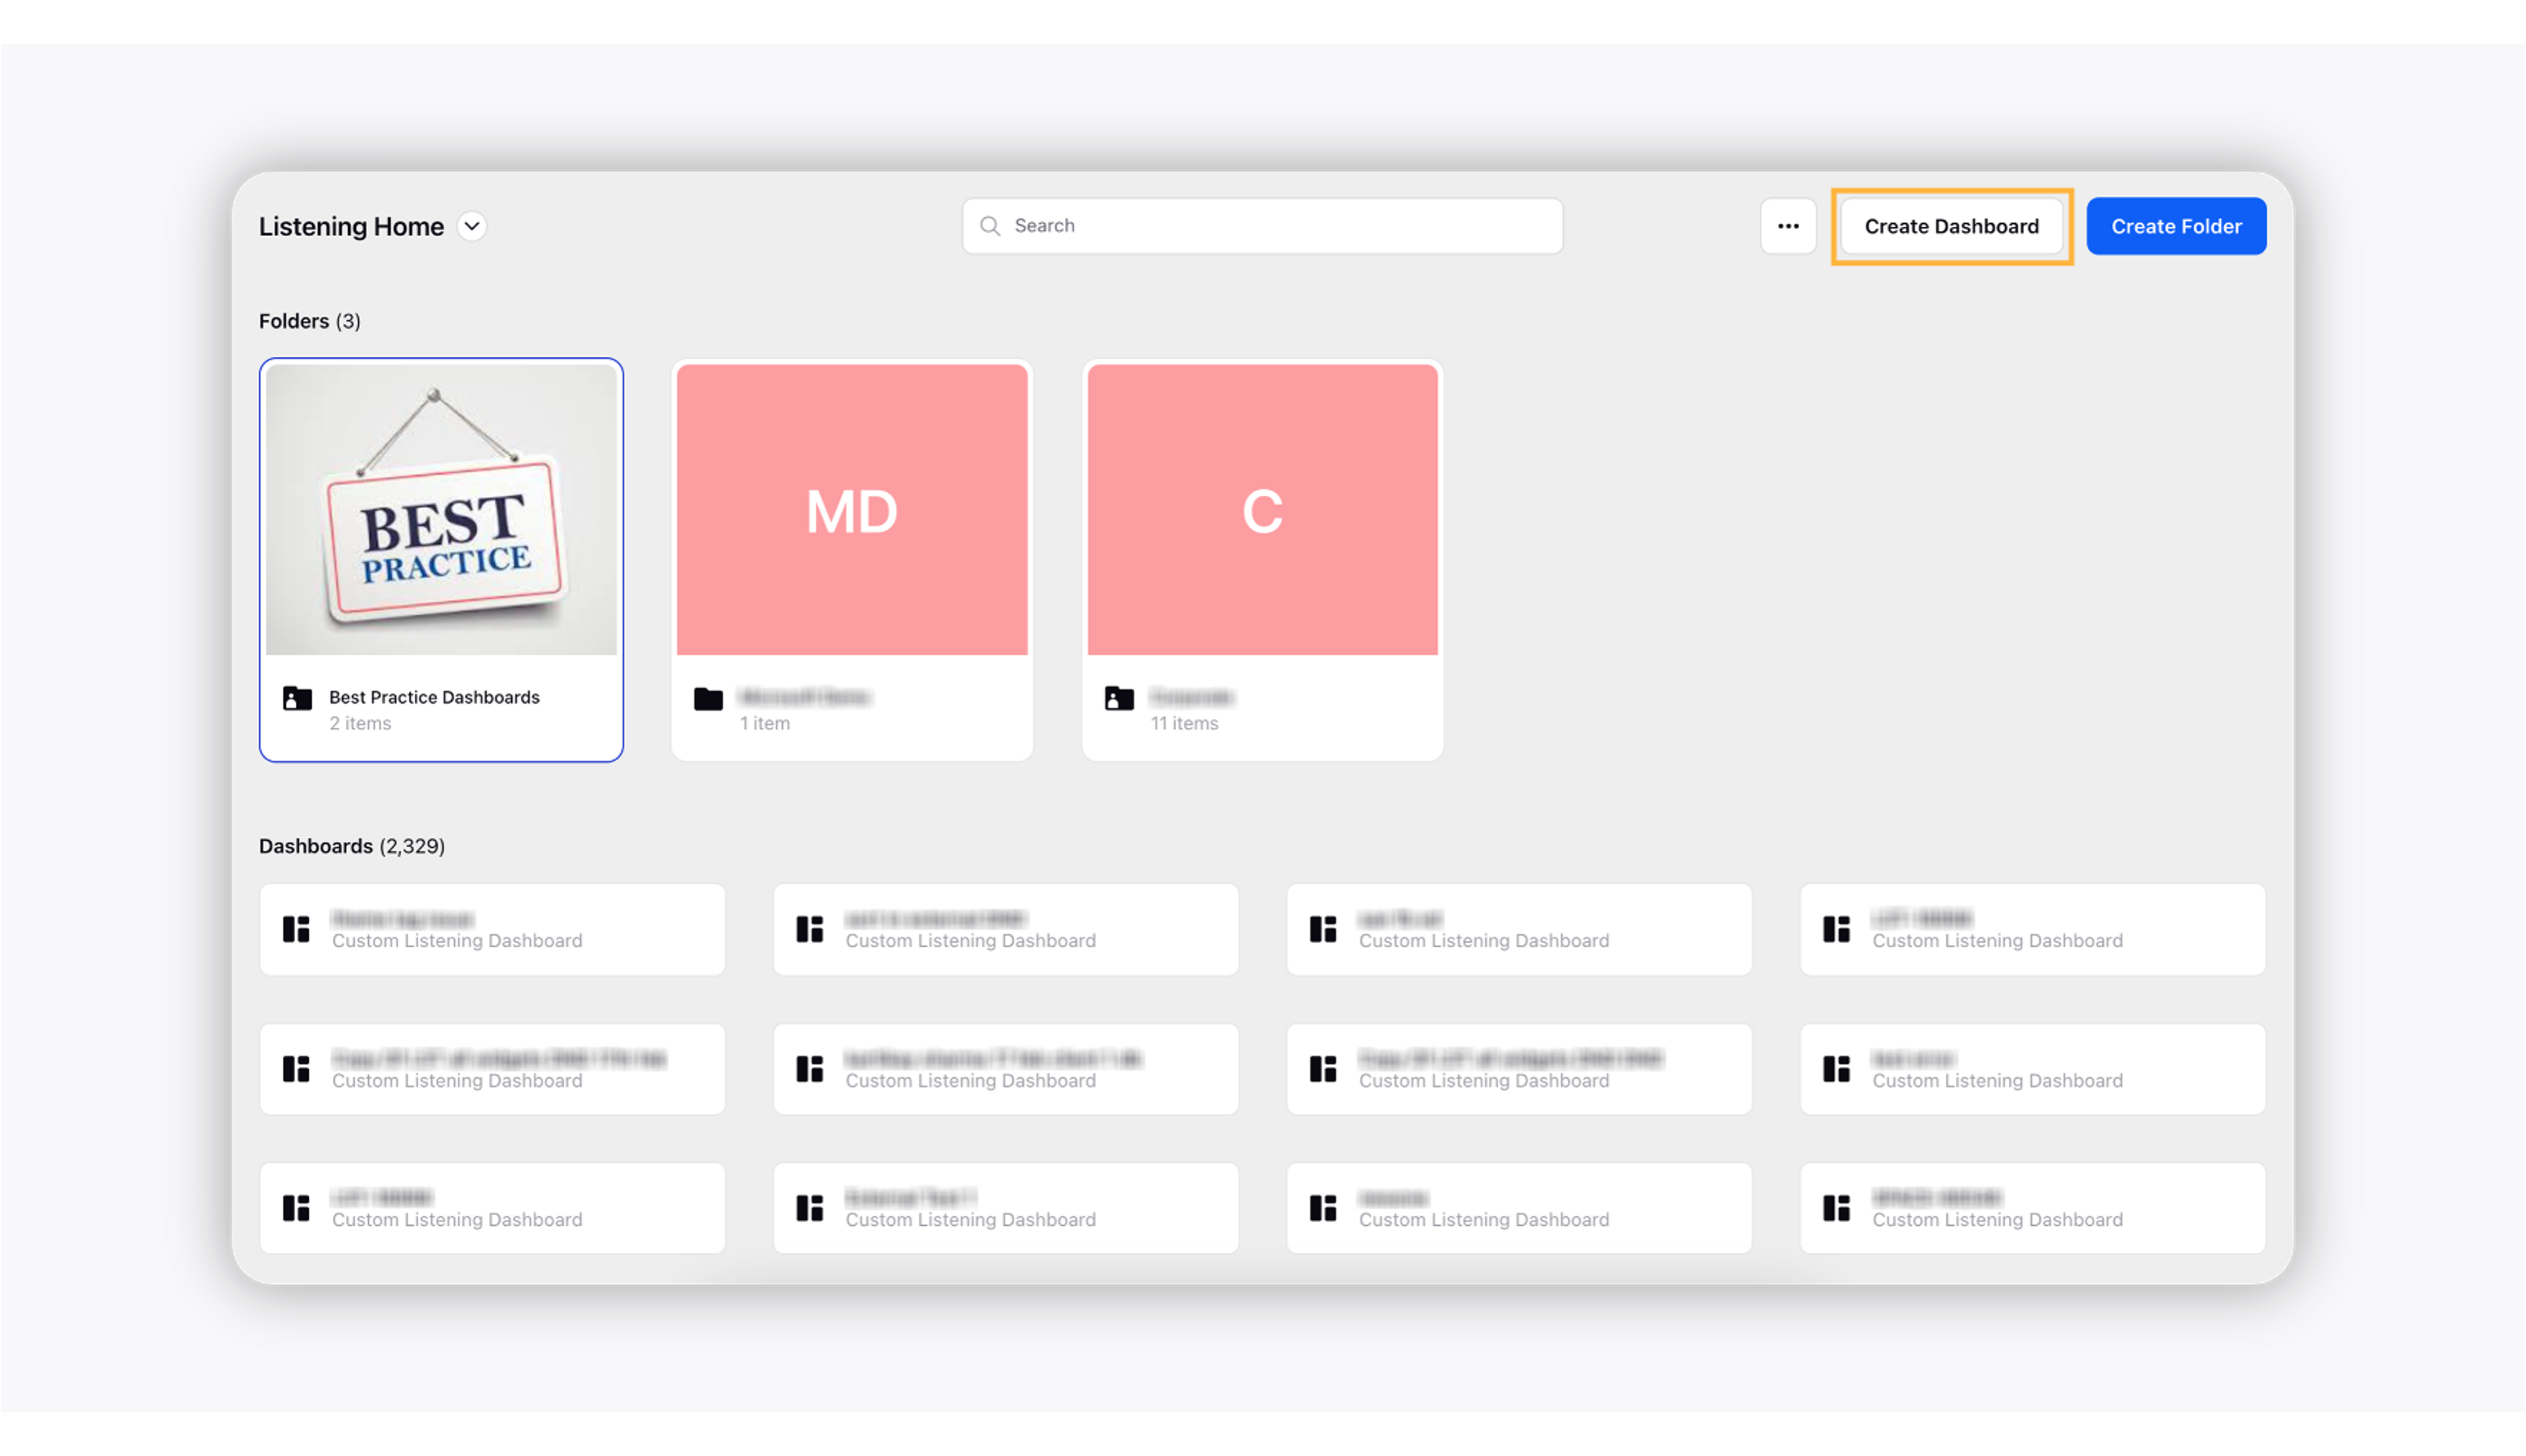
This will open the Add New Dashboard screen from where you can create your own dashboard or choose from the pre-added dashboards available there.
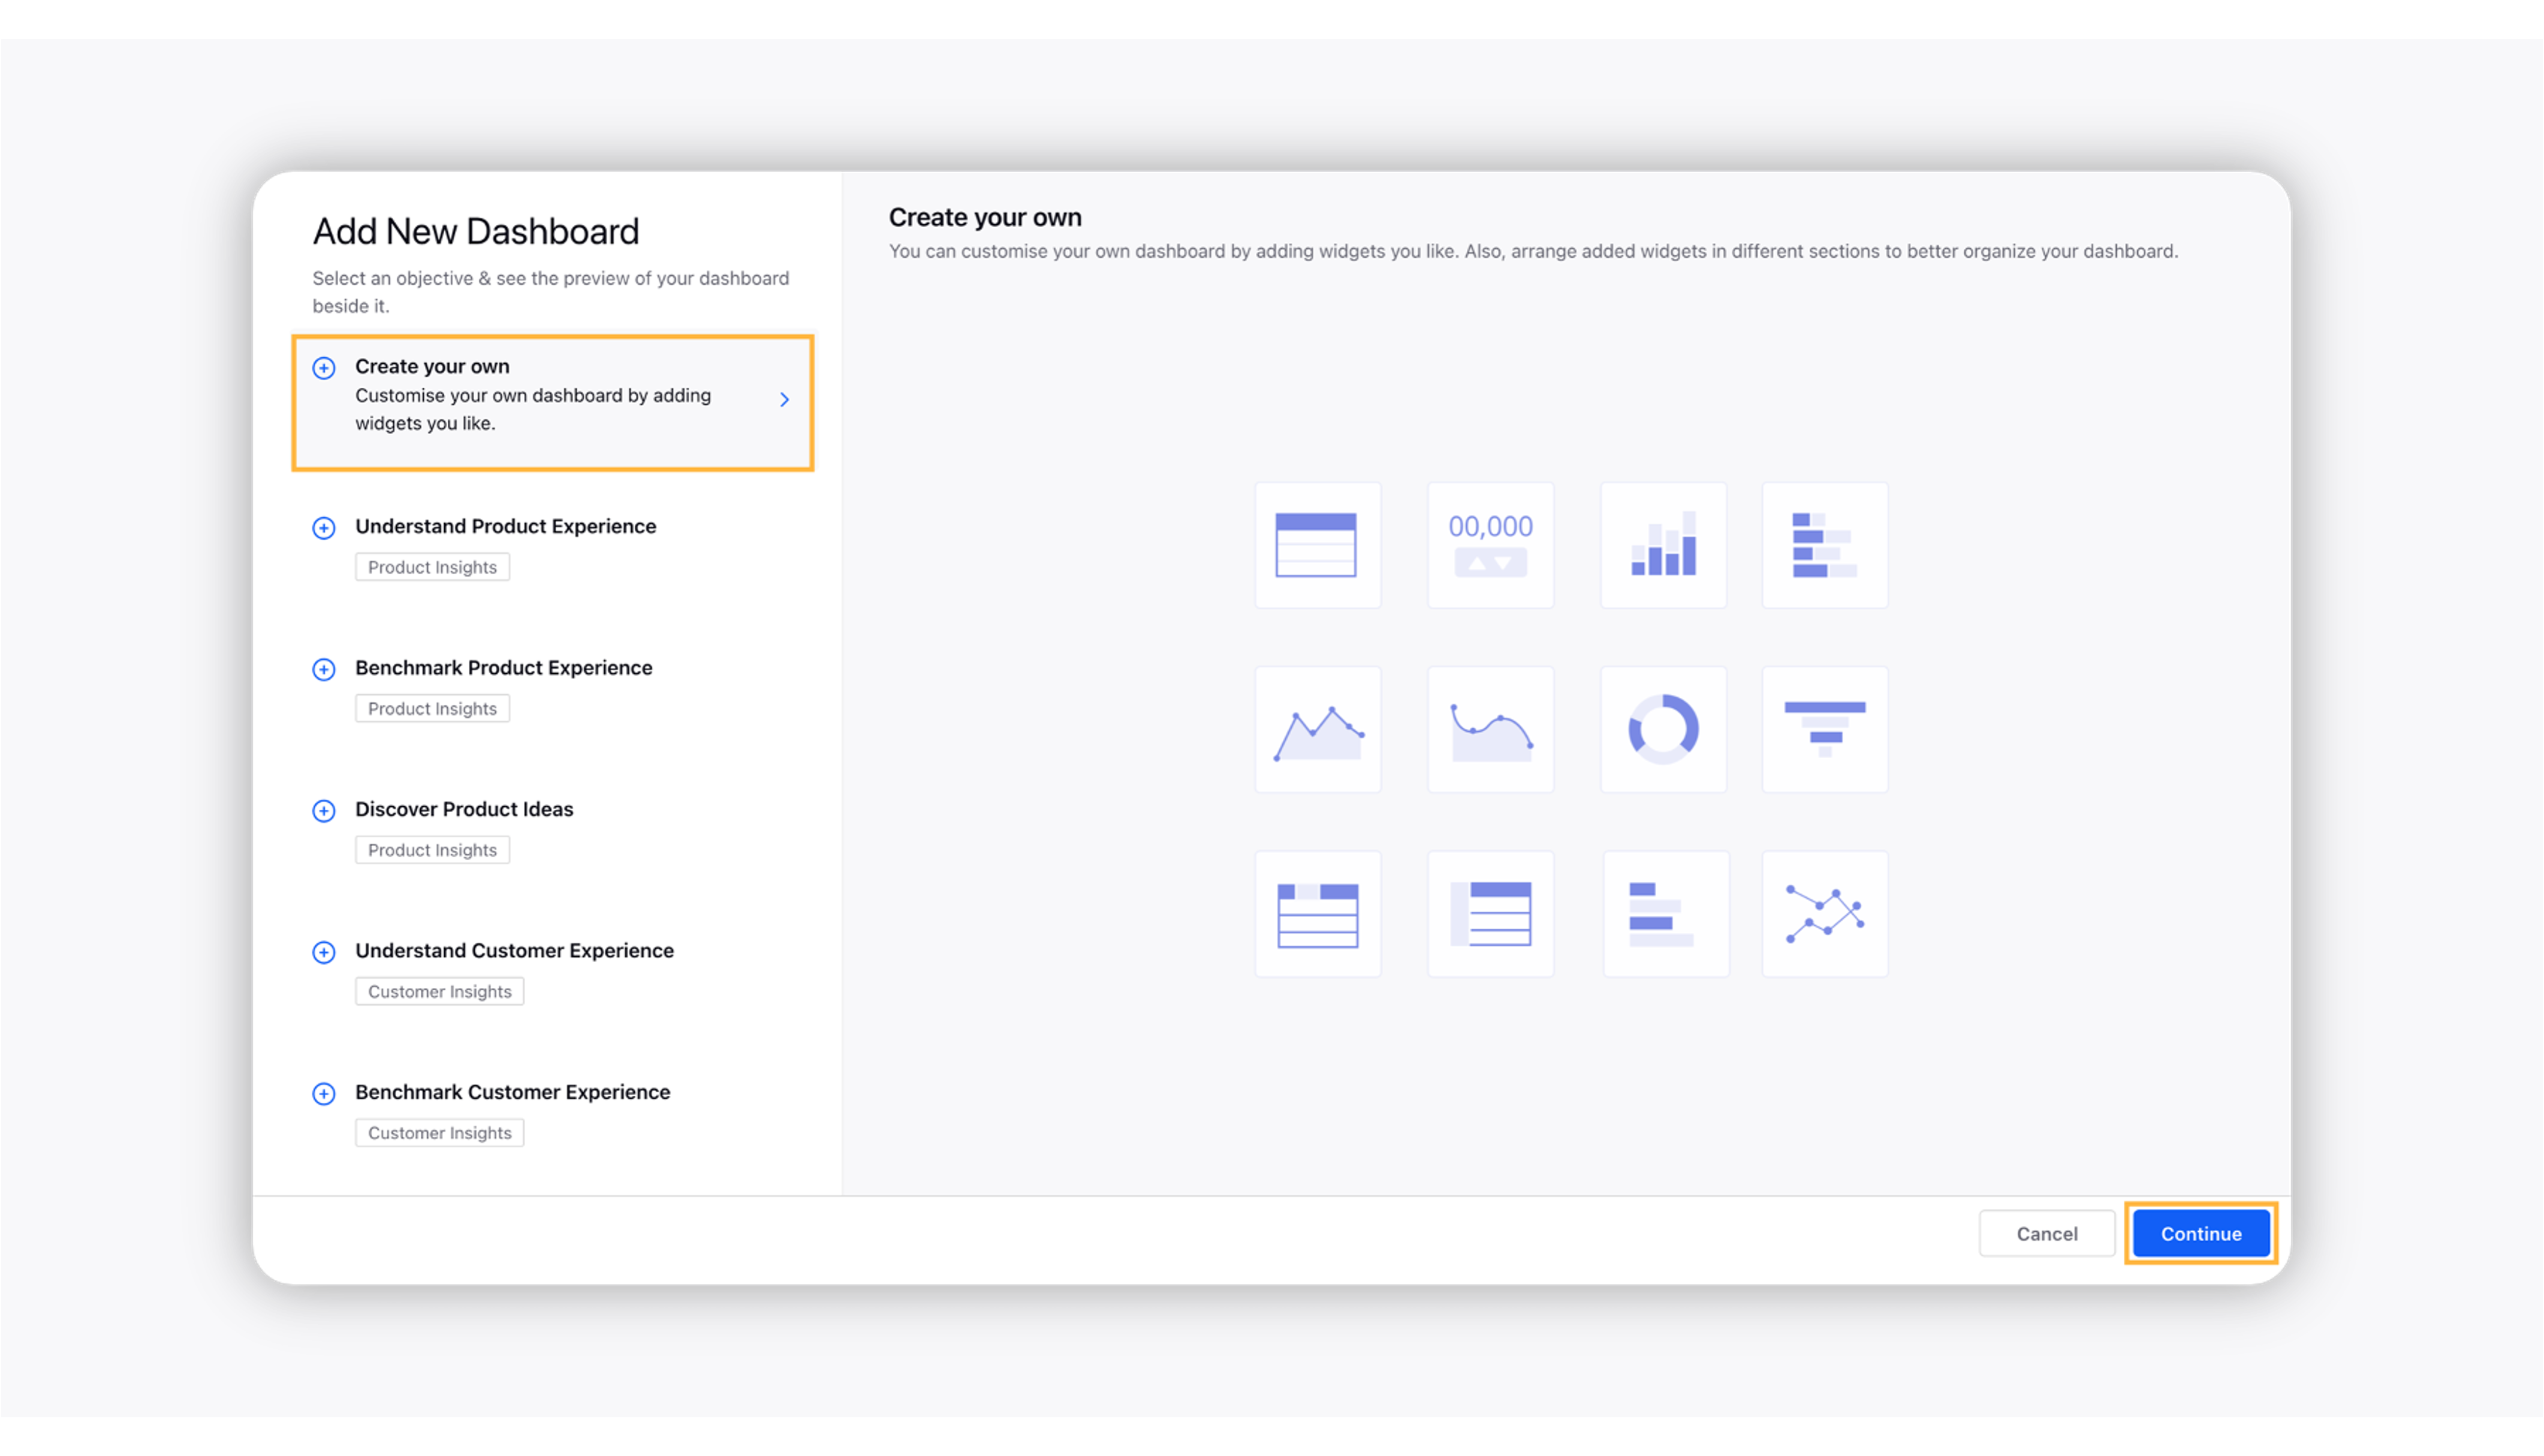
Note:
The "Create your own" option is selected by default, and the chart icons in the center of the screen are a part of the design element, they are not clickable.
Click Continue to go to the Dashboard Creation form where you need to fill in the required fields. For more information, see – Create your Dashboard – Fields & Descriptions.
Click the Create button in the bottom right corner to create the Listening dashboard.
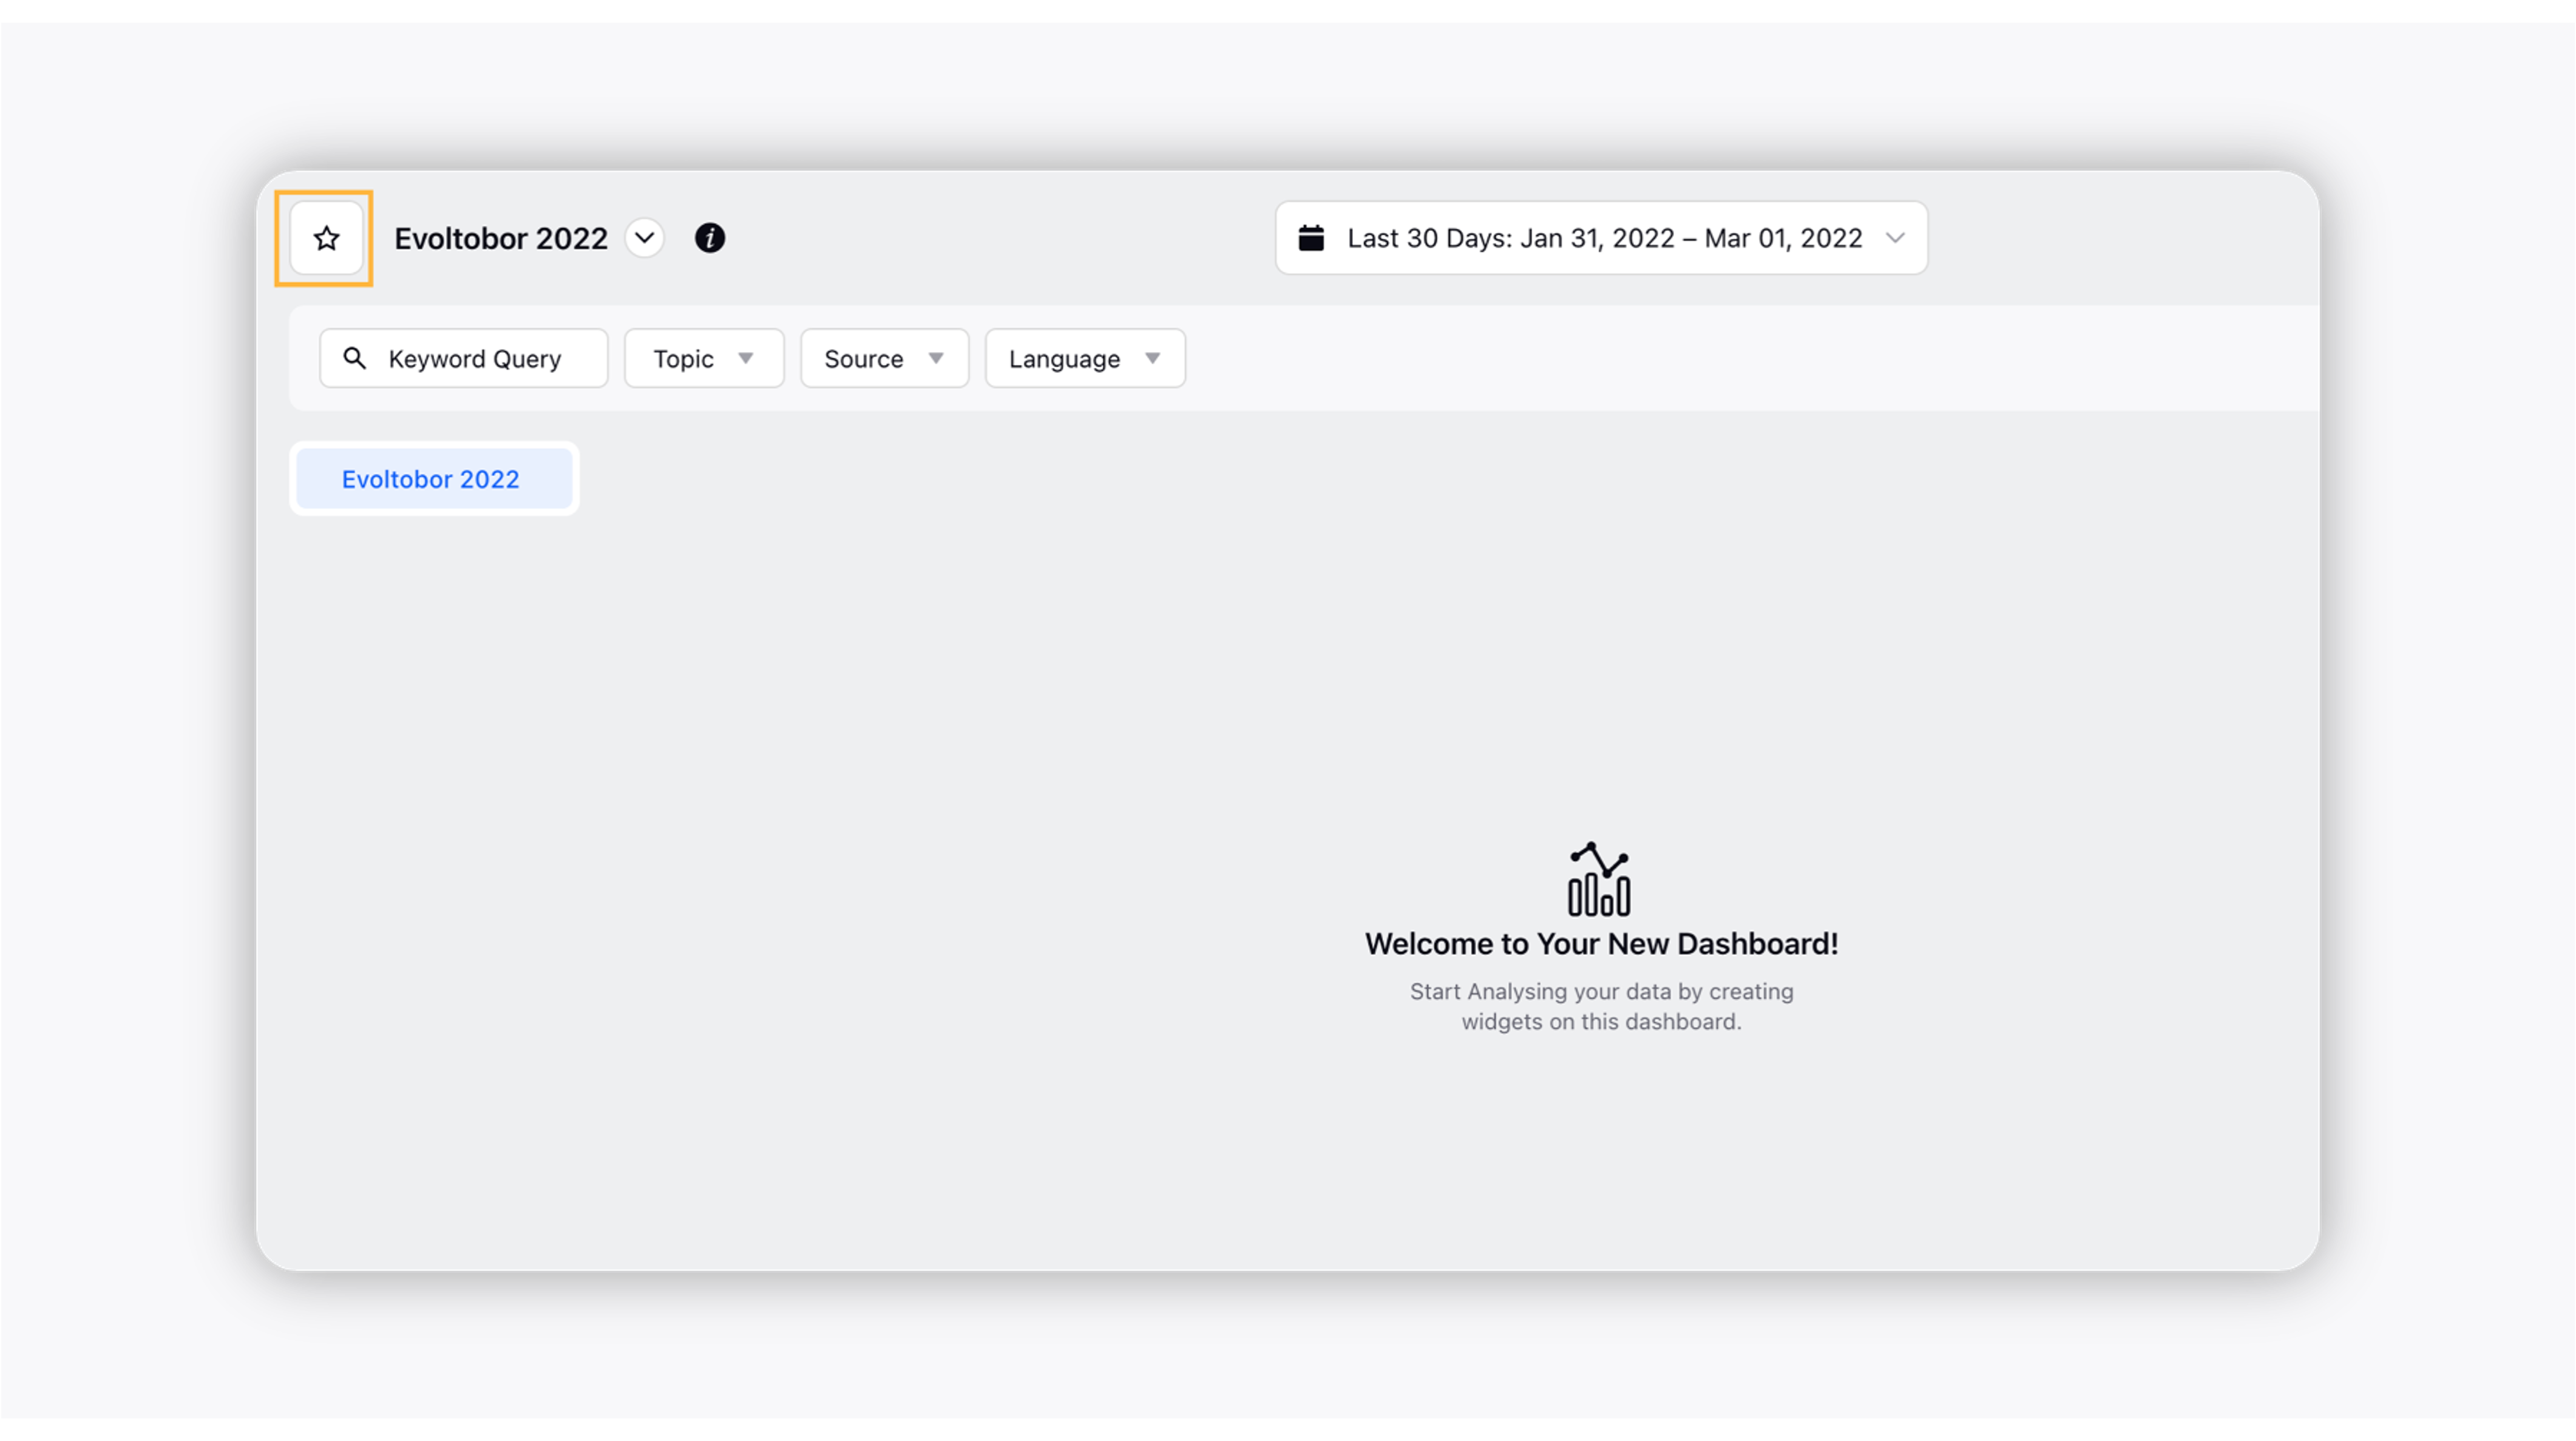
Once the dashboard is successfully created, it will be opened on the screen as a blank dashboard. You have to add widgets to it to view data. Refer to this article for more information – Create Listening Dashboard Widget to Visualize Data in Real-time.
Click the Star icon next to the created dashboard to mark it as your Favorite Dashboard.
Once the Listening dashboard is successfully created, it will be listed in Listening Home. To view the created dashboard, you can simply go to Listening Home, and search for the dashboard by entering its name in the search bar.
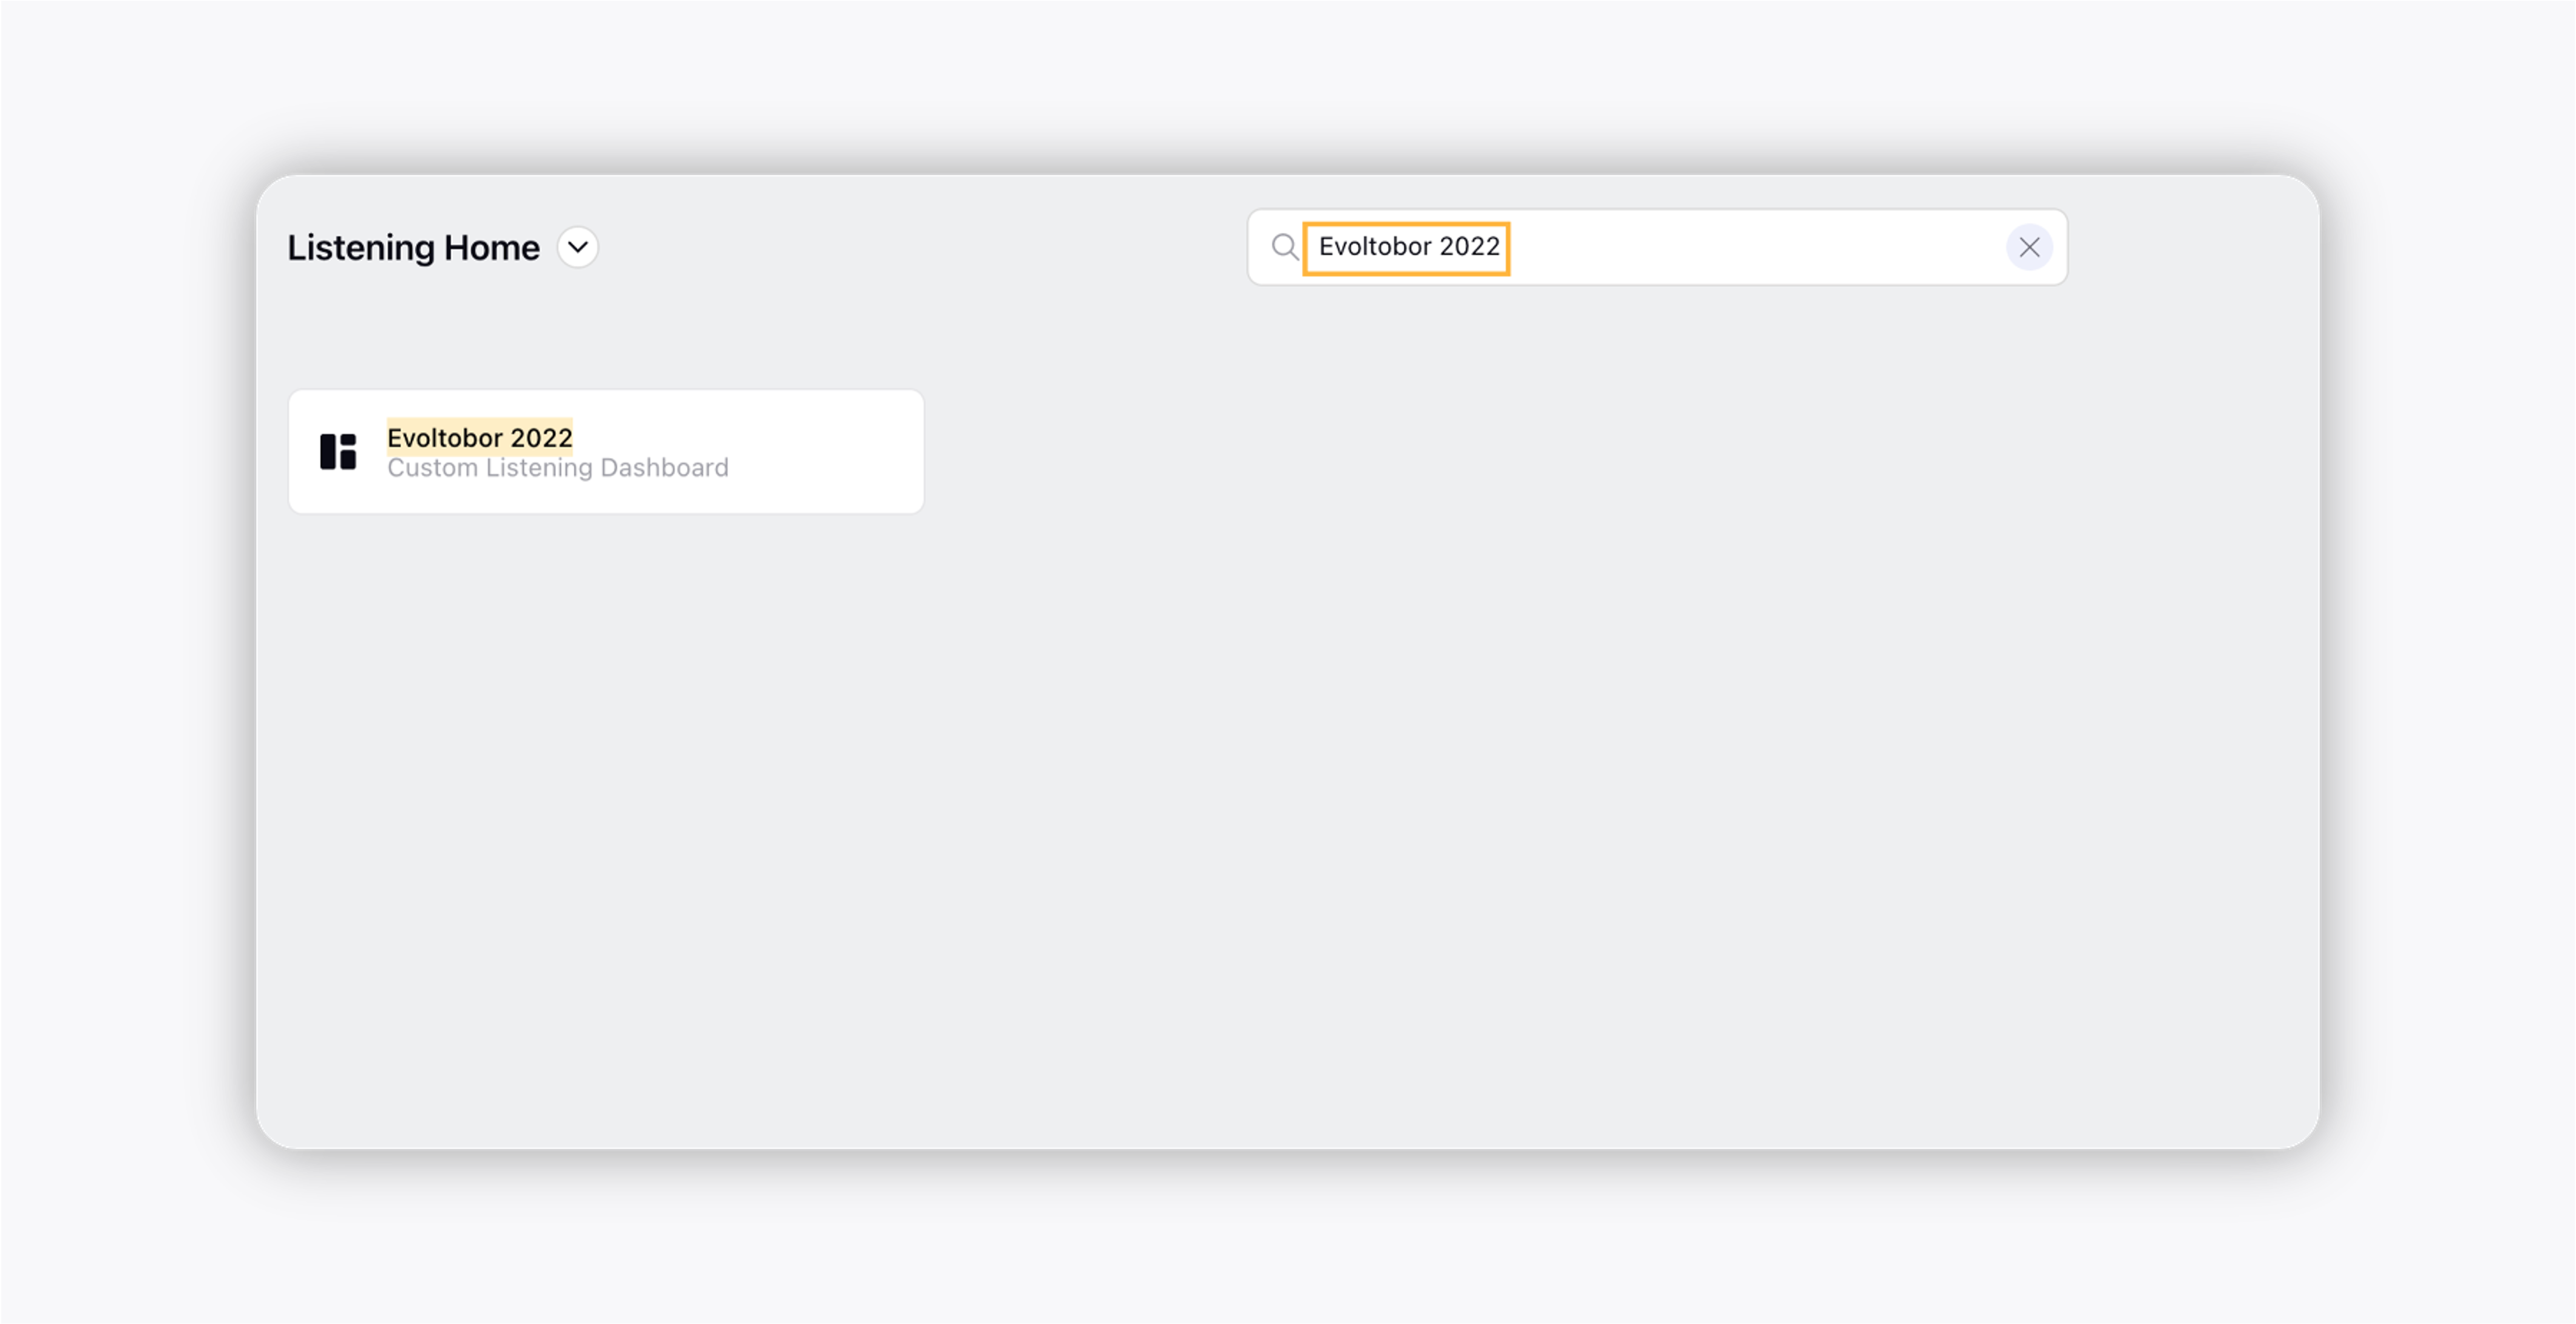
You can also find your dashboard in the dropdown section of Listening Home. All the dashboards you have created are listed under the My Dashboard section.

Create your Dashboard – Fields & Descriptions
Field | Description |
Name Your Dashboard | Enter the name of your dashboard. |
Folder | Select the folder to which you want to align your dashboard. |
Use Tags to Group Similar Dashboards | Enter the tags to group similar Listening dashboards. If no tags are available, you can create new tags. |
Do You Wish to Auto Refresh the Dashboard? |
|
Share this dashboard with | Select the users or user groups with whom you want to share your Listening dashboard. |
Schedule Report for Other Users | Using this feature will help you send the scheduled report via email to both internal and external users.
|
Difference between standard and custom dashboards
There are two types of Listening dashboards available for users – Standard Dashboards and Custom Dashboards. Although both the dashboard types serve the same purpose, i.e. helping you gain actionable insights through AI-driven analytics, there is a major difference between these two dashboard types. A standard Listening dashboard comes as a pre-built dashboard that will have a number of pre-added widgets. You cannot add a widget to the standard dashboard.
On the other hand, the custom Listening dashboard, as the name suggests, is a custom dashboard created by users. Unlike a standard dashboard, a customer dashboard does not have pre-added widgets so users have to add widgets manually, depending on their requirements. The rest of the features and functionalities remain the same in both dashboards.
Dashboard concurrency handling
On normal usage with dashboards, there are instances when the dashboard becomes outdated for a user under the following conditions:
When multiple users are working on the same dashboard
Connection issues while working on a dashboard
When a user makes new changes to an outdated version of the dashboard, they are not saved – leading to loss of work.
The Dashboard Concurrency Handling functionality will increase transparency and avoid the loss of unsaved changes. As soon as a new version of the Listening dashboard is available, users will be notified through a red warning message prompting them to refresh the dashboard for the latest changes to be synced.
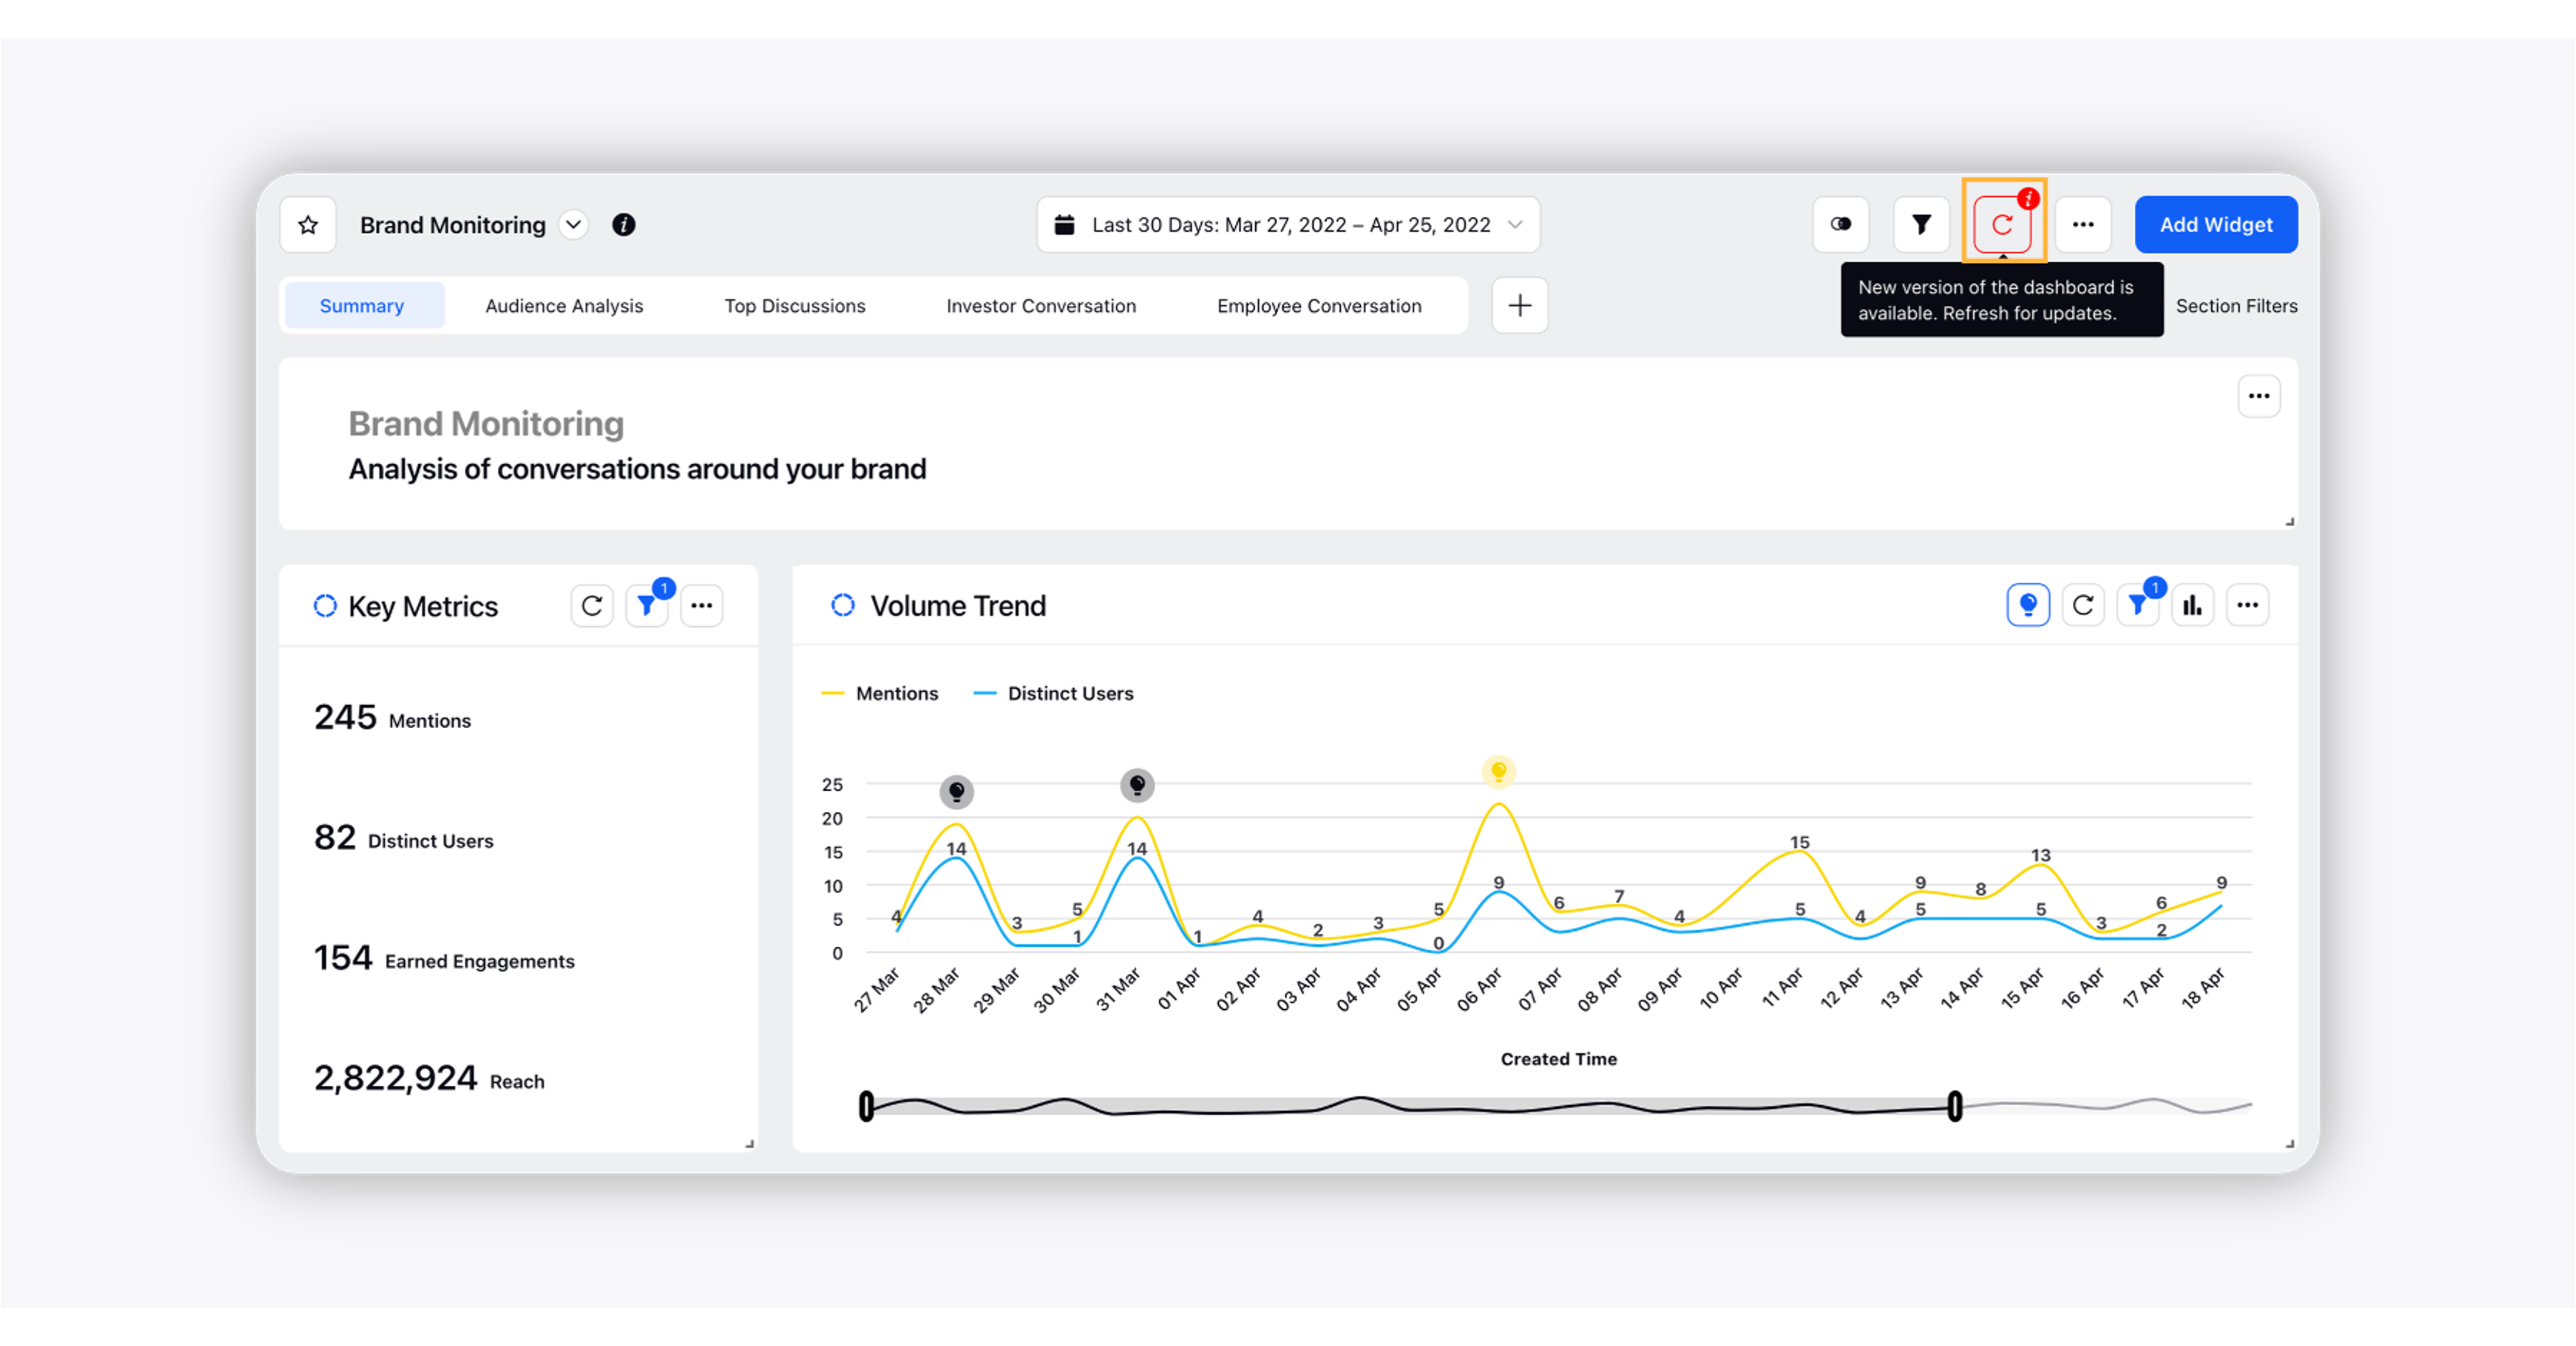
The main purpose of introducing this change is to let multiple users work on a dashboard concurrently without affecting their user experience. This capability will be supported in Listening, Benchmarking, and other reporting dashboards.