Create Listening dashboard widgets to visualize data in real-time
Updated
Learn how to create Listening Dashboard Widgets in Sprinklr Insights to visualize data for multiple metrics in real-time.
Listening Dashboard Widgets are customizable widgets that you can add to a Listening Dashboard to visualize data. They allow you to engage with relevant data sets and help you listen, learn, and act on critical developments in real-time. At a time, you can add single or multiple widgets to a Listening dashboard.
The primary purpose of adding a widget on a Listening dashboard is to visualize data insightfully. You can translate large data sets and metrics into graphs, charts, and other visuals by adding customizable widgets. As a result, the visual representation of data makes it easier to identify and share real-time trends, outliers, and new insights about the information represented in the widget.
To create a Listening widget
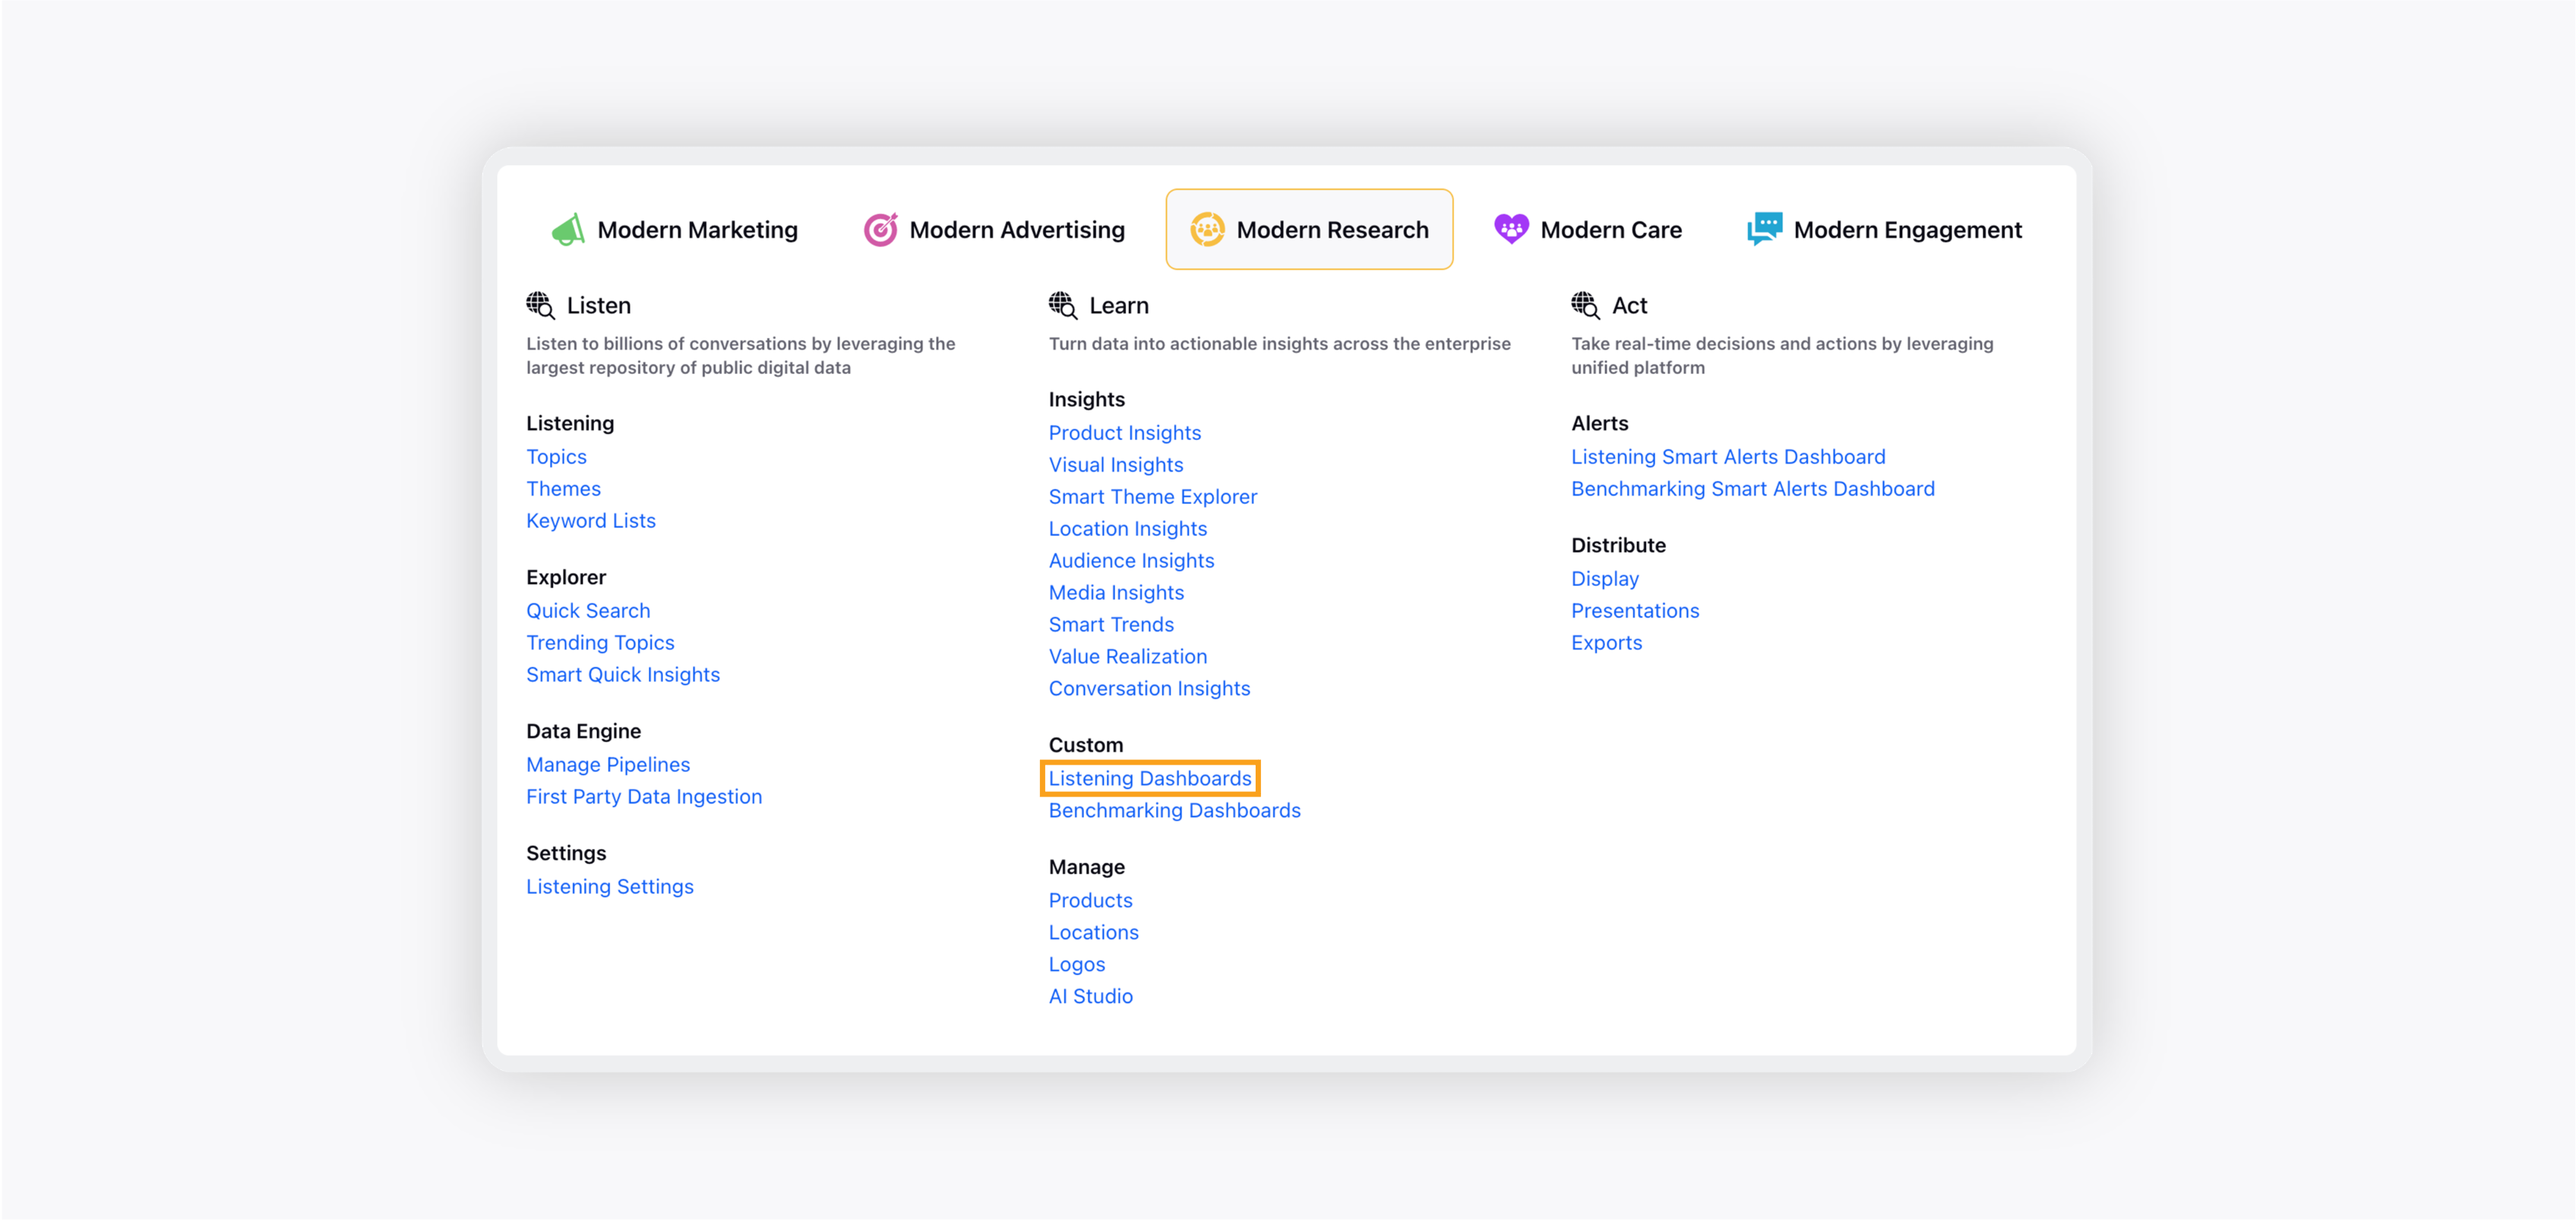
Click the New Tab icon. Under the Sprinklr Insights tab, click Listening Dashboards within Learn.
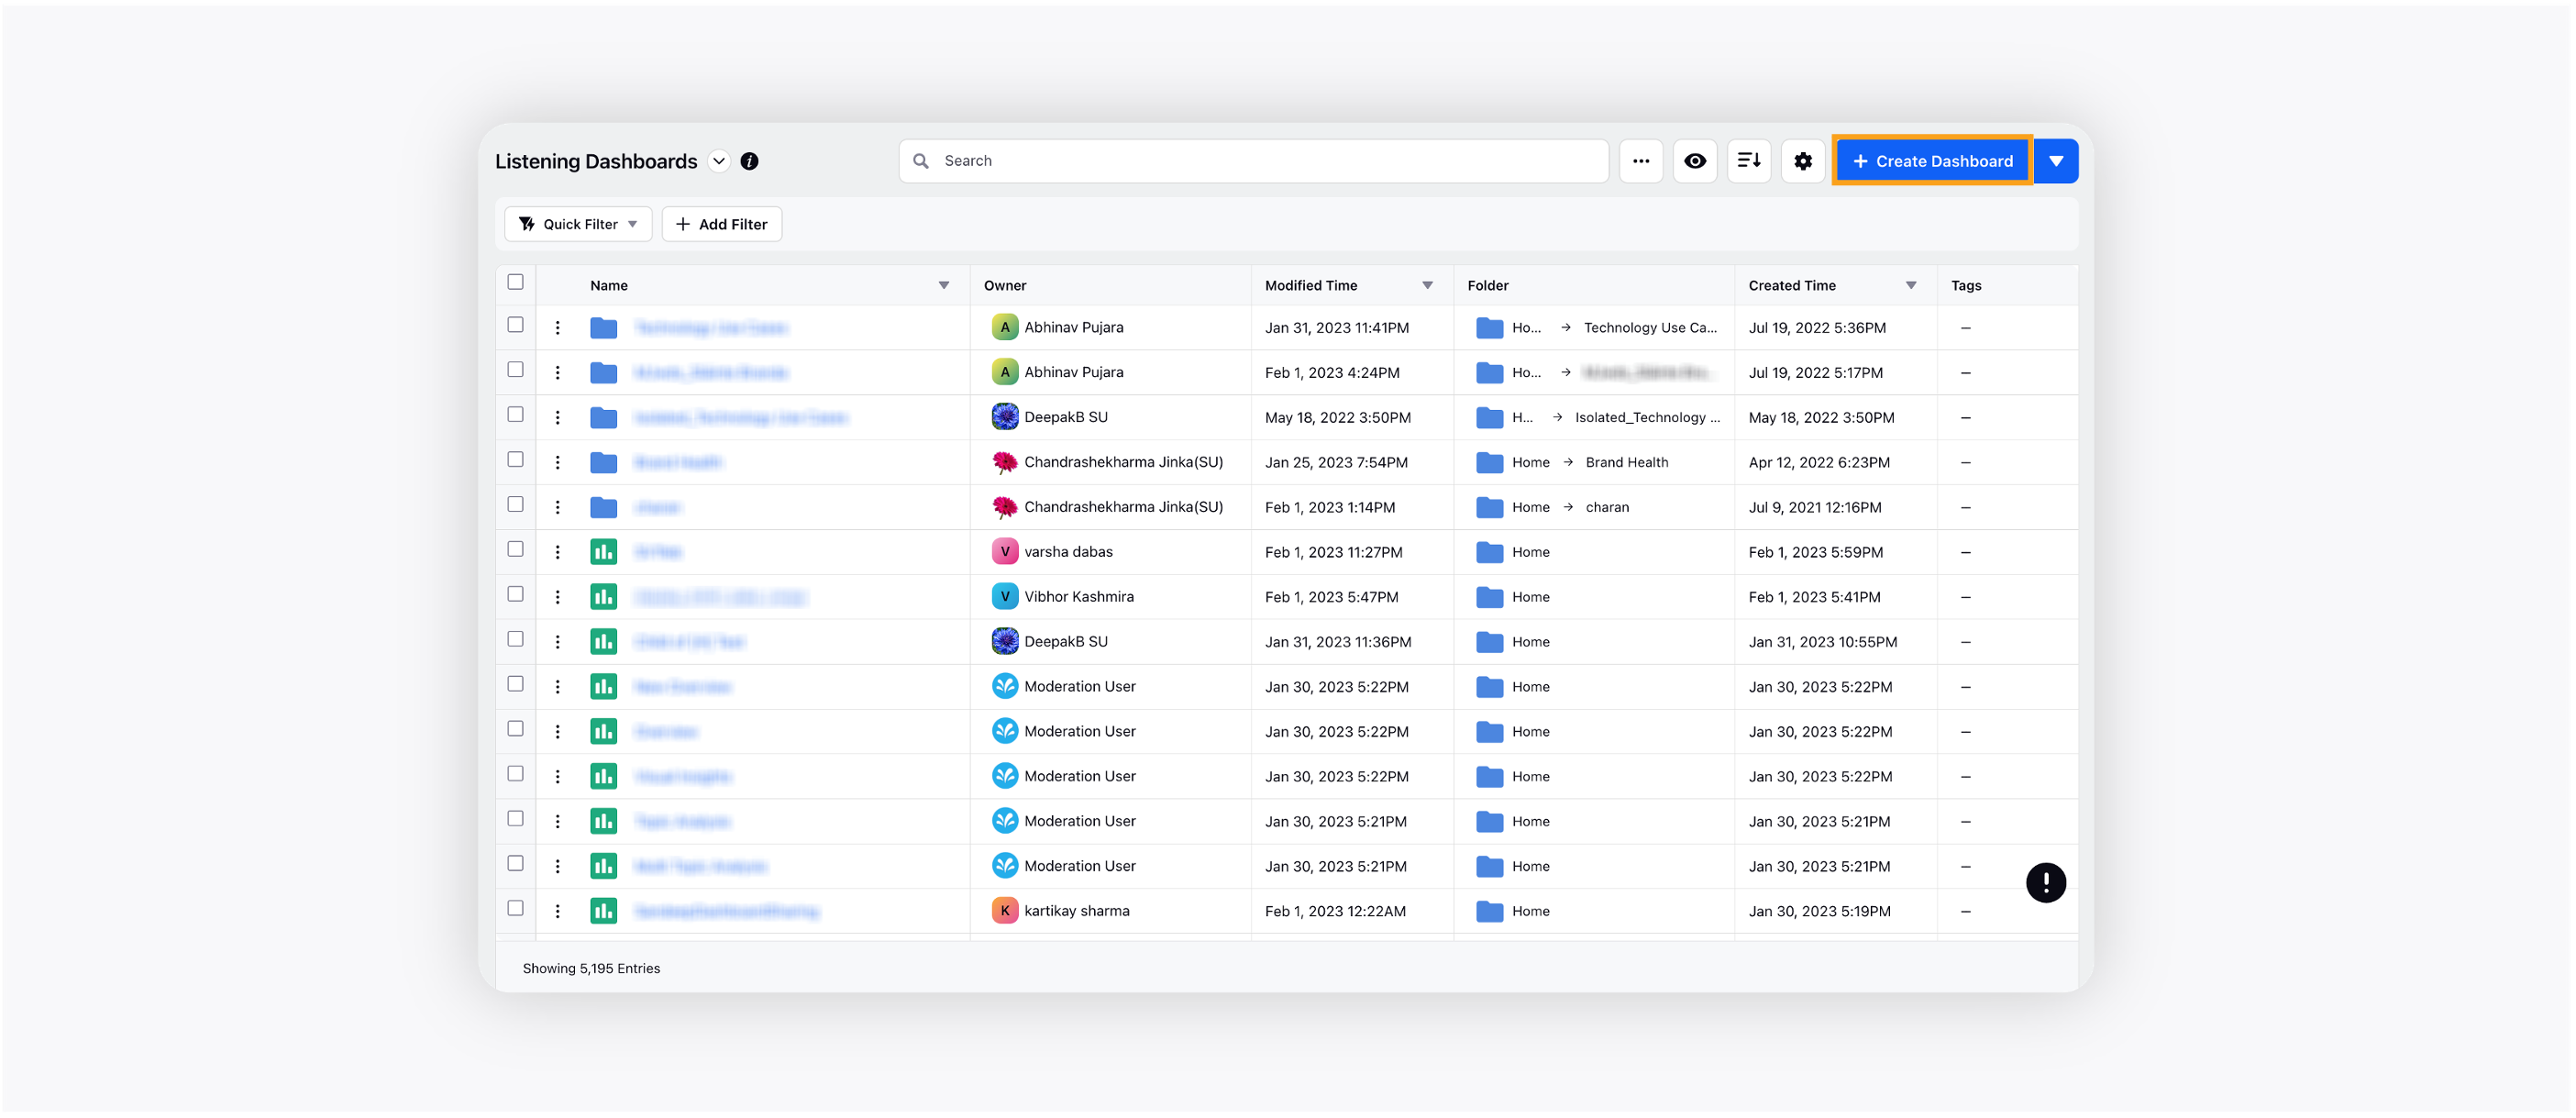
On the Listening Dashboards homepage, click the desired dashboard you want to open or search for the desired dashboard by simply entering its name in the search bar. You can also create a new dashboard by clicking the Create Dashboard button in the top right corner.
Note:
Widgets can only be added to custom dashboards. Refer to this section in the article to understand the difference between standard and custom dashboards.
On the Listening dashboard, click the Add Widget button in the top right corner to add a new widget to the dashboard.
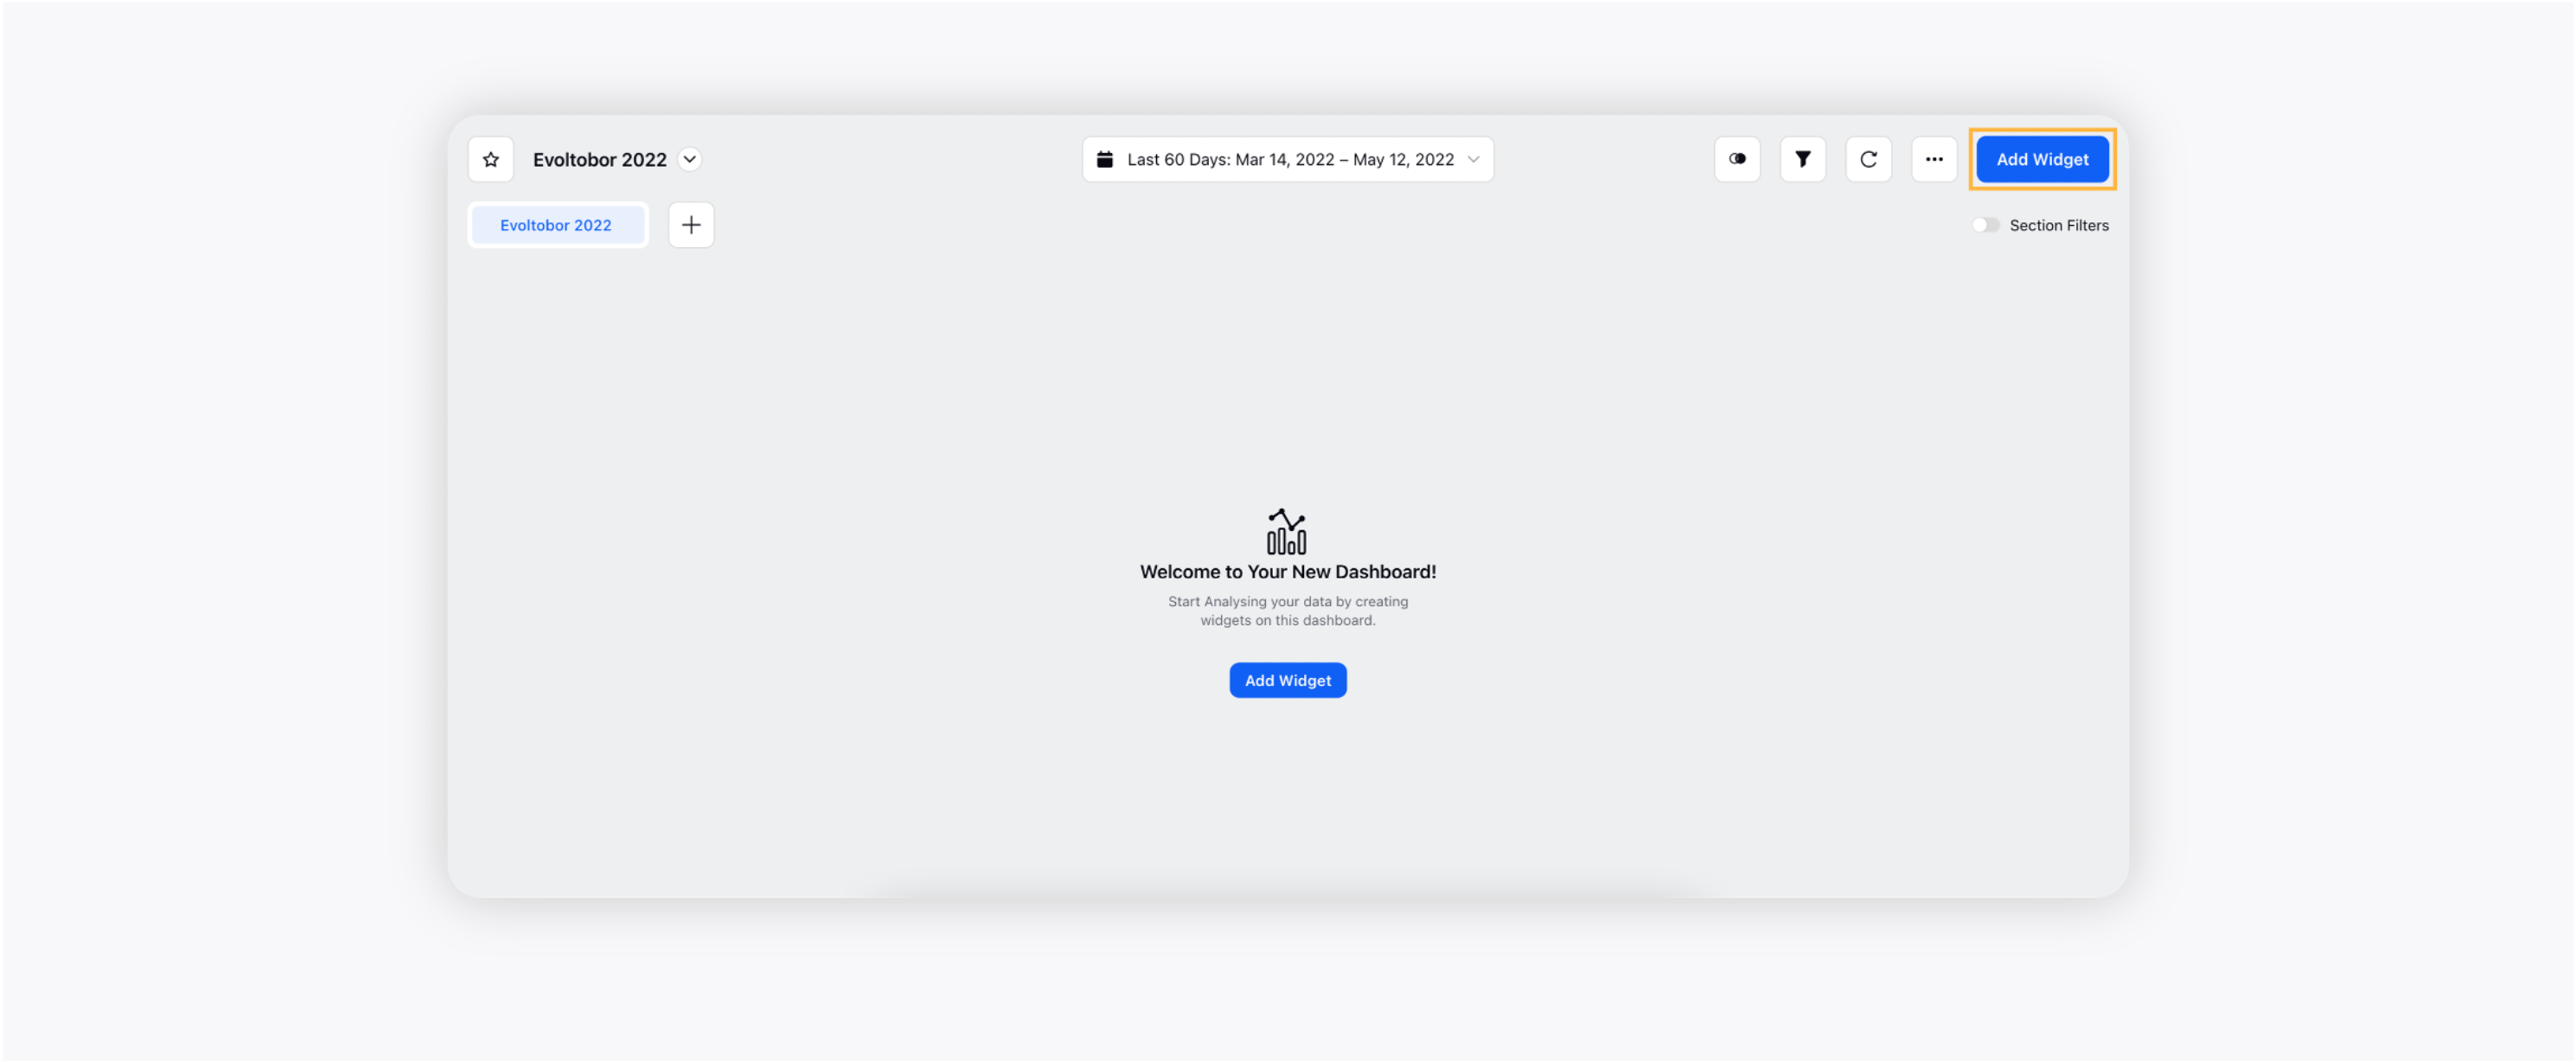
You will be taken to the Widget Builder window where you can add a widget directly from the Widget Library or you can create a custom widget. The Widget Library contains many predefined widgets you can choose from.
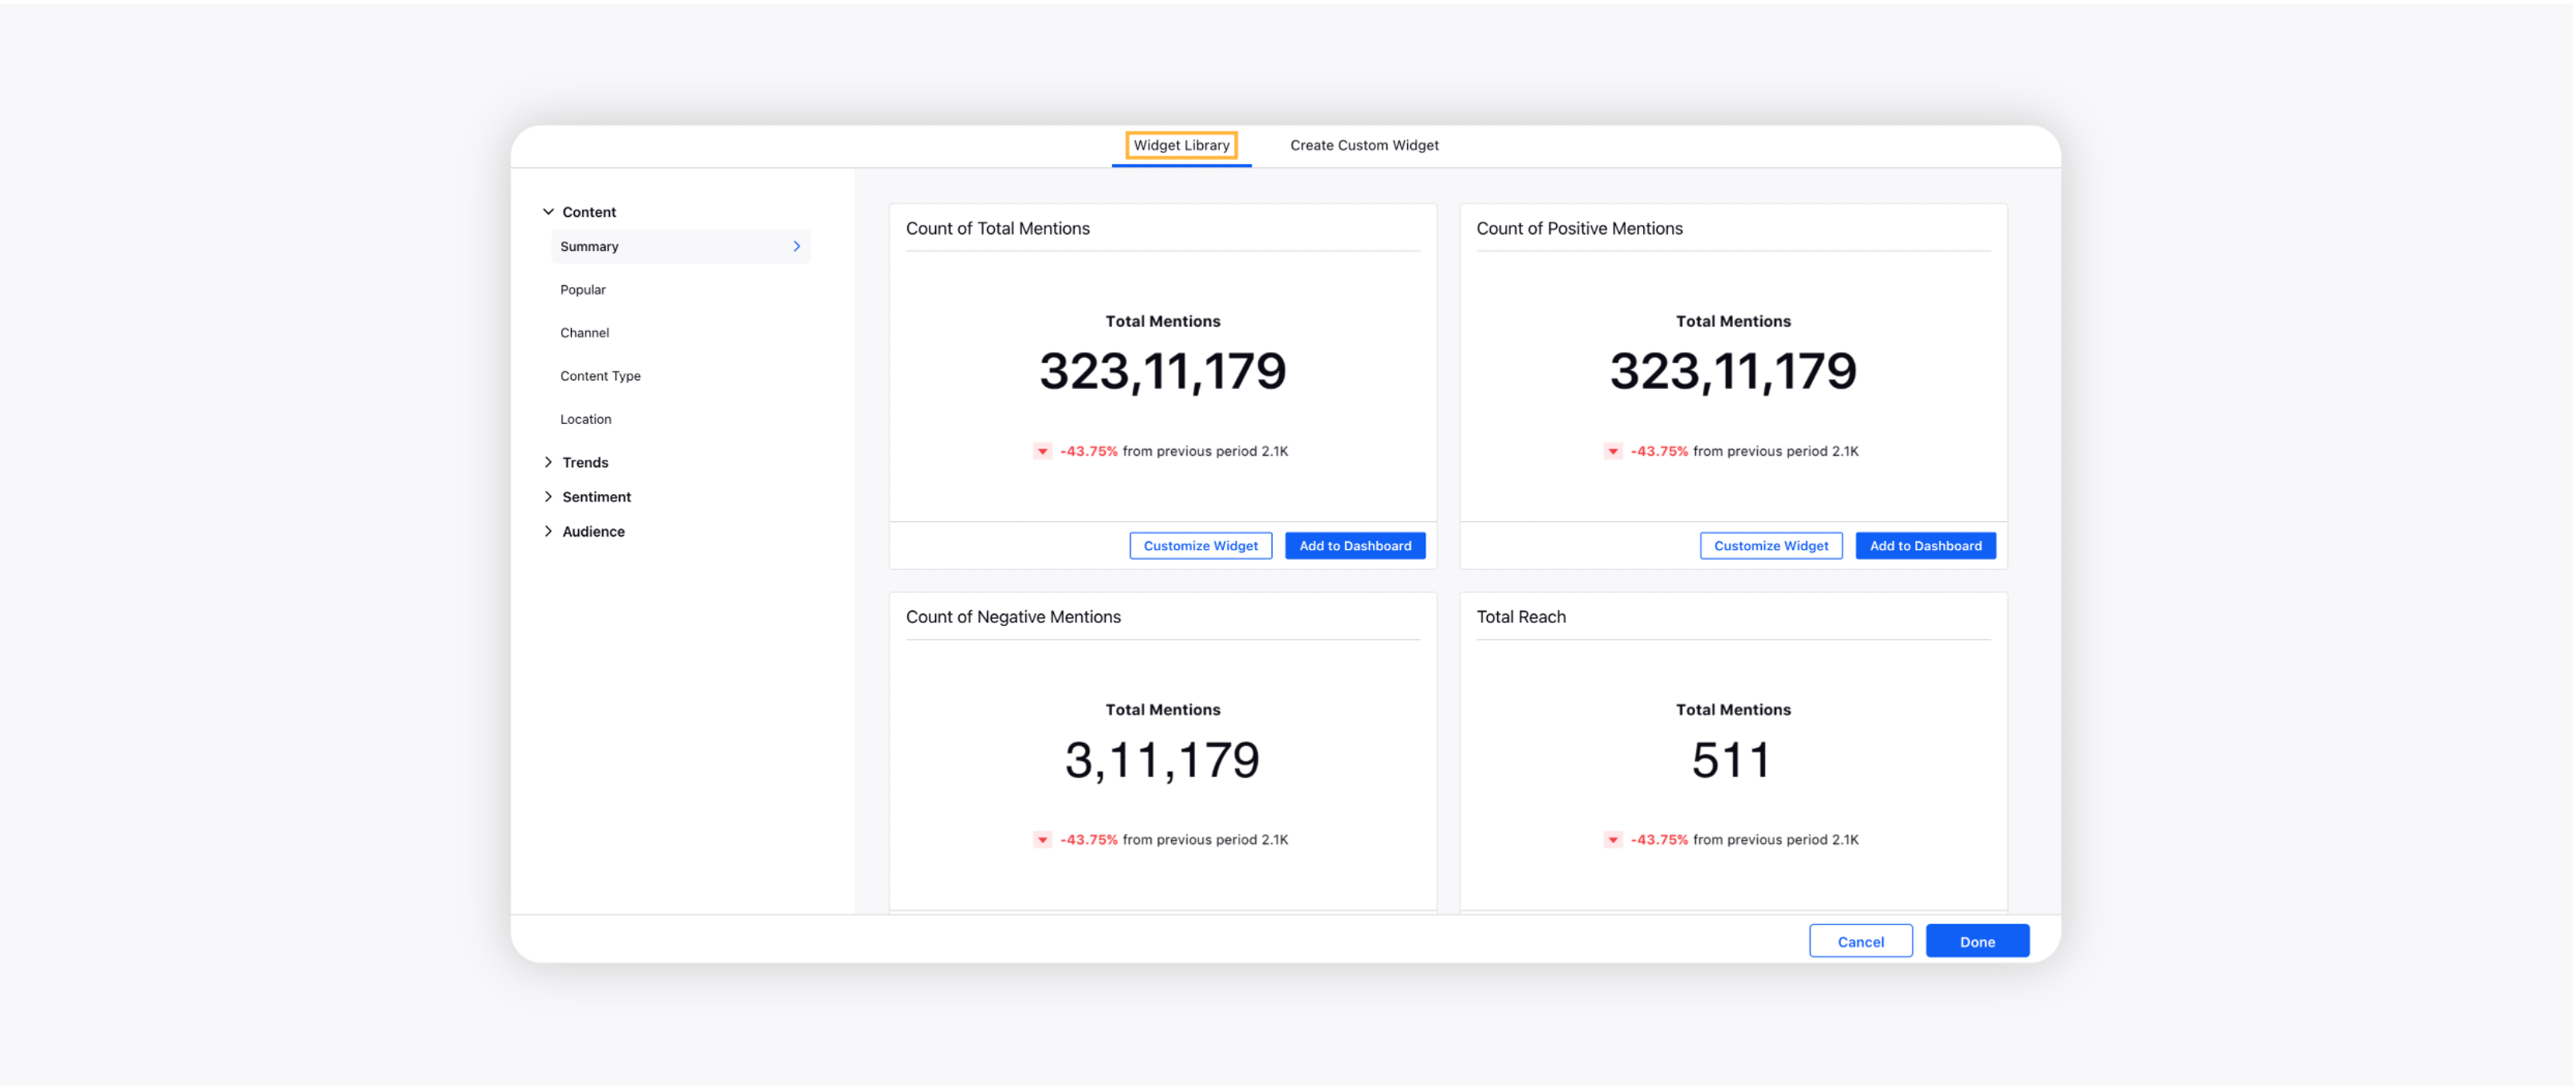
Another way to create widgets is through the create widget tab. Go to the Create Custom Widget tab, enter the widget’s name, and select Listening as Data Source.

After that, select a visualization type for your widget. For more information, see – Types of Listening Widgets.
Fill out the remaining preferences for your widget (these fields depend on the type of the widget and visualization you have selected in Step 5 and Step 6). You need to select Metrics and Dimensions along with Aggregate Functions.
Click Add to Dashboard in the bottom right corner of the widget builder.
The widget will be successfully added to your Listening dashboard. Repeat the above steps to add more widgets to your custom Listening dashboard.
Add filter to the Listening dashboard
After adding the widget to your Listening dashboard, you must add at least one of these filters (in the inclusive state) in order to plot data in the widget: Account, Account Group, Business Location, Case Id, Conversation Stream, Data Ingestion File Name, Data Ingestion File Tag, Domain, Global Profile List, Global Queues, Group By, Hierarchy Path, Keyword List, Keyword List Tag, Keyword Query, Parent Tweet Id, Permalink, Photo Text, Product, Product Brand Name, Survey, Theme, Theme Tag, Topic, Topic Group, Topic Tag, Universal Case Custom Property, or Workspace Queues.
For example, if you want to add a Topic to your Listening dashboard, click the Add Filter button, click Topics, and then select the desired Topic(s) you would like to add to your dashboard. This is demonstrated by the GIF below:
Note: If you apply different data fetching filters on your Listening dashboard having multiple widgets plotted, each widget will reflect the data from the corresponding filters. However, if multiple filters are added on a single widget, even if a message maps to more than one data fetching entity, it will still be counted only once. This is architecturally designed to avoid redundancy on Listening dashboards. |
Use Select All option
While choosing Custom Fields on filters, you can enter keywords in the value field in order to search for specific custom fields. If the number of returned entries is less than or equal to 100, then the Select All option appears. Clicking this option will select all the matching entries in one go, preventing you from selecting custom fields one by one.
Note:
|
Ability to add multiple comma separated entities in widget filter
While applying filters to a Listening dashboard at the widget level, you can add multiple entities as comma separated values in order to add multiple entities in one go. For example, if you want to select multiple Topics in the Topic filter without selecting them one by one, what you can do now is you can simply create a list of the Topics you want to add (i.e. Topic1, Topic2, Topic3, Topic4), copy the list, and paste it in the values field within the widget filter. Doing this will select all the topics you have entered in the comma-separated values. Please note that –
The list should be created in the comma-separated values format.
The entries that do not match the values available in the filter will be highlighted in an error state. So, make sure you write the correct entries to get all the desired Topics or any other entities added in one go.
To create a Listening widget having specific data from Listening Topic(s)
Click the New Tab icon. Under Sprinklr Insights, click Listening Dashboards within Learn.
On Listening Home, click the dashboard you want to open.
On the listening dashboard, click Add Widget in the top right corner.
On the Create Custom Widget tab, enter the name of the widget and select Listening as Data Source.
After that, select a visualization type for your widget, and select the Dimensions and Metrics for your topic.
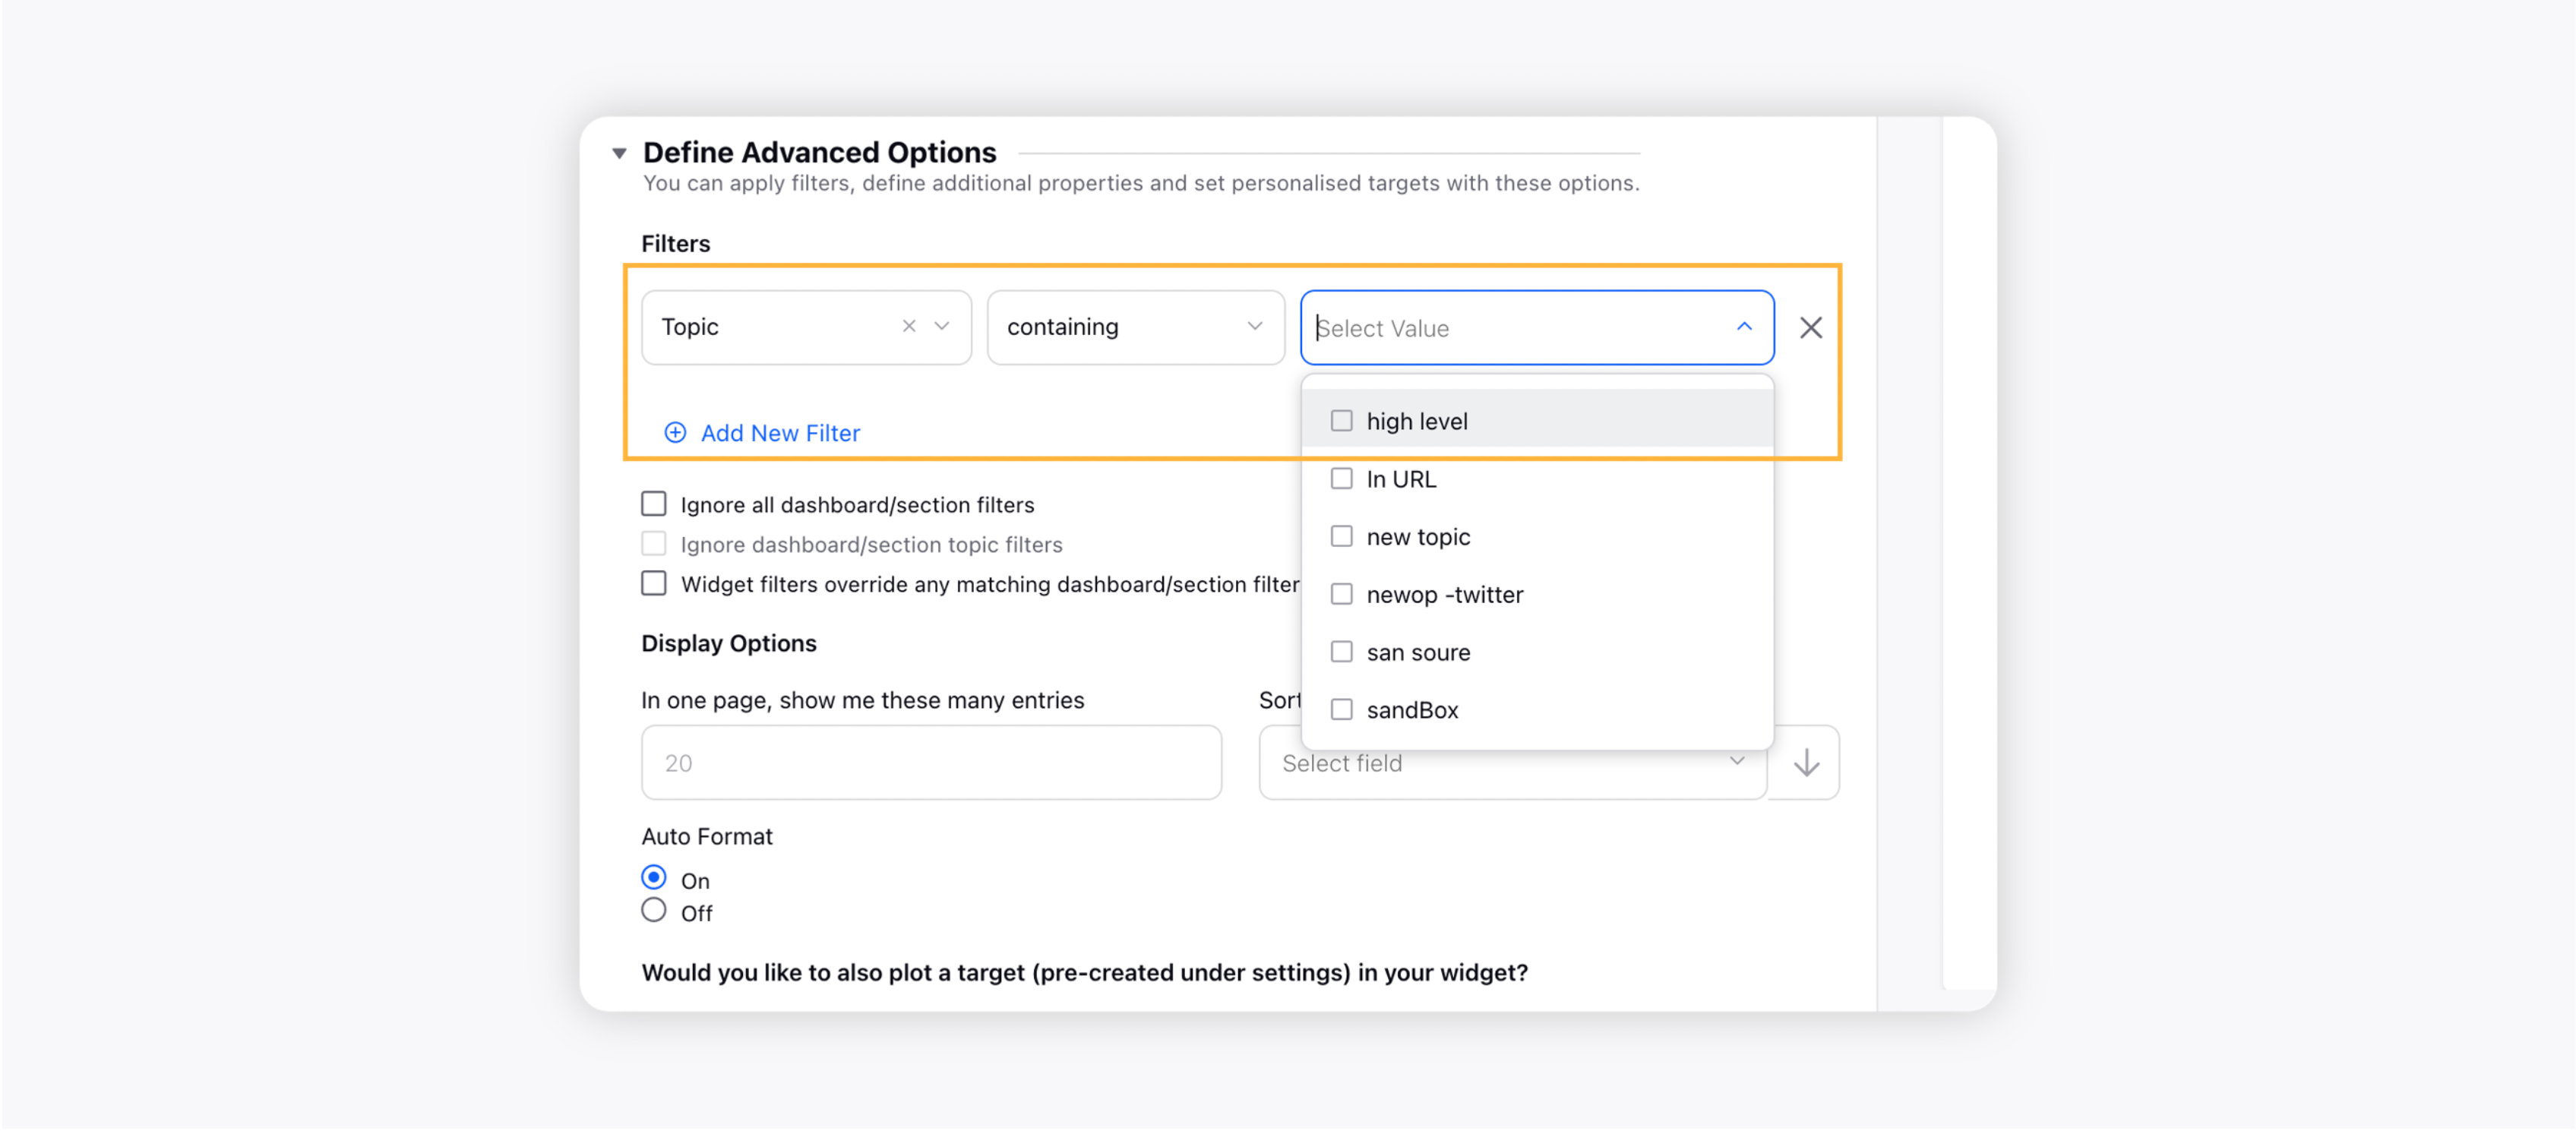
Scroll down to the Define Advanced Options section. In the Filters section, select the Dimension as Topic, and select containing or not containing to include or exclude a Value.
Search and select any specific Topic(s) as Values. To add more filters, click the Addition icon next to the Filters field.
Click Add to Dashboard to add the widget to your dashboard.
Note: You can select multiple topics in the Topic filter without selecting them one by one. What you can do is you can simply create a list of the topics you want to add (i.e. Topic1, Topic2, Topic3, Topic4), copy the list, and paste it into the values field within the widget filter. Doing this will select all the topics you have entered in the comma-separated values. Please make sure that –
|
After adding the widget, it will be shown on the dashboard. You can add single or multiple widgets on a dashboard (one widget at a time).
Ability to edit widget name
After adding the widget, if you want to edit the widget name, you can easily do it without going to the Edit Widget screen. To edit the widget name, double-click the widget name, type the desired name for your widget, and press Enter. This is demonstrated by the GIF below –
Inline addition of widget titles even if Title field is empty
You can now easily add the widget title even if the title field is empty without going to the widget editing mode. Simply hover over the title field of the widget, double click it, and then enter a name for the widget. Upon hovering over the title field, the widget name will be shown as Untitled. This is demonstrated by the GIF below –