Manage Master Forecast
Updated
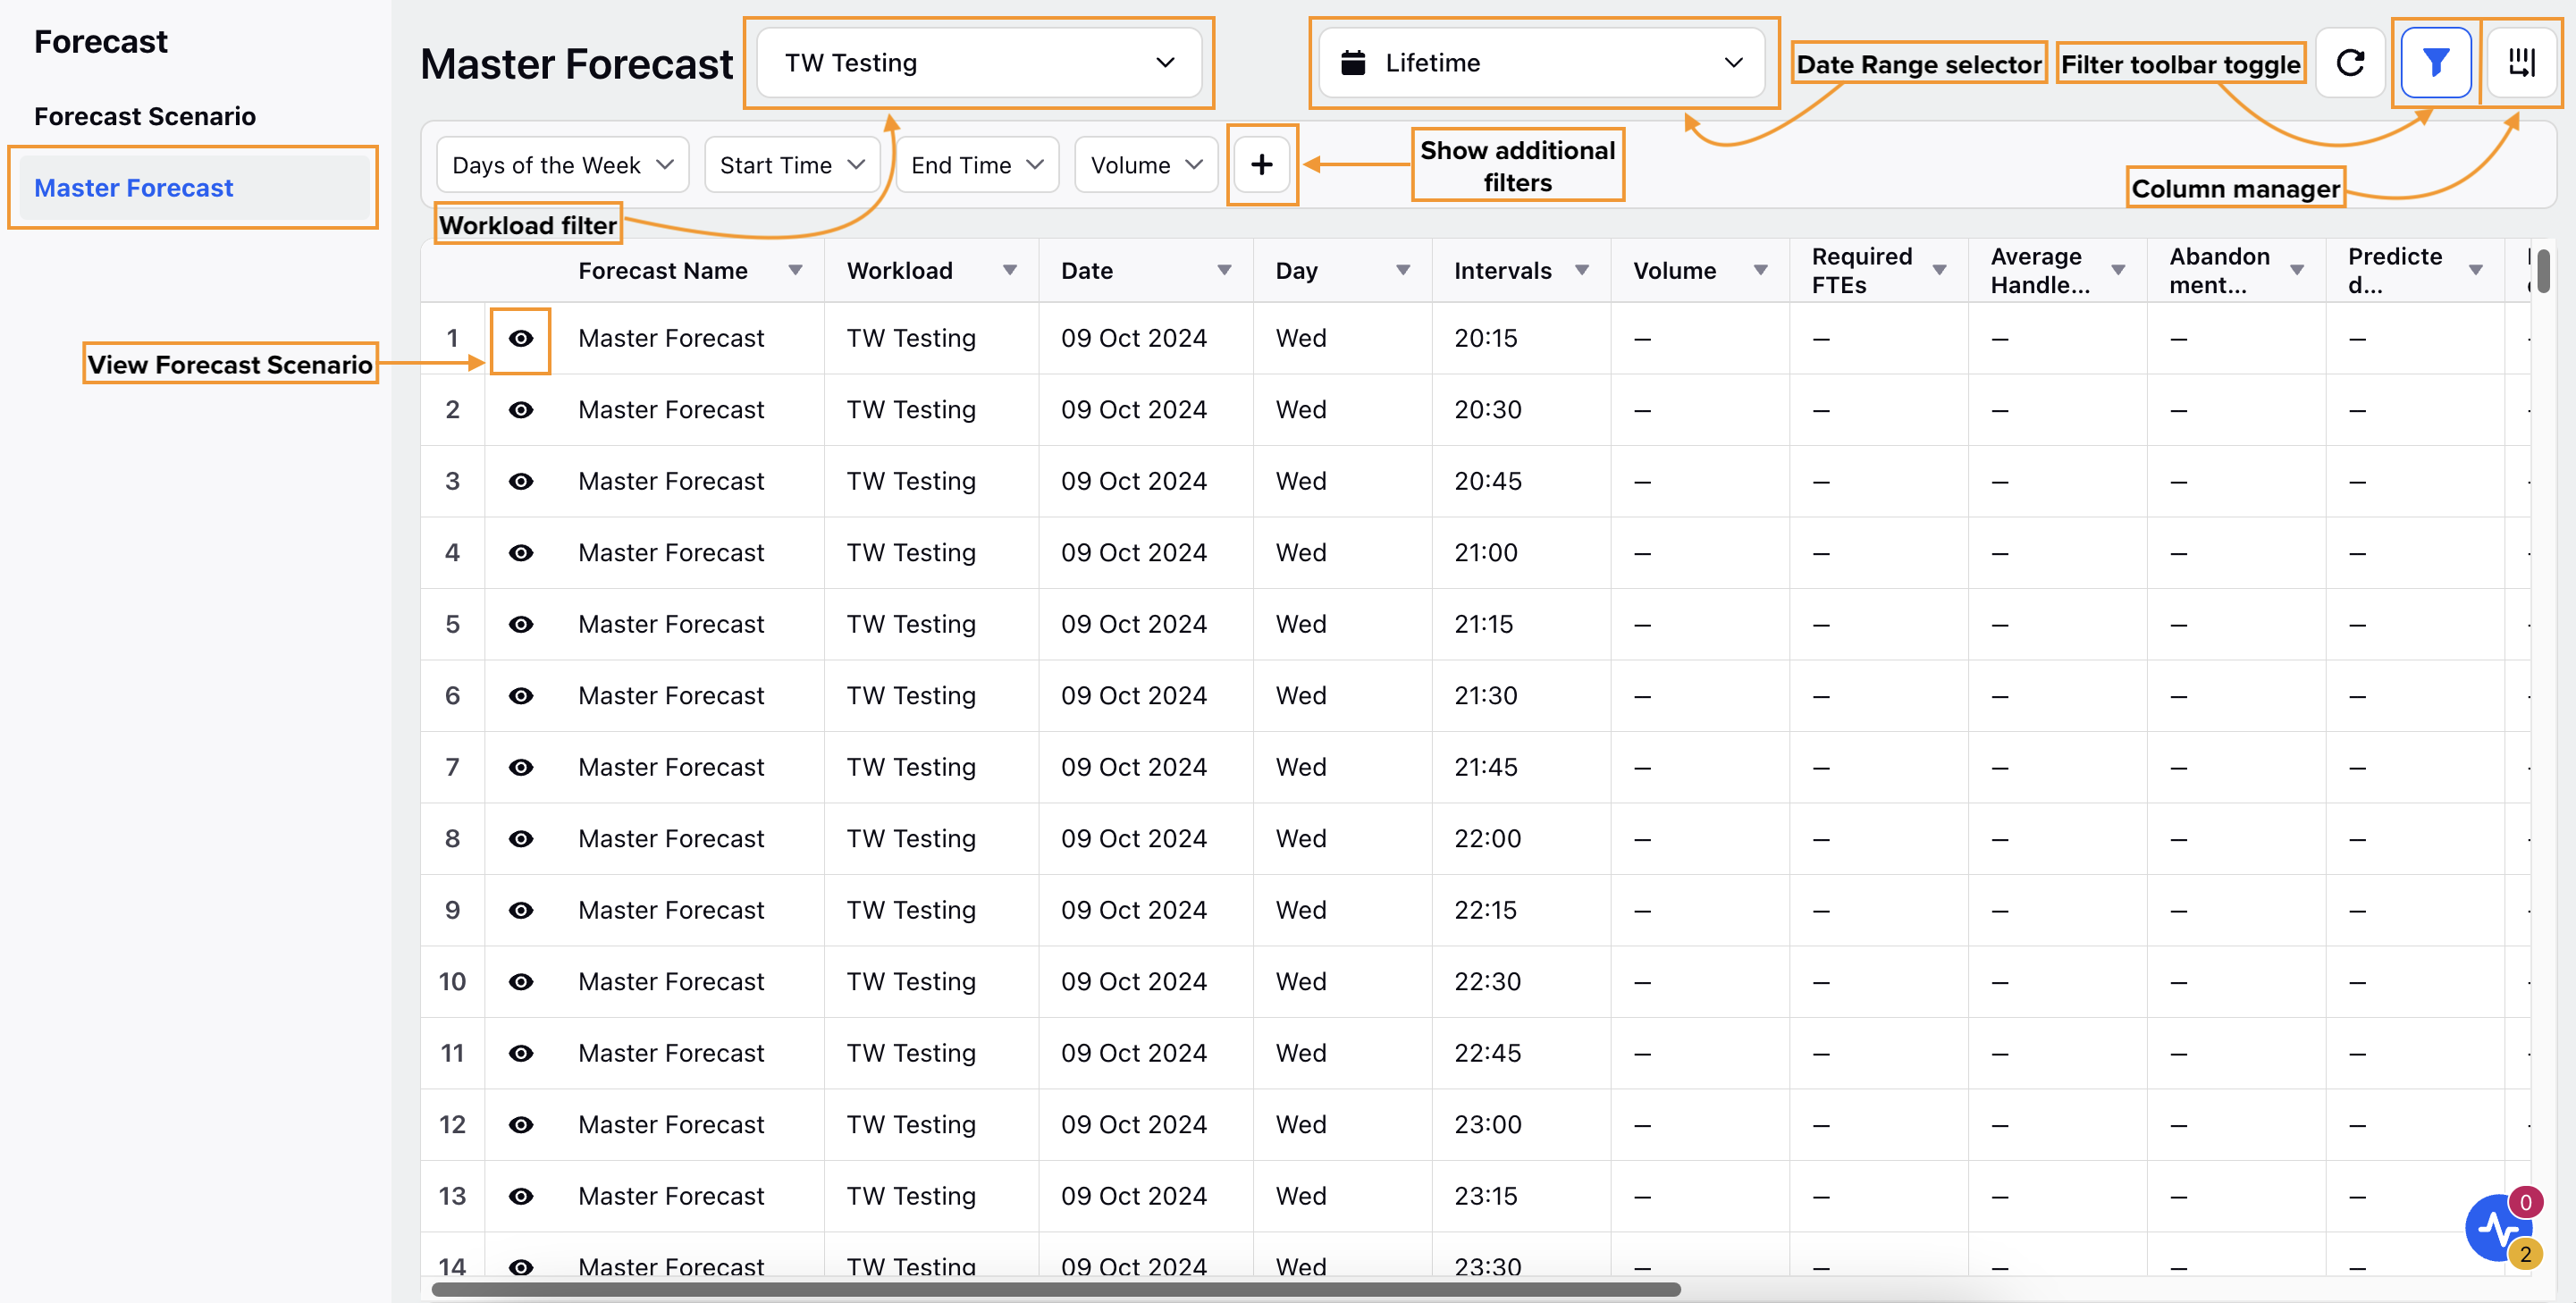
The Master Forecast in Sprinklr WFM offers a comprehensive overview of published Forecast Scenarios and their associated Capacity Planning (also called Staffing). It includes Volumes and Staffing data based on published Forecasting Scenarios. Through the Master Forecast Record Manager, you can quickly access Forecast Scenarios, including details such as Date, Day, Interval, Volume, and various other parameters. This functionality provides an accurate depiction of your contact center’s staffing requirements.
Note: The steps and information provided in this article pertain to Sprinklr WFM Version 2 (v2), which is the latest version. For information on Sprinklr WFM Version 1 (v1), please refer to the Version 1 section.
Navigate to Master Forecast
Follow these steps to navigate the Master Forecast:
Go to the Workforce Manager Persona App on the Launchpad.
Select Forecast from the Left Pane to open the Forecast Scenarios homepage.
Select Master Forecast towards the top left of the homepage to open the Master Forecast record manager.

The Forecast Scenarios in the Master Forecast Record Manager can be filtered based on the associated Workload, Day of the Week, Volume, Shrinkage, Average Handling Time (AHT), and more. The data is displayed in multiple columns, which can be hidden or rearranged depending on your requirements or preferences. Below are the columns which are available in the Master Forecast Record Manager:
Column Name | Description |
Forecast Name | Shows the name of the Forecast Scenario. |
Workload | Shows the Workload associated with the Forecast Scenario. |
Date | Shows the date of the Forecast Scenario. |
Day | Shows the day of the week of the Forecast Scenario. |
Intervals | Shows the time interval for which the Forecast Scenario has been created. |
Volume | Shows the forecasted inbound volume for the specified interval. |
Required FTEs | Shows the required Full-Time Equivalents (FTEs) for the forecasted inbound volume. |
Average Handling Time | Shows the estimated Average Handling Time (AHT) for the interval. |
Abandonment Rate | Shows the estimated Abandonment Rate for the interval. |
Predicted Occupancy | Shows the predicted Occupancy for the interval. |
Predicted SL | Shows the predicted Service Level (SL) for the interval. |
Max Occupancy | Shows the predicted maximum Occupancy for the interval. |
Min Service Level Goal | - |
Min Service Level Time | - |
Shrinkage | Shows the predicted Shrinkage for the interval. |
Available Filters
The Master Forecast Record Manager can be customized to show Forecast Scenarios with a selected Workload. You can also select the date range for which the Forecast Scenarios should be displayed on the Record Manager. Below are the filters that can applied to sort the information:
Filter | Description |
Workload | Display Forecast Scenarios based on the associated Workload. |
Days of the Week | Display Forecast Scenarios that are created for the selected day(s) of the week. |
Start Time | Display Forecast Scenarios that start at the specified time. The options are in 24-hour format. |
End Time | Display Forecast Scenarios that end at the specified time. The options are in 24-hour format. |
Volume | Display Forecast Scenarios based on the entered number. You can select the filter to be “Greater than”, “Greater than or Equal to”, “Less than”, “Less than or Equal to”, or “Equals” to the entered number. |
Average Handling Time | Display Forecast Scenarios based on the entered AHT. You can select the filter to be “Greater than”, “Greater than or Equal to”, “Less than”, “Less than or Equal to”, or “Equals” to the entered number. |
Service Level Goal | Display Forecast Scenarios based on the minimum target SLA. You can select the filter to be “Greater than”, “Greater than or Equal to”, “Less than”, “Less than or Equal to”, or “Equals” to the entered number. |
Service Time | Display Forecast Scenarios based on the entered minimum target SLA. You can select the filter to be “Greater than”, “Greater than or Equal to”, “Less than”, “Less than or Equal to”, or “Equals” to the entered number. |
Max Occupancy | Display Forecast Scenarios according to the entered maximum Occupancy. You can select the filter to be “Greater than”, “Greater than or Equal to”, “Less than”, “Less than or Equal to”, or “Equals” to the entered number. |
Target In Office Shrinkage | Display Forecast Scenarios according to the entered Shrinkage. You can select the filter to be “Greater than”, “Greater than or Equal to”, “Less than”, “Less than or Equal to”, or “Equals” to the entered number. |
Target Out of Office Shrinkage | |
Required FTEs | Display Forecast Scenarios according to the entered FTEs required. You can select the filter to be “Greater than”, “Greater than or Equal to”, “Less than”, “Less than or Equal to”, or “Equals” to the entered number. |
You can open the detailed view of each Forecast Scenario by clicking the View Forecast (Eye icon) button corresponding to the Forecast Scenario. This page shows the comprehensive view of the Forecast Scenario which includes the Aggregated Volume Forecast Trend, Workload-specific Volume Forecast Trend, and the actual Workload-specific Volume Forecast.
The detailed view page of the Forecast Scenario enables you to Publish or Unpublish the Forecast Scenario along with adding Adjustments to it.
View Forecast Scenarios
You can view Forecast Scenarios from both the Forecast Scenario and Master Forecast record managers. The Forecast Scenario record manager allows you to search for scenarios by name, creator, status, Workload, and type. The Master Forecast record manager offers additional filtering options, as detailed in the Available Filters section. However, once you view a Forecast Scenario, the display is identical, regardless of which record manager you navigated from.
View Forecast Scenario from Forecast Scenario Record Manager
Follow these steps to view a Forecast Scenario from the Forecast Scenario record manager:
Navigate to the Forecast Scenario record manager.
Click the View Forecast (Eye icon) button corresponding to the Forecast Scenario.
This will open a detailed view of the Forecast Scenario.
View Forecast Scenario from Master Forecast Record Manager
Follow these steps to view a Forecast Scenario from the Master Forecast record manager:
Navigate to the Master Forecast record manager.
Click the View Forecast (Eye icon) button corresponding to the Forecast Scenario.
This will open a detailed view of the Forecast Scenario.

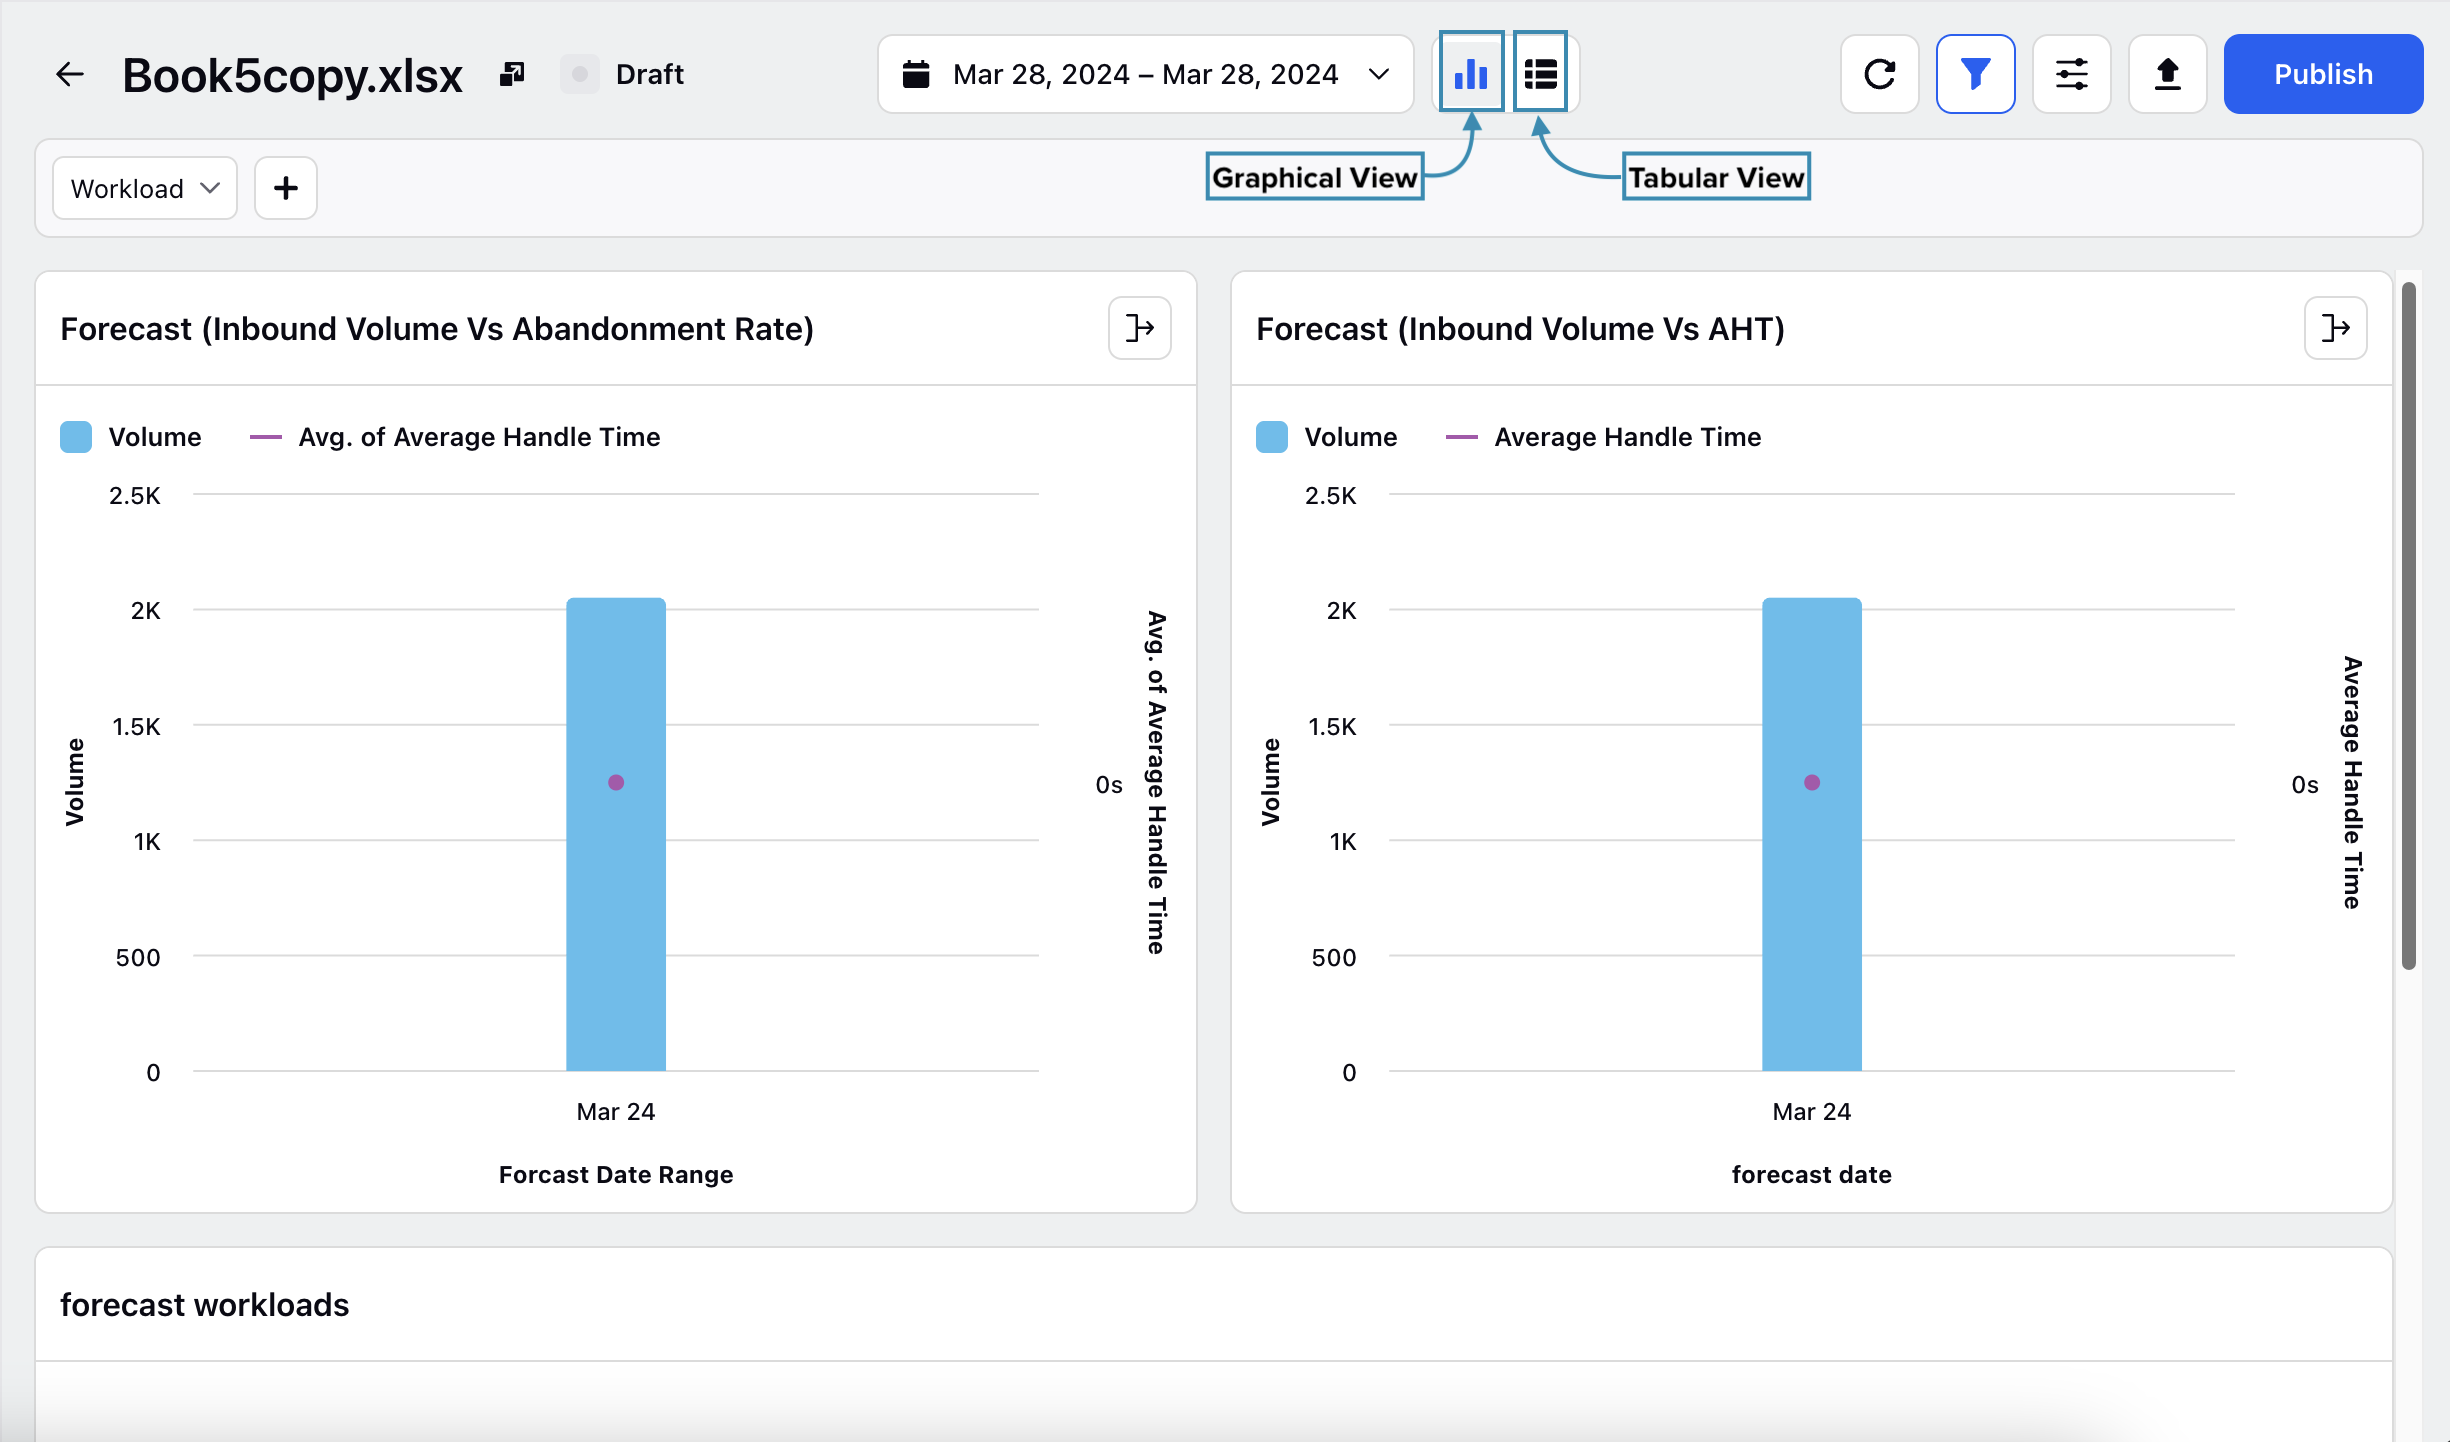
This page shows a comprehensive view of the Forecast Scenario, which includes the Aggregated Volume Forecast Trend, Workload-specific Volume Forecast Trend, and actual Load-Specific Volume Forecast. It also enables you to Publish or Unpublish the Forecast Scenario along with adding Adjustments to it.
Forecast Scenarios can be viewed in either the Graphical View (default) or the Tabular View. It can be switched from the view selector at the top of the page.
Tabular View
In the tabular view of Forecast Scenarios, details are displayed in a table. The columns represent metrics related to the Forecast Scenario, such as volume, average handling time (AHT), service level, and more. The rows show the details of these metrics with a granularity pre-configured for your environment.
Note: You can select the aggregation interval to customize the data for your requirements. Click the Aggregation button at the top right of the page and select Daily from the sub-menu.

Column Aggregation
You can aggregate the data for each column, which helps Workforce Managers to analyze trends. Aggregations can be applied to each column without affecting the data from other columns. Following are some situations in which aggregating the Forecast Scenario data is beneficial:
Volume Tracking: Aggregate the Volume column to monitor case flow at the desired granularity within the selected date range.
Average Handle Time (AHT) Measurement: Aggregate the Average Handle Time column to evaluate AHT across different agents and departments.
Required FTE Calculation: Aggregate the Required FTEs column to determine the total number of agents needed for the specified date range.
The following aggregation functions can be applied to the columns:
Sum: It adds individual values across granular intervals.
SumProduct: It multiplies corresponding elements in specified arrays and sums the results to calculate various metrics.
The following table details the aggregation functions available for each column and explains how they are calculated.
Column | Aggregation Function | Calculation |
Volume | Sum | Sum of all volume records grouped by day or date for each Workload. |
Average Handling Time | SumProduct | SumProduct of Volume and Average Handling Time for the specified date range. |
Service Level Goal | SumProduct | SumProduct of Volume and Service Level Goal for the specified date range. |
Service Time | SumProduct | SumProduct of Volume and Service Time for the specified date range. |
Max Occupancy | SumProduct | - |
Required FTEs | Sum | Sum of all FTEs required for the date range. |
Target In Office Shrinkage | SumProduct | SumProduct of Required FTE and In Office Shrinkage for the specified date range. |
Target Out of Office Shrinkage | SumProduct | SumProduct of Required FTE and Out-of-Office Shrinkage for the specified date range. |
Required Agents | Sum | Sum of all agents required for the date range. |
Follow these steps to apply column aggregation:
View the required Forecast Scenario.
Switch to Tabular View.

Hover over the down arrow in the corresponding column's header to show a sub-menu.
Select the available aggregate function (Sum or SumProduct) for the column.

The aggregated data will be displayed at the footer of the respective columns for the specified date range.
Export Forecast Scenarios
Prerequisites for creating Forecast Scenarios:
Sprinklr WFM should be enabled for the environment.
You must have access to the Workforce Manager Persona App.
Follow these steps to export a Forecast Scenario from the Master Forecast Record Manager:
Navigate to Master Forecast Record Manager.
Click the View Forecast (Eye icon) button corresponding to the Forecast Scenario to open the detailed view of the Forecast Scenario.

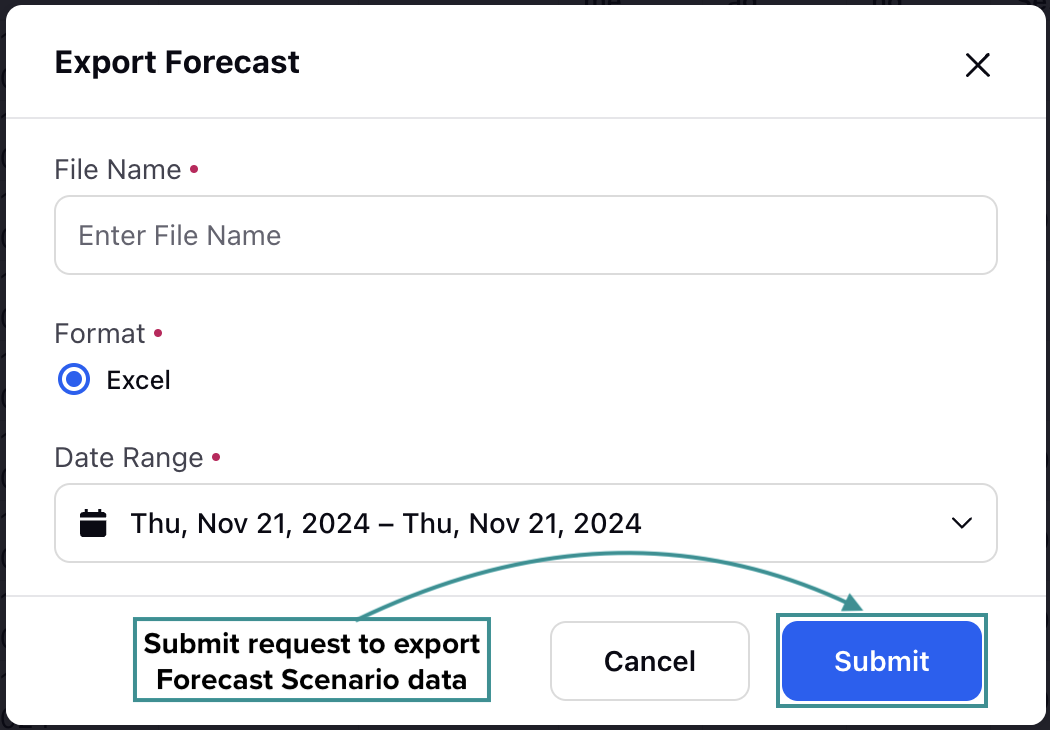
Click the Export button at the top right of the page to open the Export Forecast dialog box.
Fill in the required fields on the Export Forecast dialog box. Fields marked with a red dot are mandatory. Below are the descriptions of the fields on this dialog box:

File Name: Enter a unique and descriptive name for the exported file. (Required)
Format: Excel is selected by default. (Required)
Date Range: Select the date range for exporting data. This range must fall within the Forecast Period. (Required)
Click the Submit button at the bottom right of the dialog box to submit the export request.

You will receive a system notification confirming your export request. A link to download a zip folder containing the Forecast Scenario data will be provided shortly after.