Standard MM&A dashboards
Updated
Sprinklr has introduced new and upgraded dashboard templates in MM&A, designed to monitor and track key PR KPIs for brands, competitors, industry & executives. These dashboards are built with new enhanced widgets/visualizations to uncover actionable insights easily.
Standard templates drastically reduce the time to insights as these are pre-configured and require minimum inputs in form of Story Query/Story Query tags to start visualizing the data.
We have three different types of dashboard templates which can be used to achieve various PR use cases namely –
Story Query Analysis
Story Query Tag Analysis
Story Drilldown Dashboard
Use cases
Monitor Key Performance Indicators: The revamped dashboards can be used to monitor the performance of key indicators and metrics such as impact, reach, etc., in various visualizations, important for PR activities.
Monitoring PR Campaigns: The dashboard templates provide a visual representation of data such as media coverage, public sentiment, etc., giving a comprehensive view of your PR efforts. This can help PR teams identify areas for improvement and ensure that campaigns are reaching the desired audiences.
Identifying trends and opportunities: These dashboards can help identify trends and opportunities in the industry, which can help organizations make informed decisions about which topics or stories to pursue in their PR campaigns.
Monitoring competitors: The revamped dashboards can also be used to monitor competitors. By setting up alerts and tracking key metrics, organizations can gain insights into their competitors’ PR strategies and make informed decisions.
Identify crisis: These Dashboards can be used to identify and solve issues and crisis, such as negative sentiment among the stakeholders, detractors' reach, etc.
Story Query dashboard
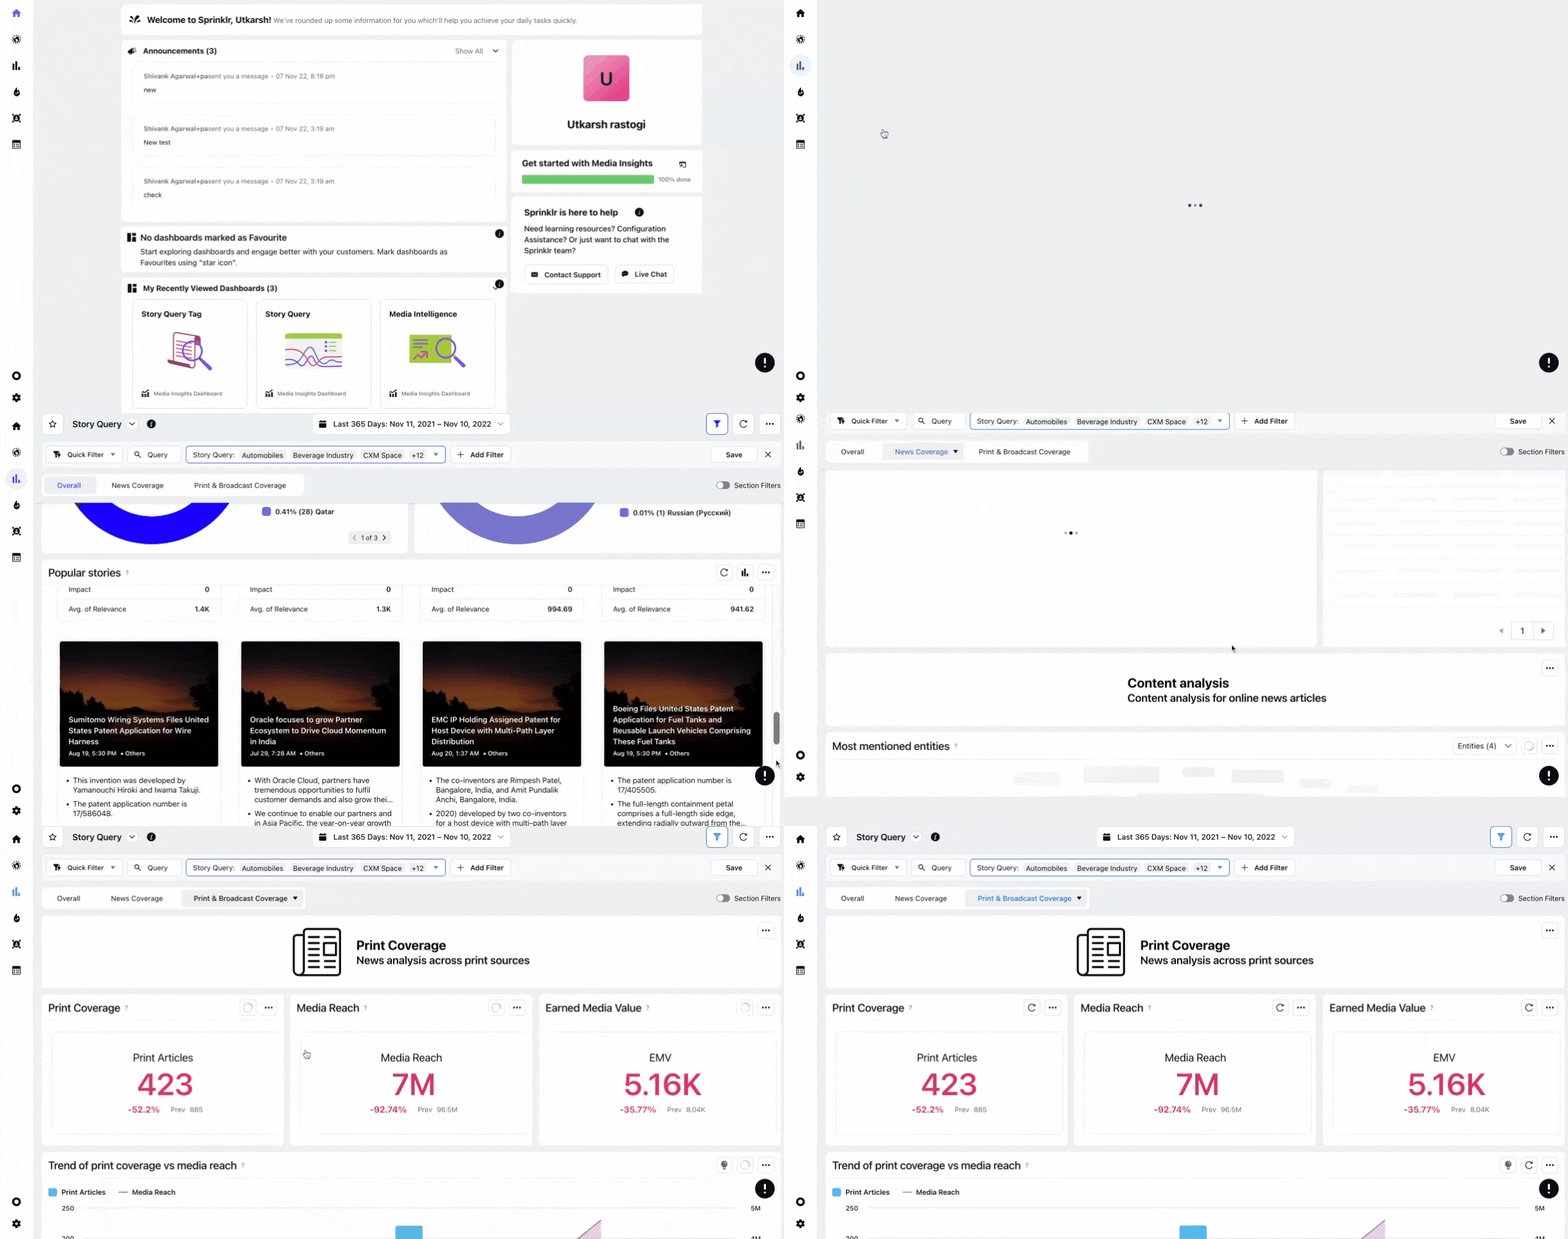
The story query dashboard helps you to measure the key PR performance indicators across editorial and social sources. It fetches detailed and actionable data around the story queries, rather than a tag or a particular story. This helps you focus your analysis strictly based on the story queries catering to your business goal.
The Story Query dashboard have 3 tabs –
Each of these tabs contains pre curated widgets displaying crucial metrics, such as News Reach, News Coverage, Publications Count, Sentiment Distribution, etc., which helps you in measuring the performance of a story.

Story Query Tag dashboard
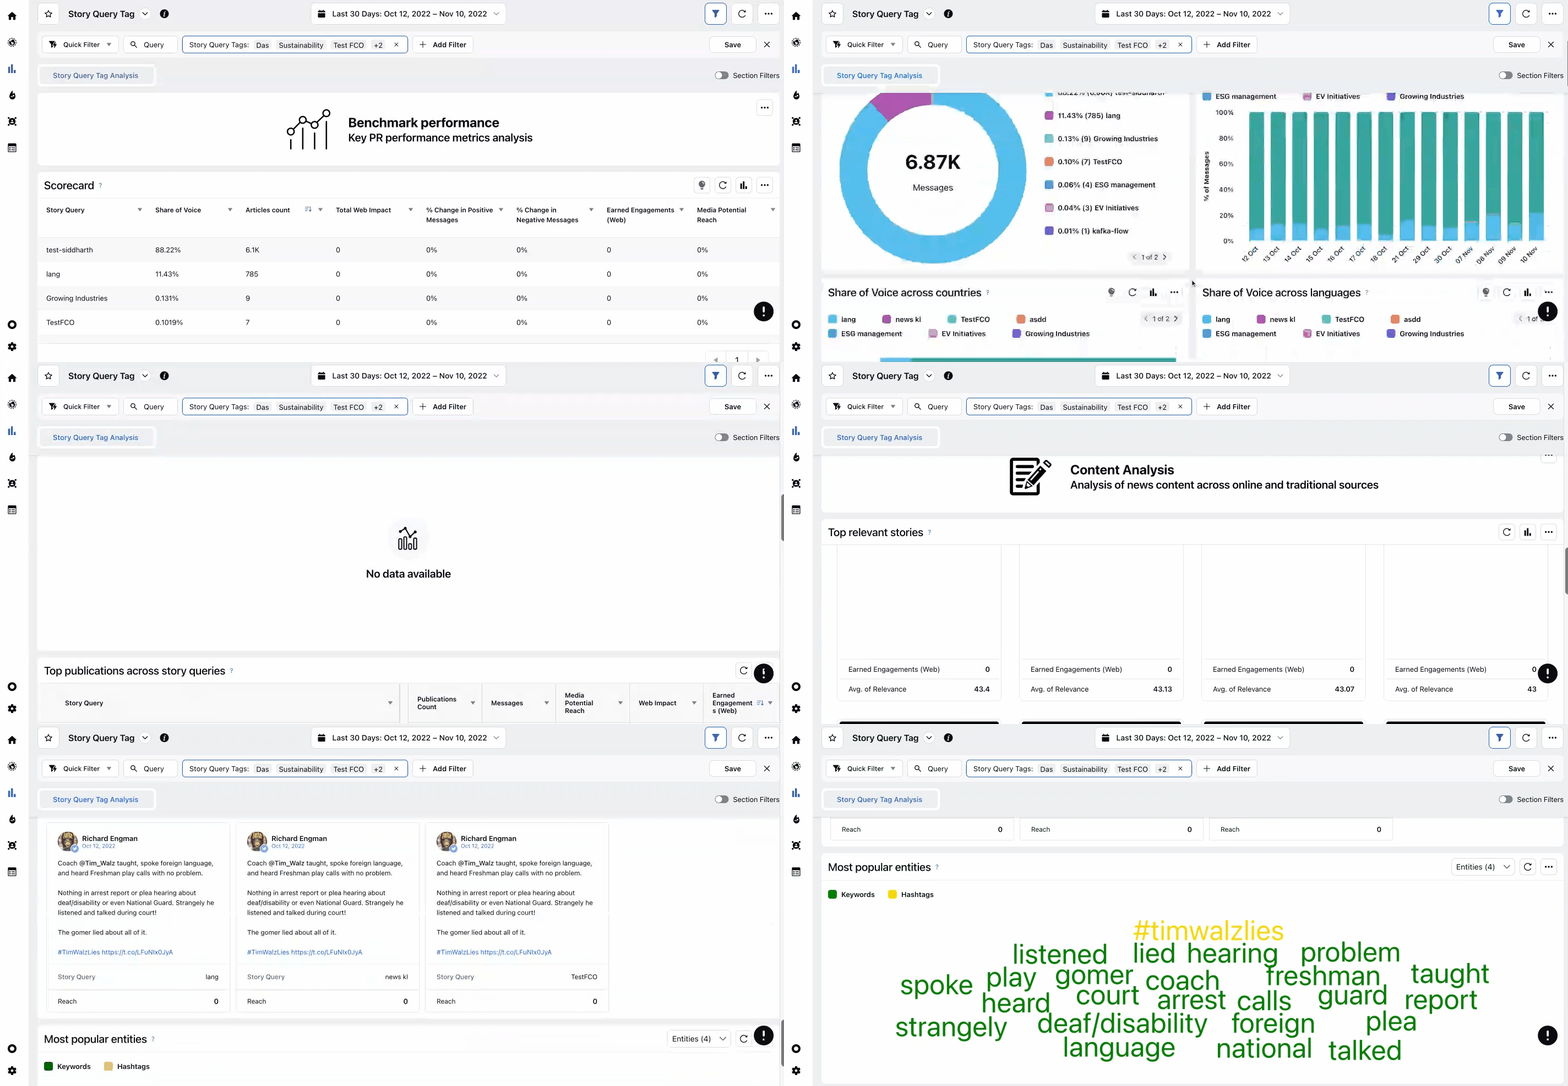
The story query tag dashboard allows you to compare and benchmark various entities, such as brands, products, executives, etc., using story queries grouped under a tag. The dashboard is set up using pre-curated widgets that track and analyze key PR metrics, such as share of voice, reach, impact, and trend, and provides detailed insights on content from web and traditional sources.

Story dashboard
To understand more about the dashboard and how you can leverage it to analyse stories, click here.