De-duplication of cases in Reporting
Updated
You can manage duplicate cases and view the unique case count by creating a table widget in reporting when there are multiple dimensions (comma-separated values) associated with a single case, for example, when there are multiple agents or social channels involved in the same cases.
Let's take an example to understand this better. Assume there are 3 agents, A, B, and C, who worked on the following cases.
Agent A worked on Cases 1, 2, and 3
Agent B worked on Cases 3, 4, and 5
Agent C worked on Cases 2, 5, and 6
Here, the unique cases assigned per user are 3. However, the sum total of unique cases is 6, and not 9.
To view the unique case count
Create a Table widget and select the Agent dimension with the Unique Cases Assigned To a User metric.
Next, check the box alongside Show Total under Configuration.
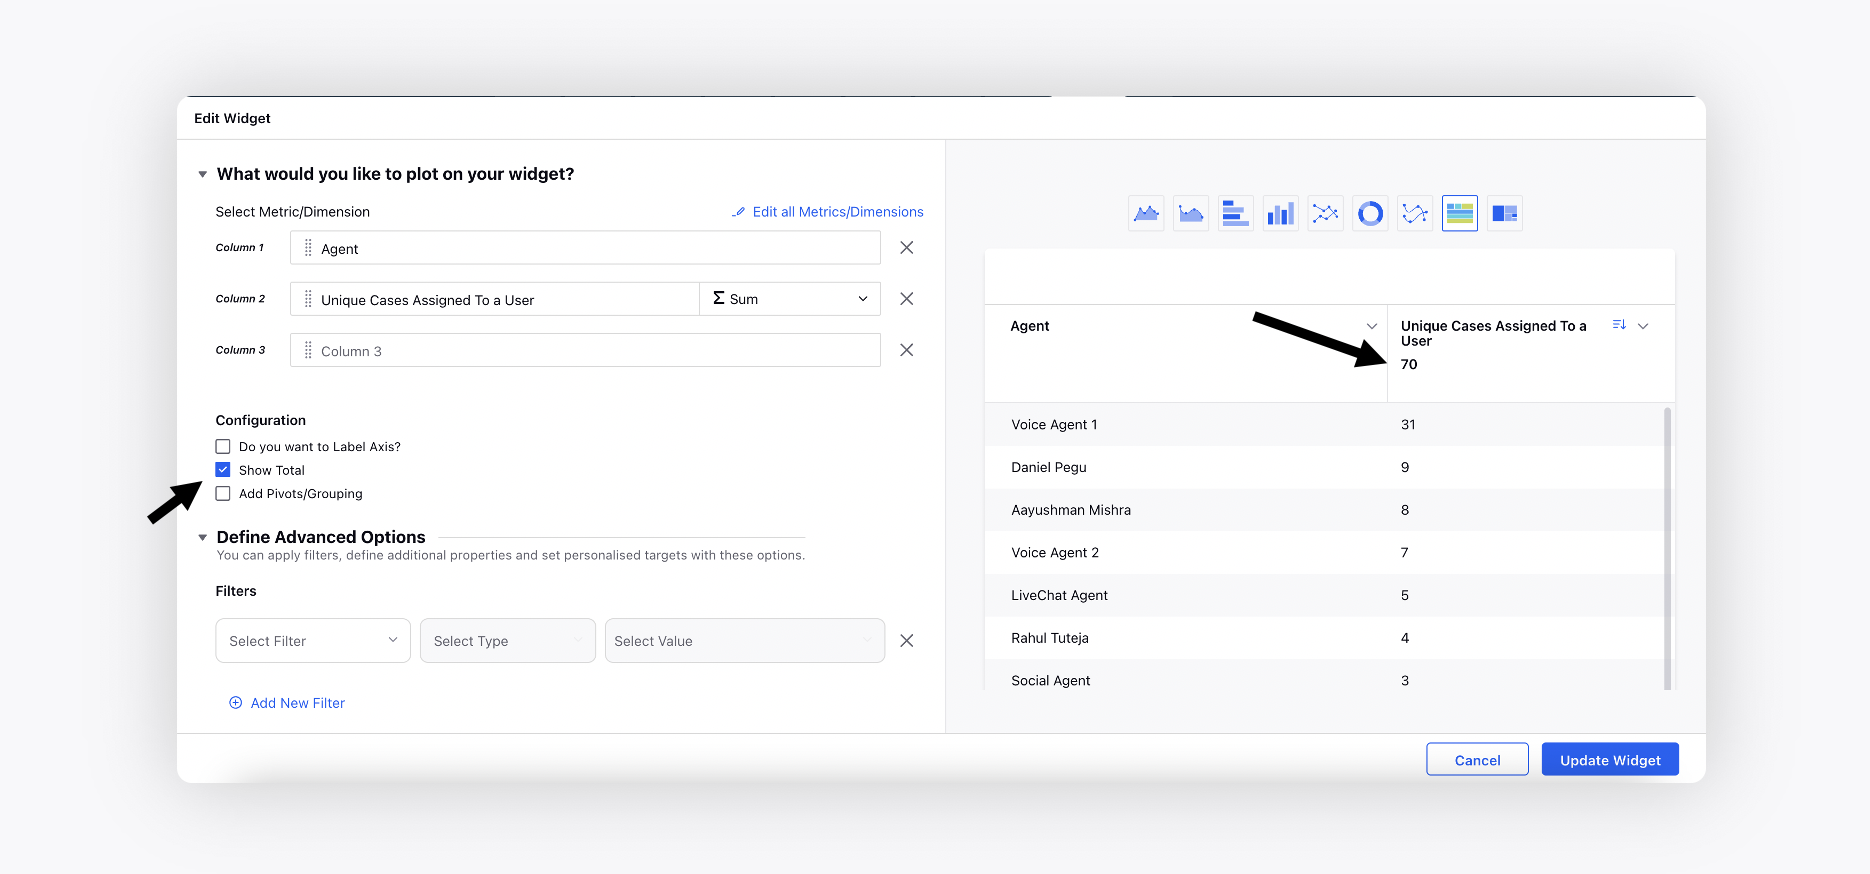
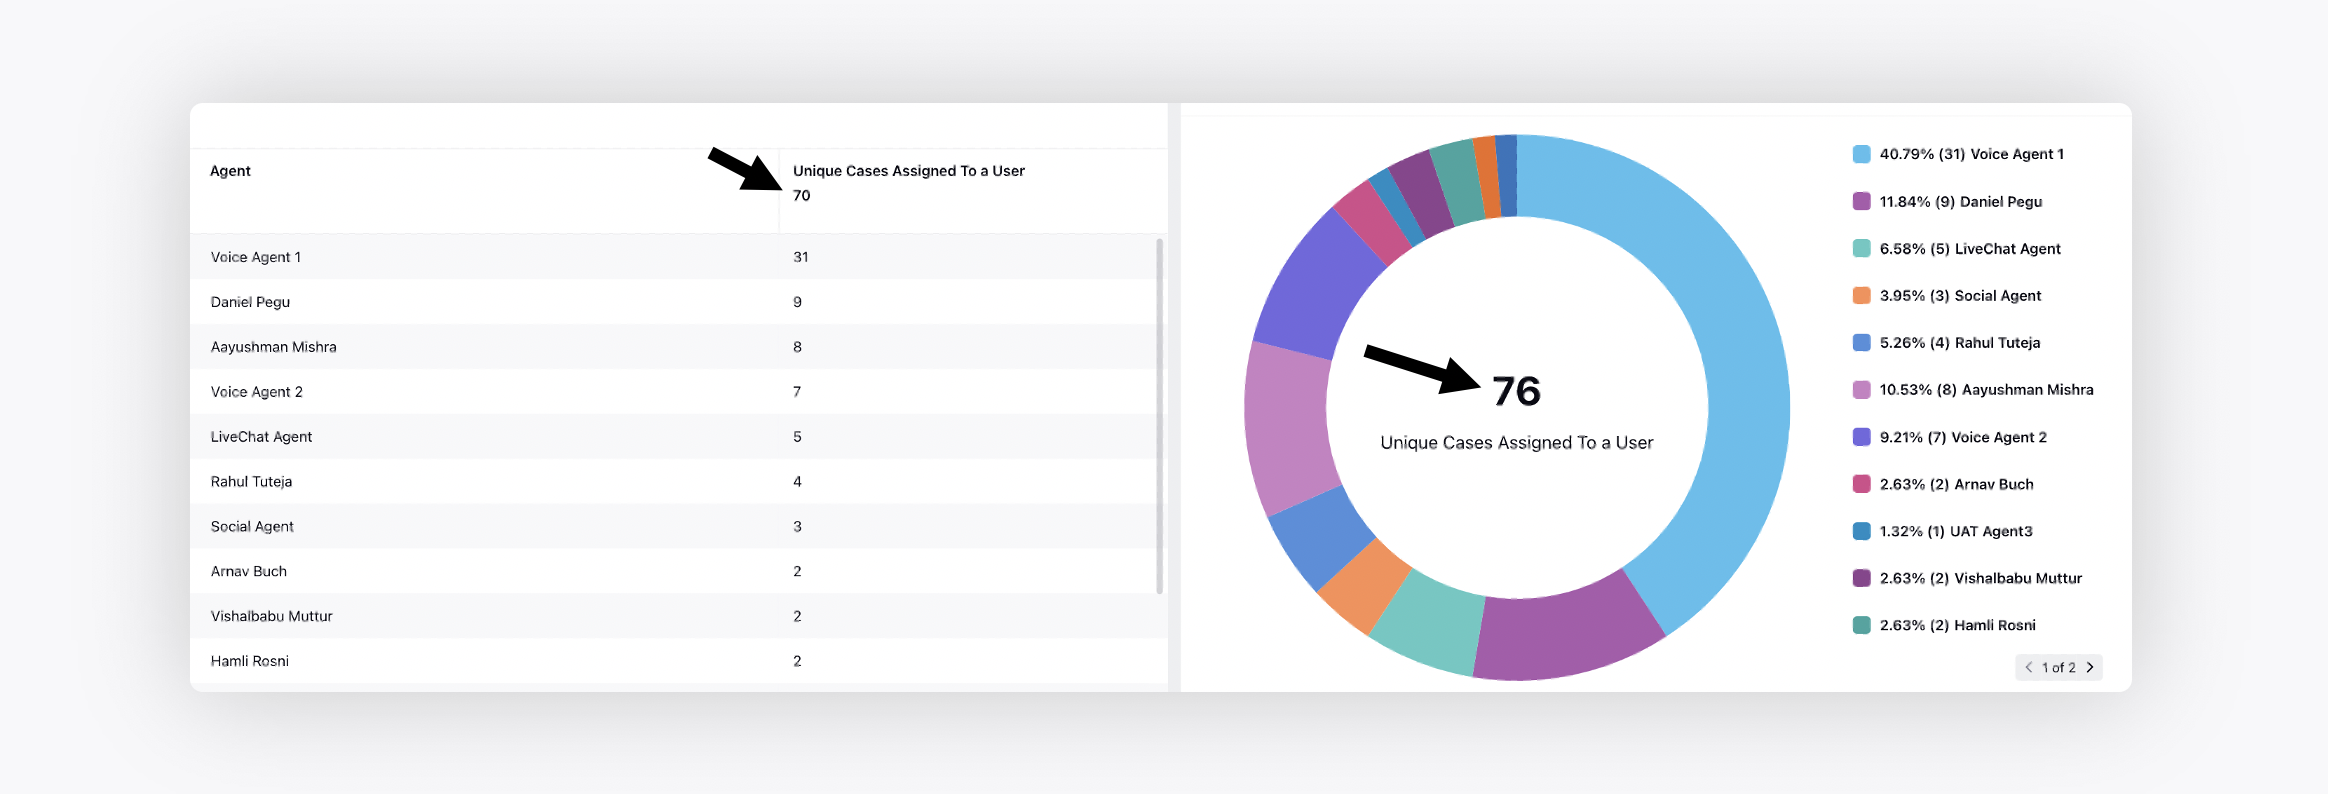
In the widget above, the unique case count is 70, excluding the duplicate cases associated with different agents.
Note: Only the Table visualization is supported to view the unique case count.
In the image below, the Pie Chart widget shows the total case count whereas the Table widget shows the unique case count.