Default Date Filter on Different Reports
Updated
Date Filters are present at the widget level and help you sort the data according to the metric/dimension added in the date filter. It means that cases will populate according to that date filter.
For example, if the case count is plotted with the date filter added in the widget as Case Creation Time and the dashboard duration filter is last 30 days, so count of those cases will populate which were created in the last 30 days.
Example 1
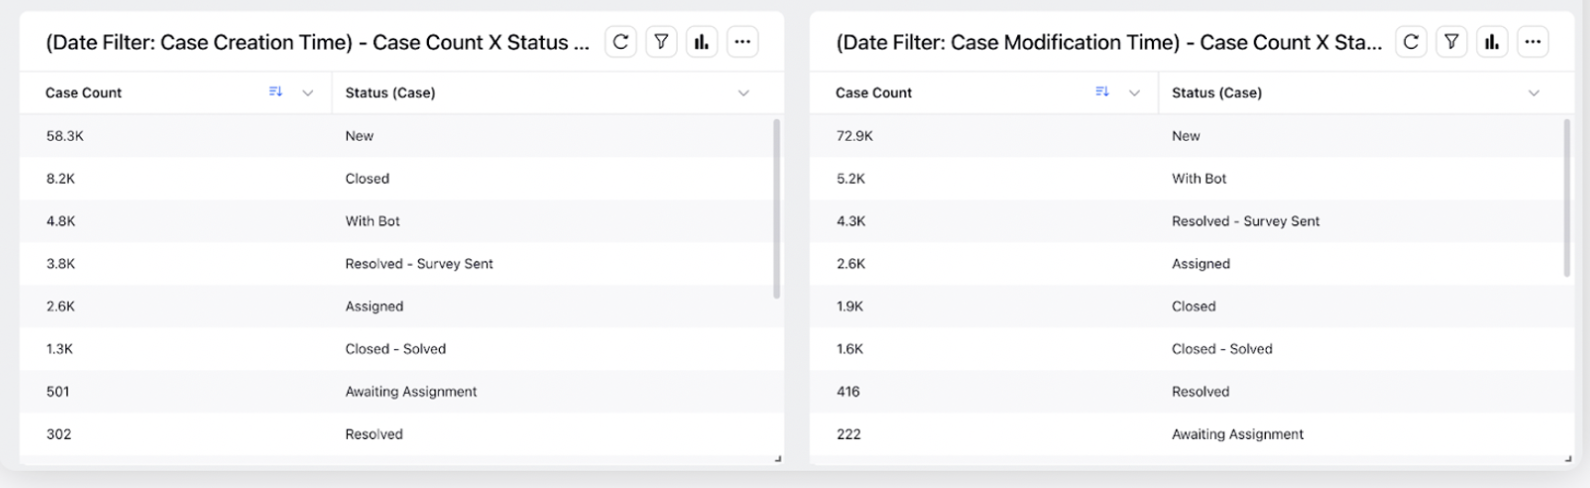
Widget 1: (Date Filter: Case Creation Time) - Case Count X Status (case) | Widget 2: (Date Filter: Case Modification Time) - Case Count X Status (case) |
Date Filter added is Case Creation Time | Date Filter added is Case Modification Time |
Dashboard duration added is Nov 1 | Dashboard duration added is Nov 1 |
It shows 58.3k cases with status (case) as new | It shows 72.9k cases with status (case) as new |
This shows the number of cases that were created on 1 Nov and their status (case) value as the date filter added is case creation time so case creation time = duration set in the dashboard | This shows the number of cases that were modified and marked as new on 1 Nov as the date filter added is case modification time so case modification time will be as per the duration set in the dashboard level filter |
Note: If you don't add any date filter in the widget, it will work on the default date filter for this report, which is case creation time and the data will populate according to that.
Example 2
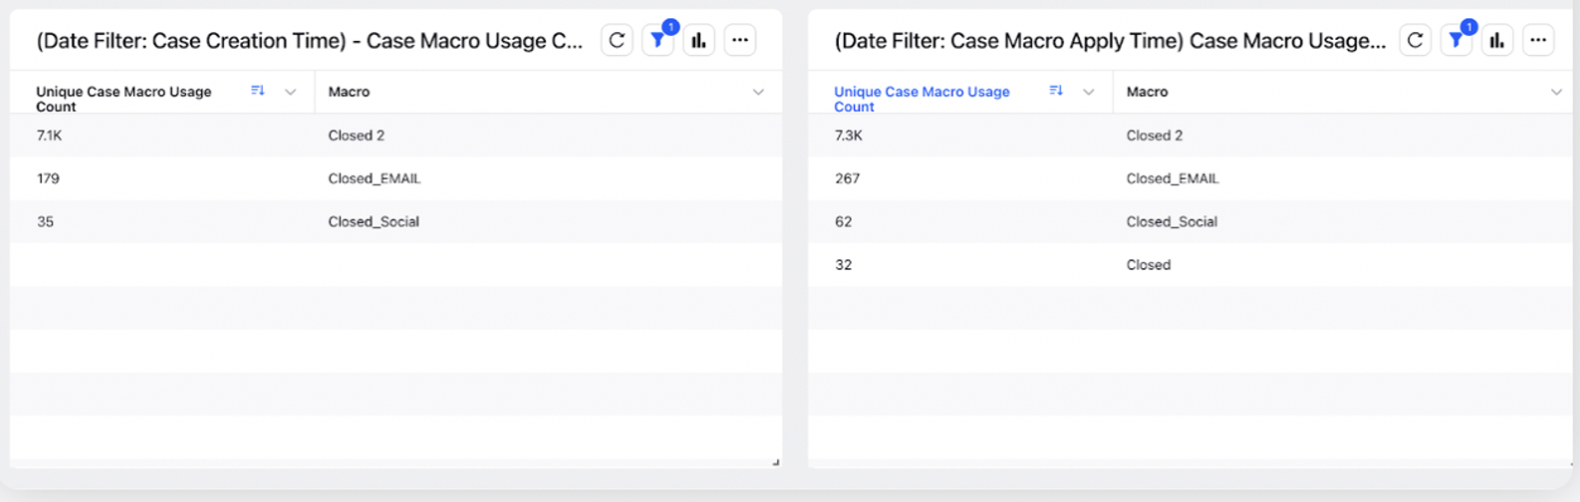
Widget 1: (Date Filter: Case Creation Time) - Case macro usage count X Macro | Widget 2: (Date Filter: Case Macro Apply Time) - Case macro usage count X Macro |
Date Filter added is Case Creation Time | Date Filter added is Case Macro Apply Time |
Dashboard duration added is Nov 1 | Dashboard duration added is Nov 1 |
Shows the number of cases which were created on Nov 1 but macro applied closed - anytime irrespective of the dashboard duration set | Shows the number of cases where macro containing closed was applied on Nov 1 as set in dashboard filter because date filter added was case macro apply time |
This is because widget works on date filter added and here case creation time of cases = duration set in dashboard (1 Nov in this case) | This is because widget works on date filter added and here case macro apply time of cases = duration set in dashboard (1 Nov in this case) |
To apply Date Filter in a reporting widget
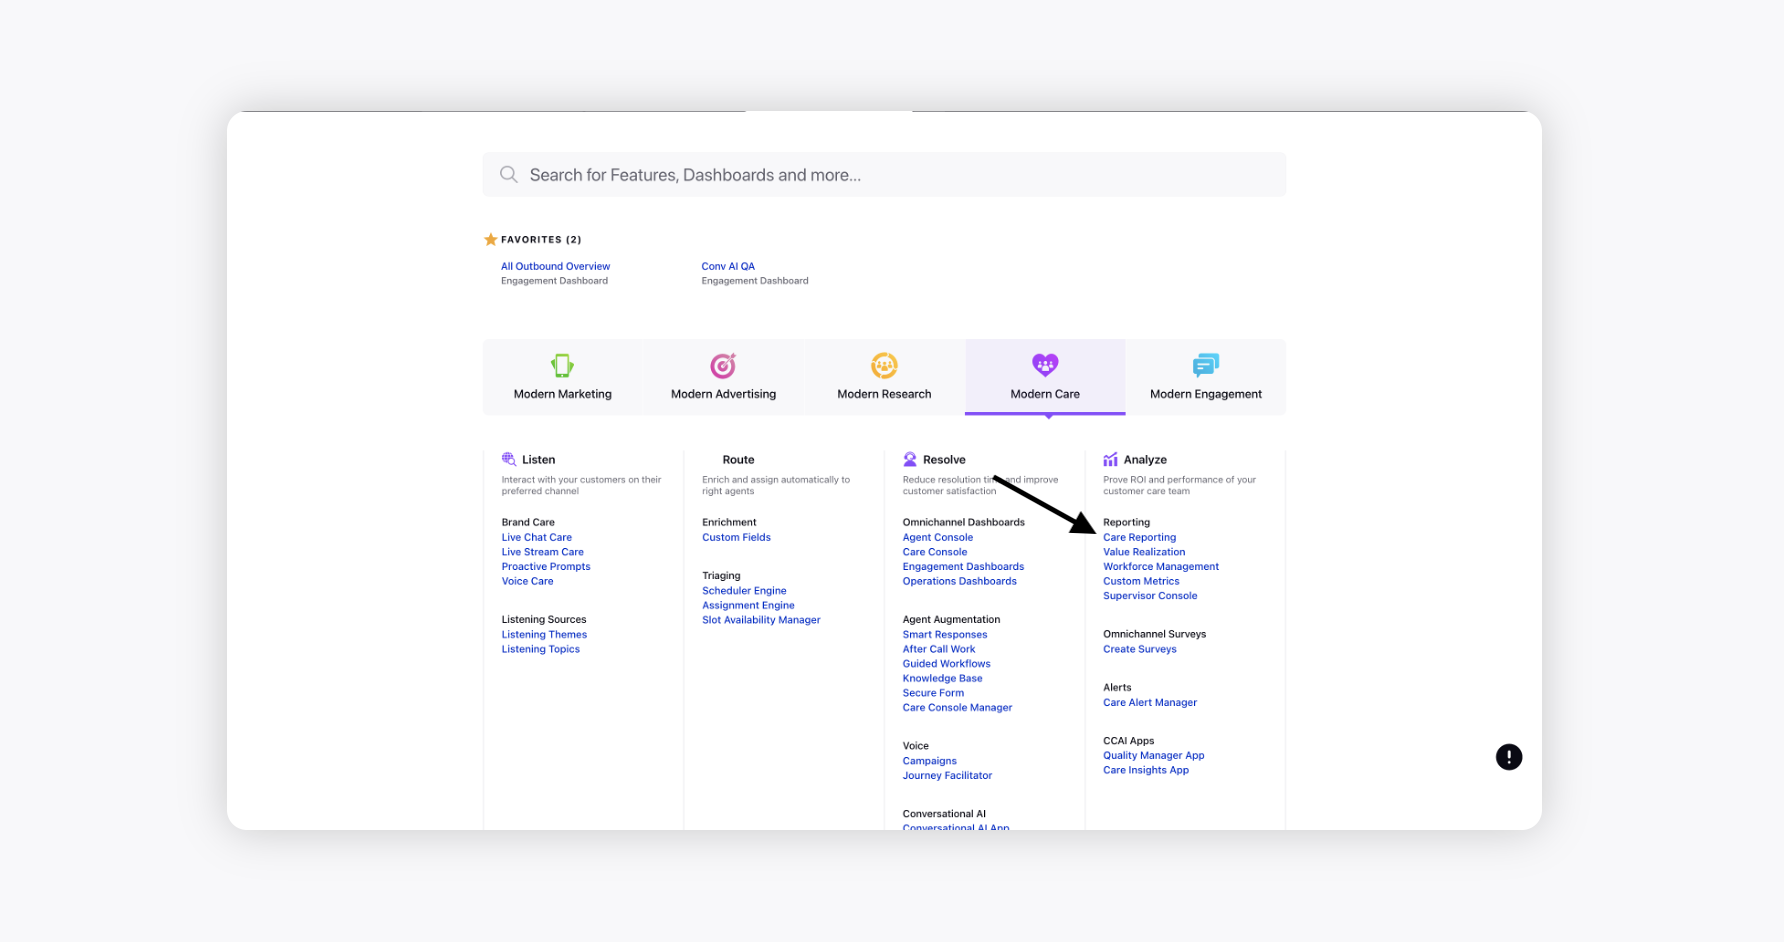
Click the New Tab icon. Under the Sprinklr Service tab, click Care Reporting within Analyze.
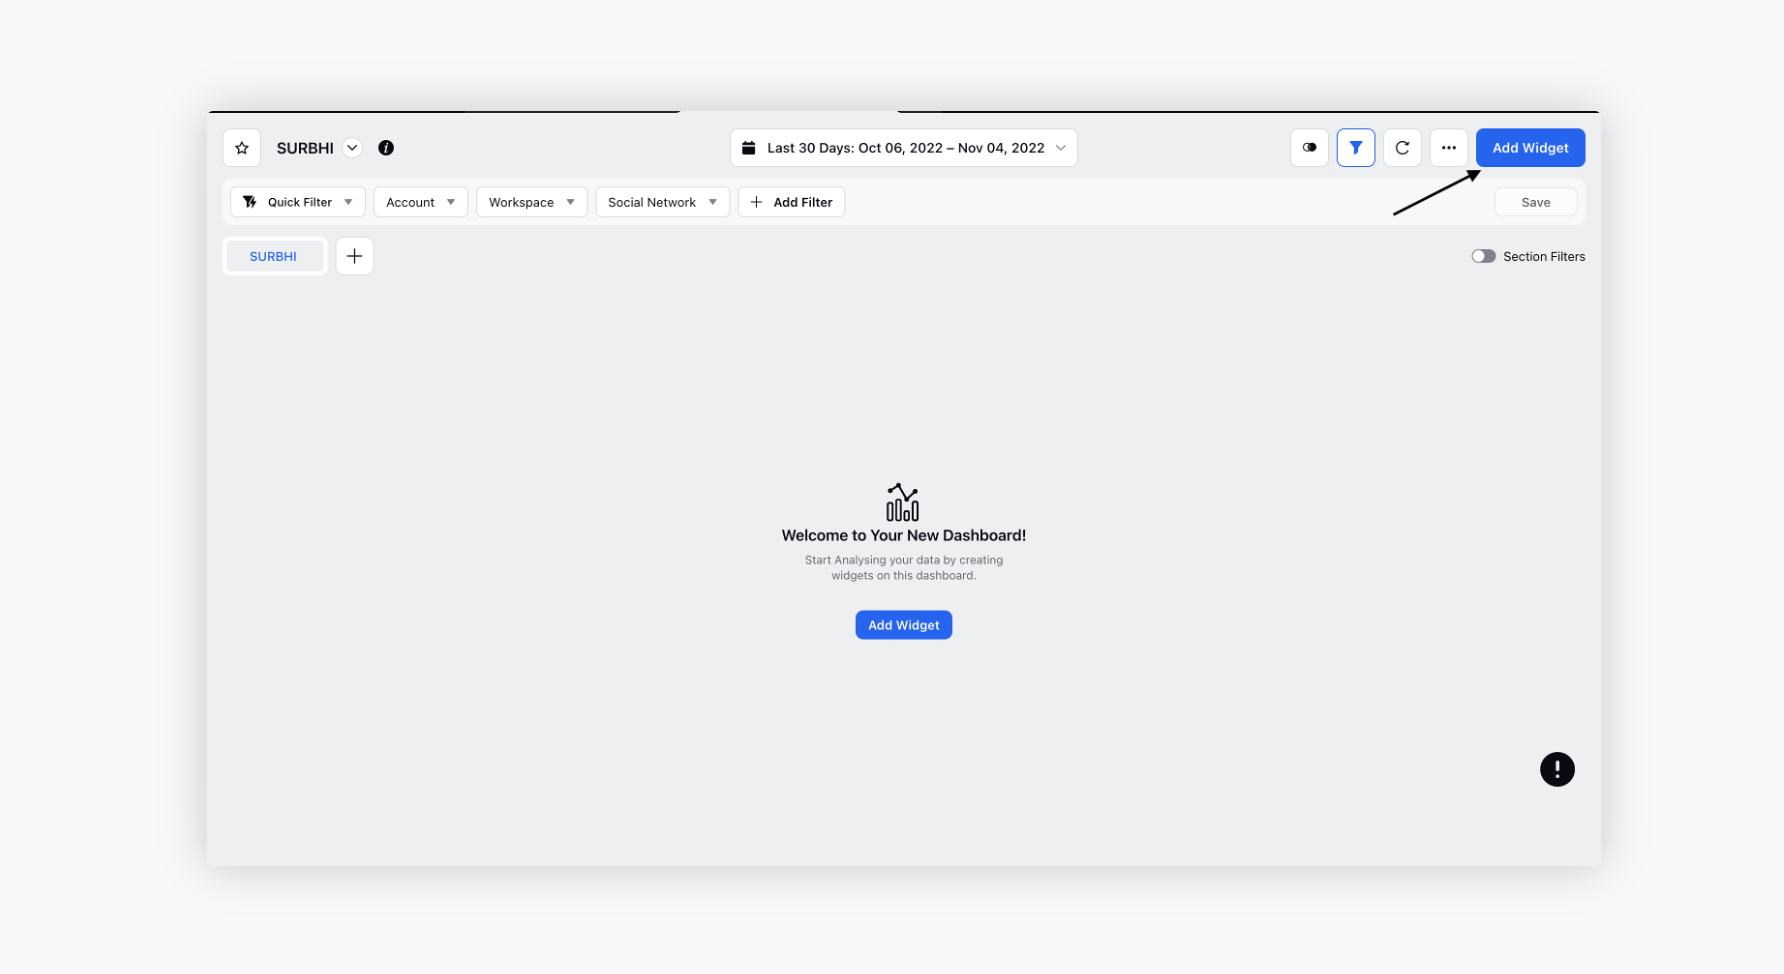
You can find the existing dashboards here.
On the selected dashboard, click Add Widget in the top right corner.
Create a widget and within the What would you like to plot on your widget section, select the desired dimensions and metrics to view the reporting.
Now, scroll down to the Date Filter section at the bottom left.
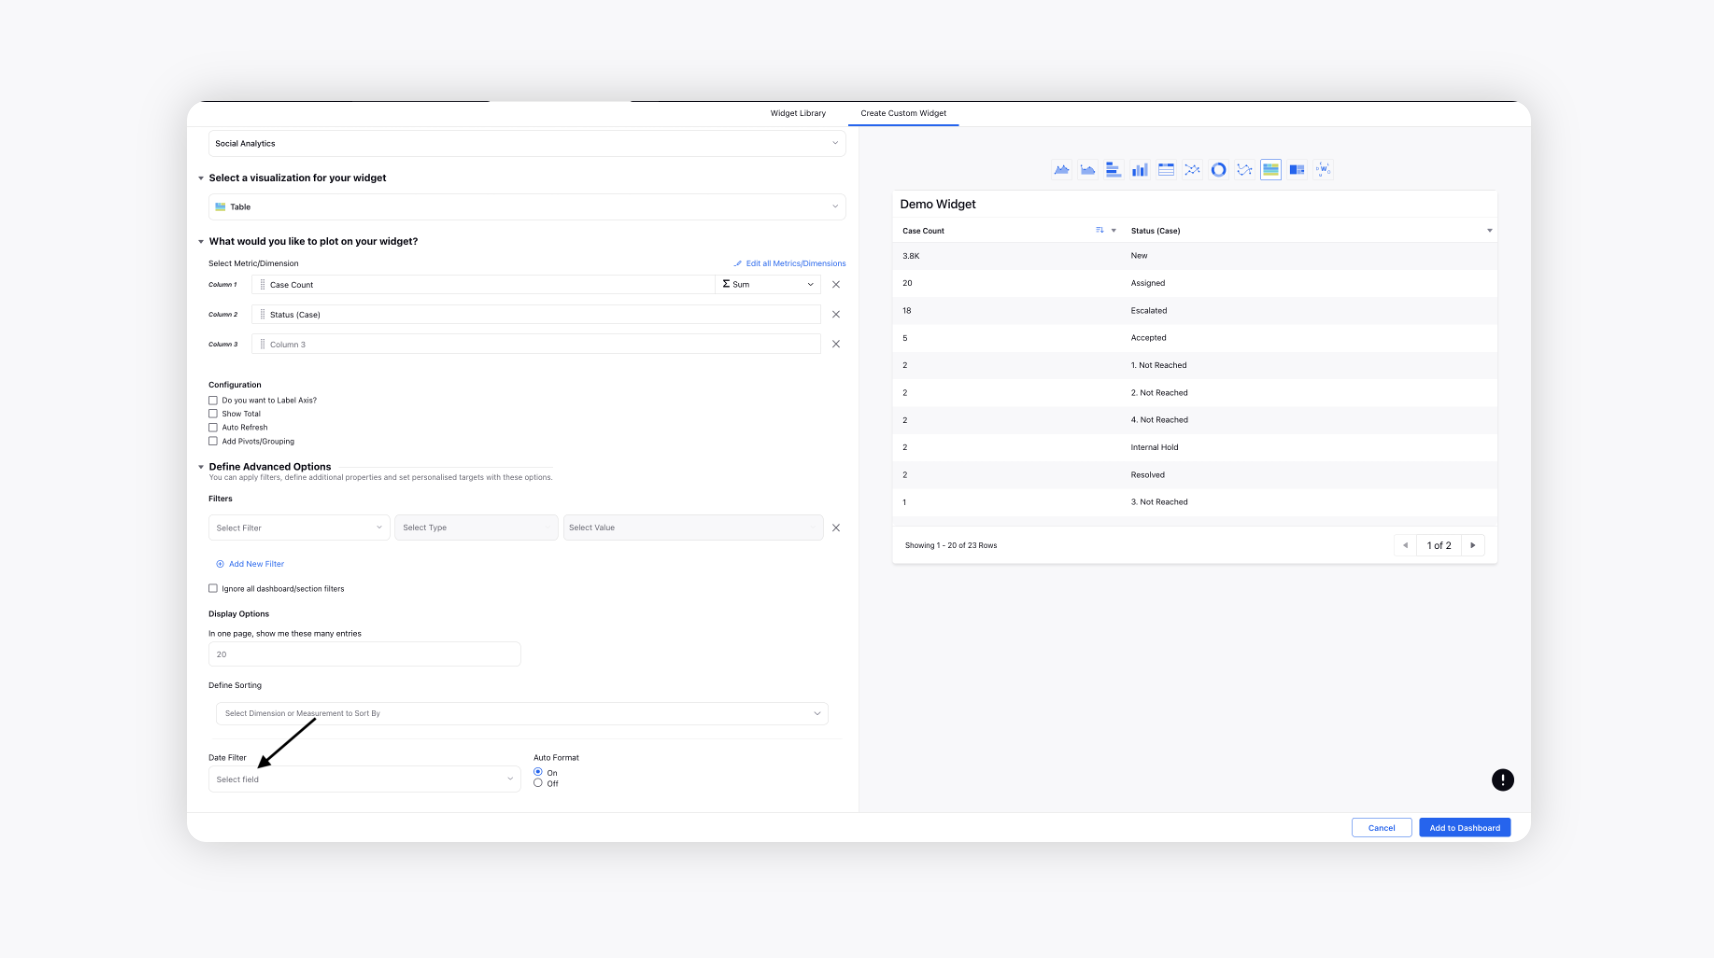
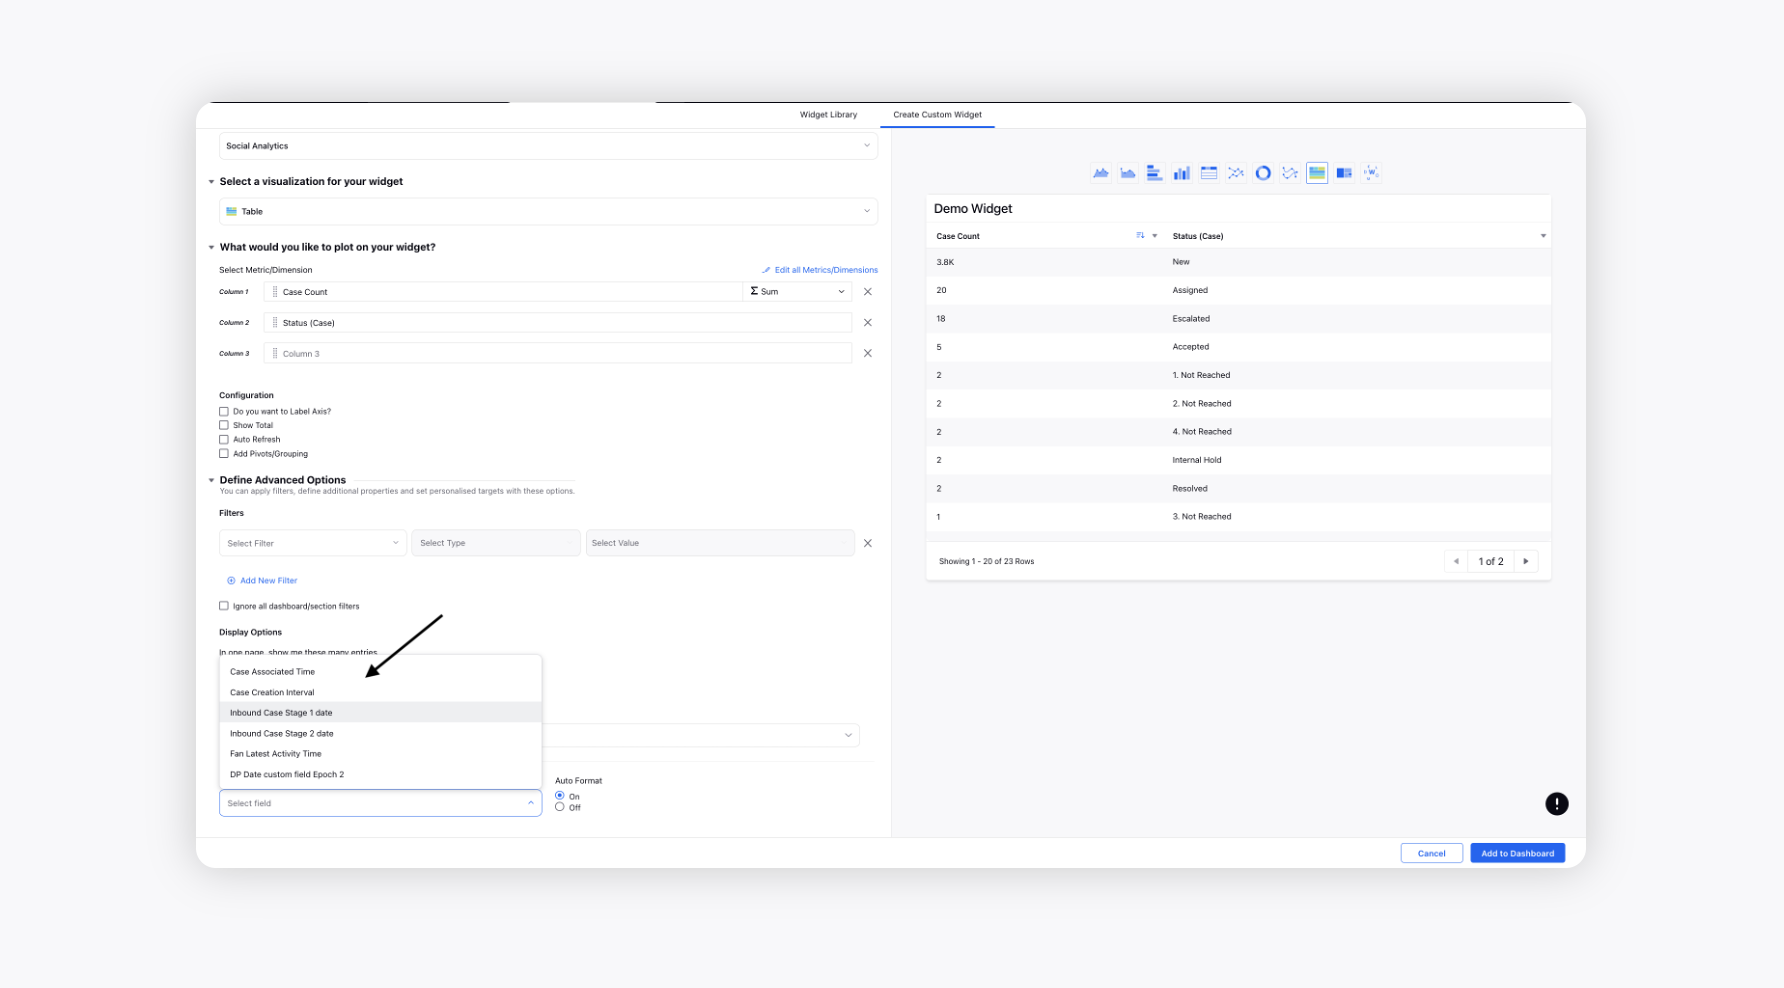
Select the Date Filter as per the requirement and update the widget. Different Date Filters are available for a metric. The available date filter usually indicates the different instances (point of time) a snapshot of that data was saved in the backend.
For example - Case Count has two date filters available - Case Creation Interval and Associated Message Creation Time. Case Creation Interval is the time when a case was created within Sprinklr, while Associated Message Creation Time is the time when the associated message (on which the case was created) was created within Sprinklr.
Click Add to Dashboard in the bottom right corner to add your widget to the dashboard.
Once a widget is added, you can view the date filters applied at the widget level in both enterprise and persona reporting. Once a widget is locked, the date filters become visible when hovering over the filter icon at the widget level.
This enhancement provides users and brands with clear insight into the date filters used in their reports, helping them better understand the context of the data being displayed.
.png)
Points to Remember
|
List of Default Date Filters
Use Case | Metric/Dimension | Use With Dimention | Available Date Filters | Default Date Filter |
Case Count | Case Count | Case CF such as Status, Priority, All Engaged Users (case), Last Engaged User etc | Case Creation Interval, Case Creation Time, Case Modification Time | Case Creation Time |
Handle Time | Case Processing SLA | Agent | Case | Date | Date (Works on Case Processing Clock Start Time) |
First Response Time | Case first Brand Response SLA/ Case First User Response SLA | Brand Response by User, Case | Date, ActionTime(Group by) | Case Creation Time |
Response Time | Case Brand Response SLA/Case User Response SLA | Brand Response by User, Case | Date, ActionTime(Group by) | Case Creation Time |
Time Spent by a Case in Queue | Case Queue SLA | Case, Case Queue | Date, ActionTime(Group by) | Case Creation Time |
Time Take to apply macro from case Creation | Case Macro SLA | Agent, Case | Date, Macro Apply time | Macro Apply Time |
Time Spent in different Status | Time in Status | Agent, Availablity Status | Date, Status Assign Time, Status Remove Time | Date (Works on Status Change Time) |
Time Spent in Login | Time in Login Status | Agent, Login Status = Logged in | Date, Status Assign Time, Status Login Remove Time | Date (Works on Status Change Time) |
Number of Response by a User | Count (Case SLA) | Brand Response by User, Case Filter: Action Type- Brand Response & Ignore Multiple Queue Records = True | Date, ActionTime(Group by) | Case Creation Time |
Total Macro Usage Count | Case Macro Usage Count | Agent | Case | Date, Macro Apply Time | Macro Apply Time |
Count of Unique Cases on which Macro is applied. | Unique Case Macro Usage Count | Agent | Case | Date, Macro Apply Time | Macro Apply Time |
Cases Handled by Agent (Note: Definintion Varies Customer to Customer) | Case Count | All Engaged User (Case), Case CF | Case Creation Interval, Case Creation Time | Case Creation Time |
Current Assignment of Agent | Case Count | Assigned to User, Case CF | Live Metric | Case Creation Time |
Survey Response Count | Survey Response Count | Survey, Survey Customer, Survey Answer, Survey Channel | Survey Response Date, Survey Sent Date | Survey Response Date |
Survey Sent Count | Survey Sent Count | Survey, Survey Customer, Survey Answer, Survey Channel | Survey Response Date, Survey Sent Date | Survey Sent Date |