Standard Metrics Configuration
Updated
Sprinklr Service Reporting allows you to customize the definitions of Sprinklr’s standard service metrics for frequently used contact center key performance indicators (KPIs), such as Average Handle Time (AHT) and Service Level. This is done using Standard Metrics, which stores the definitions of frequently used, industry-standard KPIs. For example, the definition of AHT can be customized to include the sum of any combination of Ring Time, Talk Time, Hold Time, Preview Time, ACW Time, and Customer Dial Time.
Note: Modifying Standard Metrics updates the definitions for all Reporting Dashboards in the Workspace.
Standard Metrics are workspace-dependent, allowing you to customize different values for the same KPI across multiple workspaces within the same customer environment.
Note: The Standard Metrics feature is currently available only for the Service Analytics Data Source.
Note: The Standard Metrics feature is Dynamic Property (DP) controlled. Contact your Success Manager or raise a support ticket at tickets@sprinklr.com to enable it for your environment.
Note: In order to access service settings, you would also need access to Reporting Settings, under Feature Settings.
This allows for greater flexibility and precision in performance measurement, ensuring that Standard Metrics align perfectly with your unique business needs and objectives without creating multiple Custom Metrics.
This article outlines the steps for managing Standard Metrics, including:
View Standard Metrics
Editing Standard Metrics
View the Activity Log
Available Parameters for Customization in Standard Metrics.
View Standard Metrics
Note: You must have the View permission under the Service Reporting Configuration Screen section in the Reporting module. Refer to Manage Roles for managing permissions.
Follow these steps to view the current definition of the Standard Metrics:

Go to Care Reporting in the Analyze column on the Launchpad. This will open the Reporting Dashboards Record Manager.
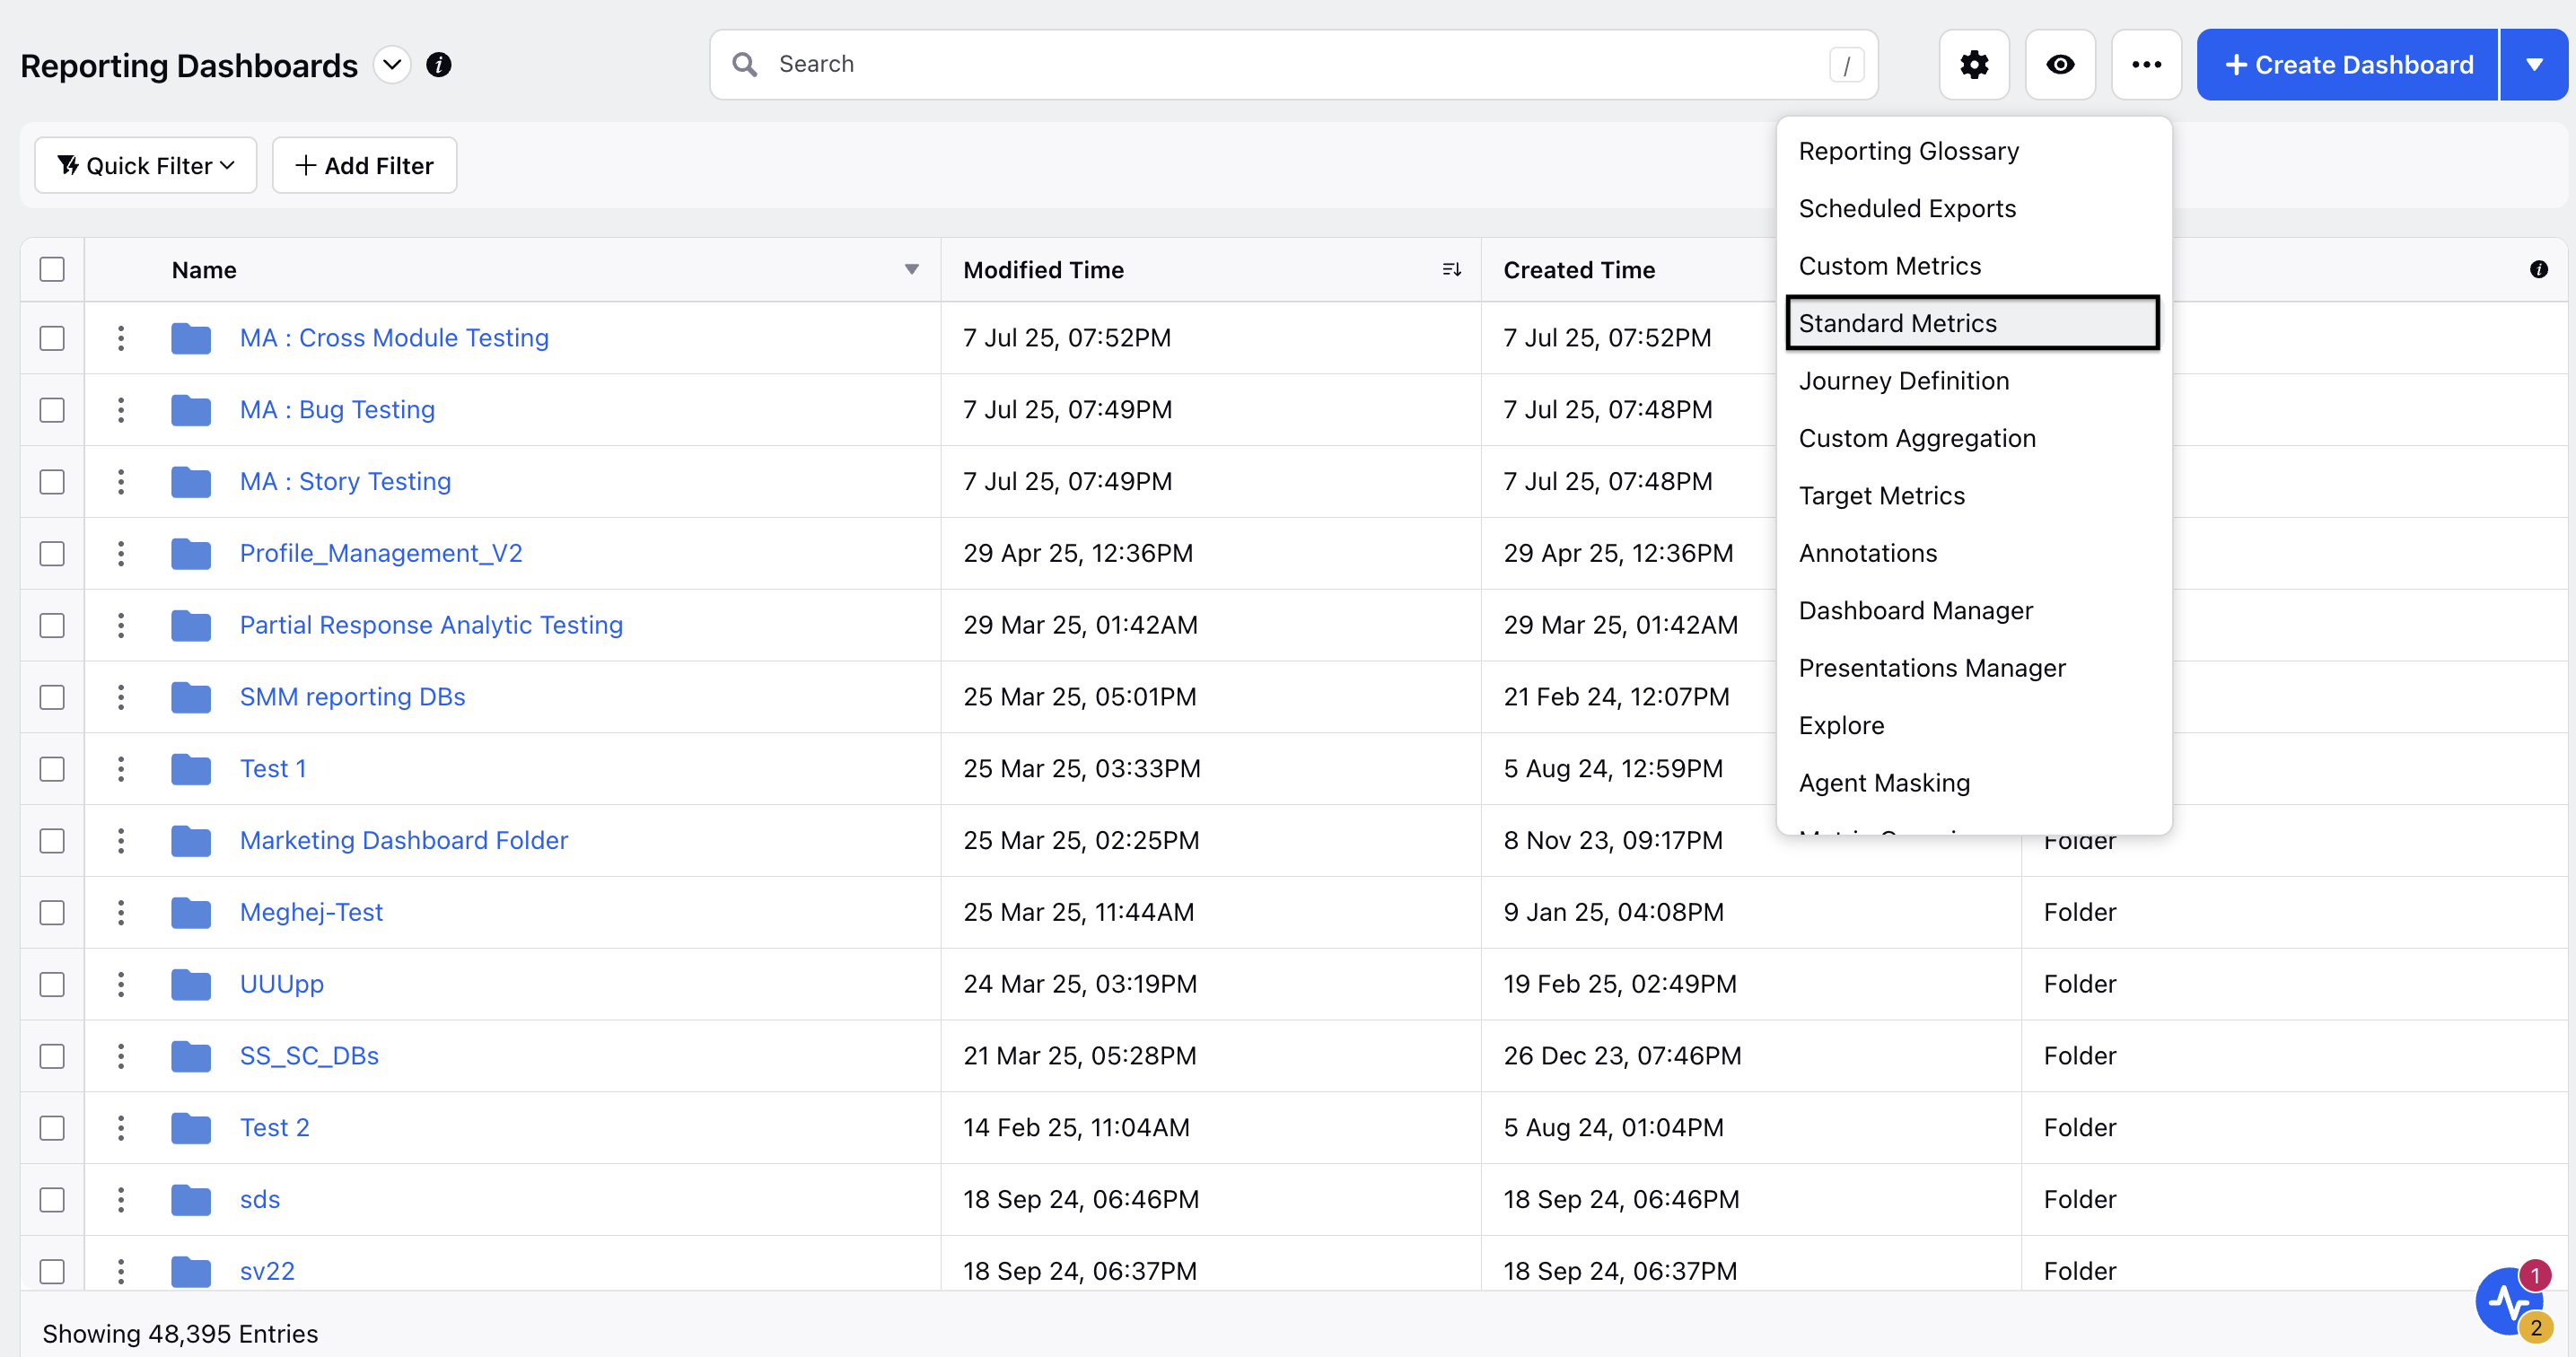
Click the Settings button at the top of the page to show a list of options.
Select Standard Metrics from this list to open the Standard Metrics Record Manager.
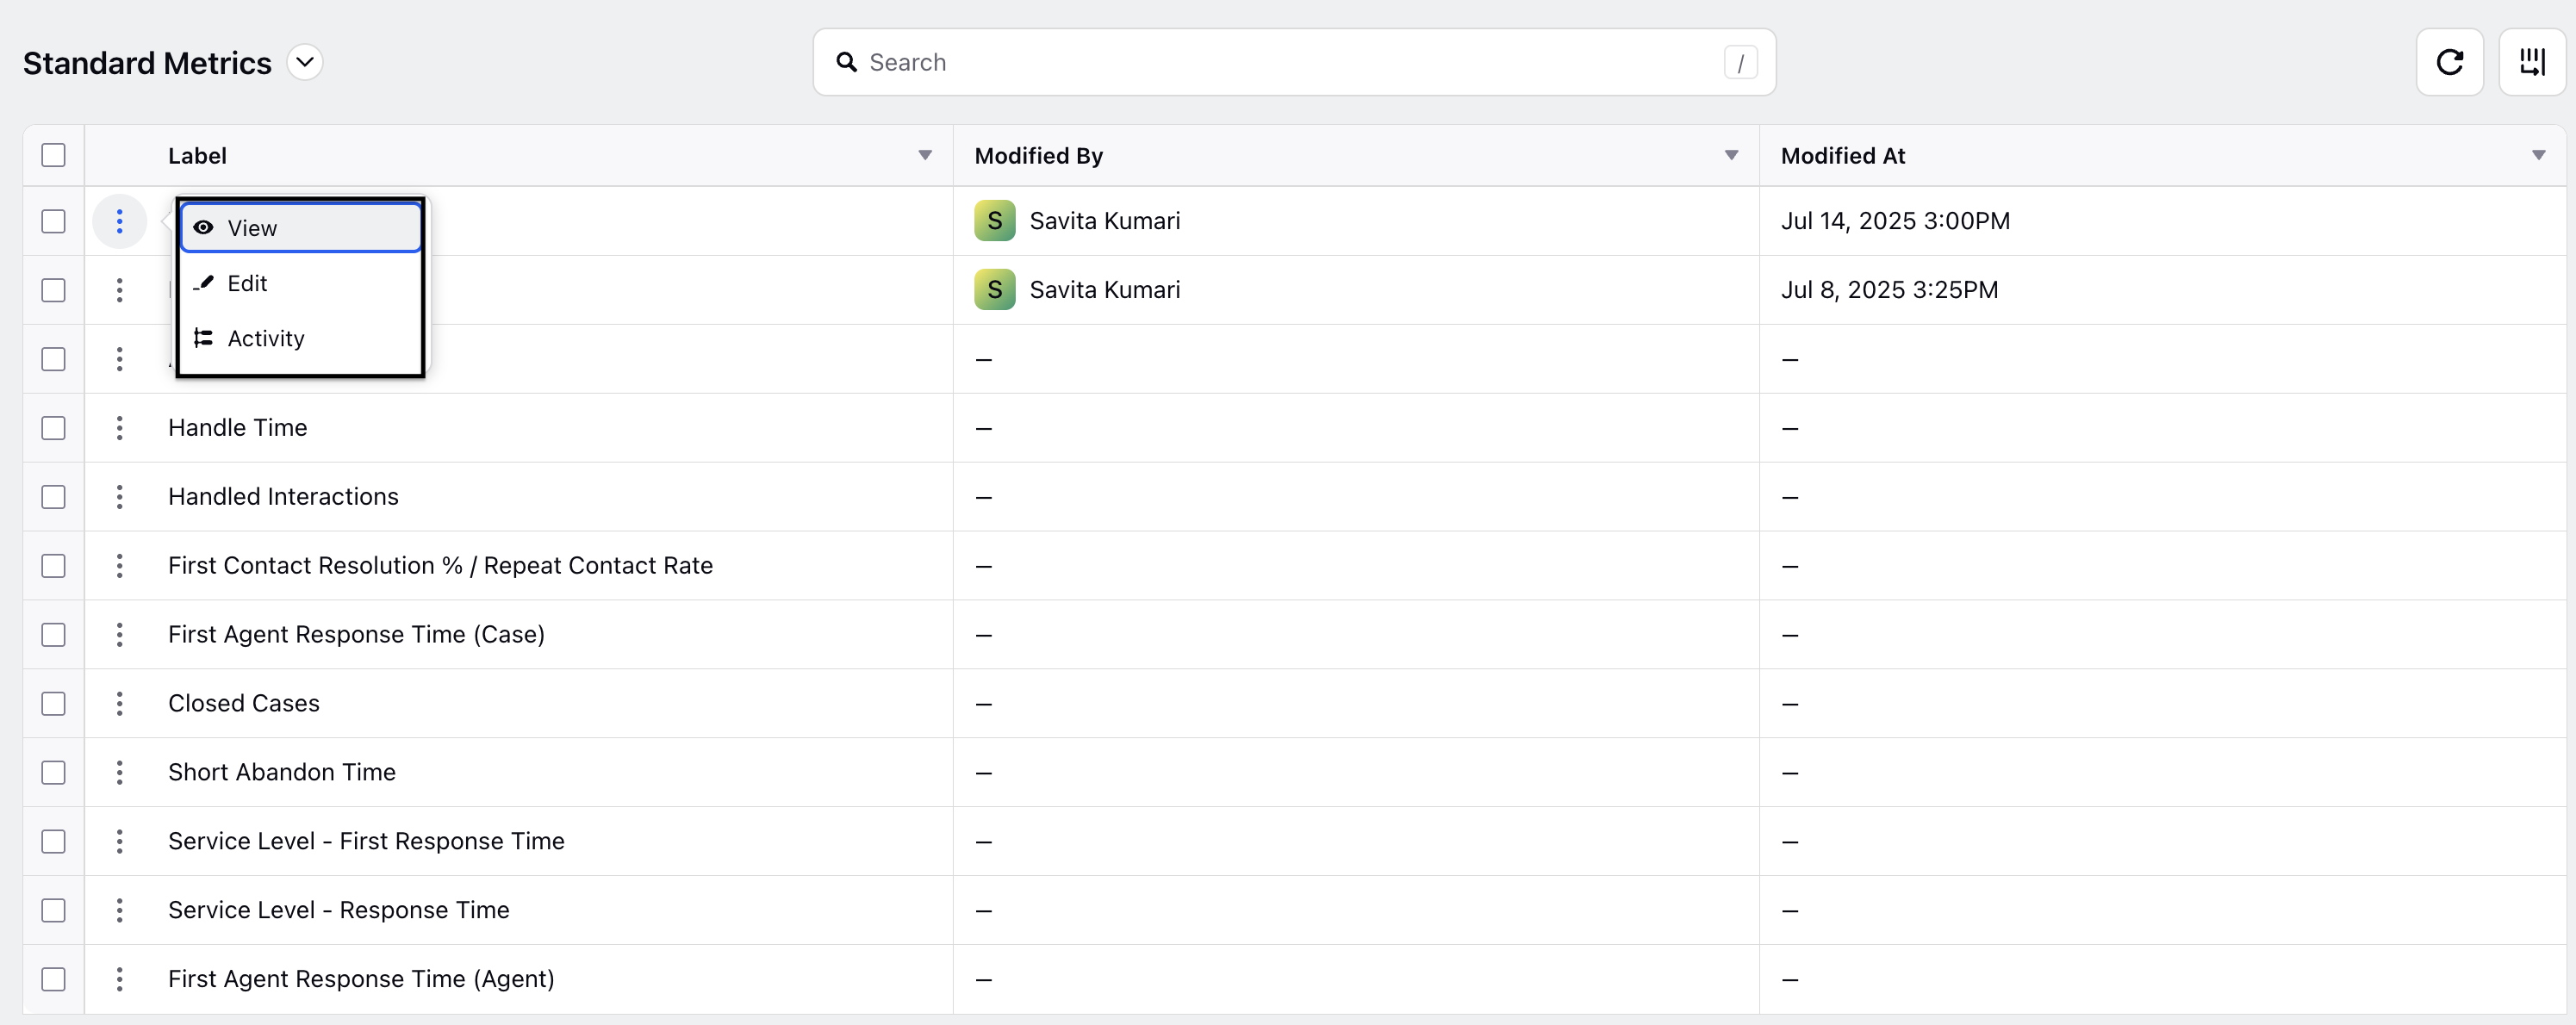
Hover over the vertical ellipsis (⋮) icon corresponding to the Standard Metric whose definition you want to view. This will show a list of options.
Select the View option from the list, which will open the page showing the definition of the selected Standard Metric.
Simultaneously View Multiple Standard Metrics
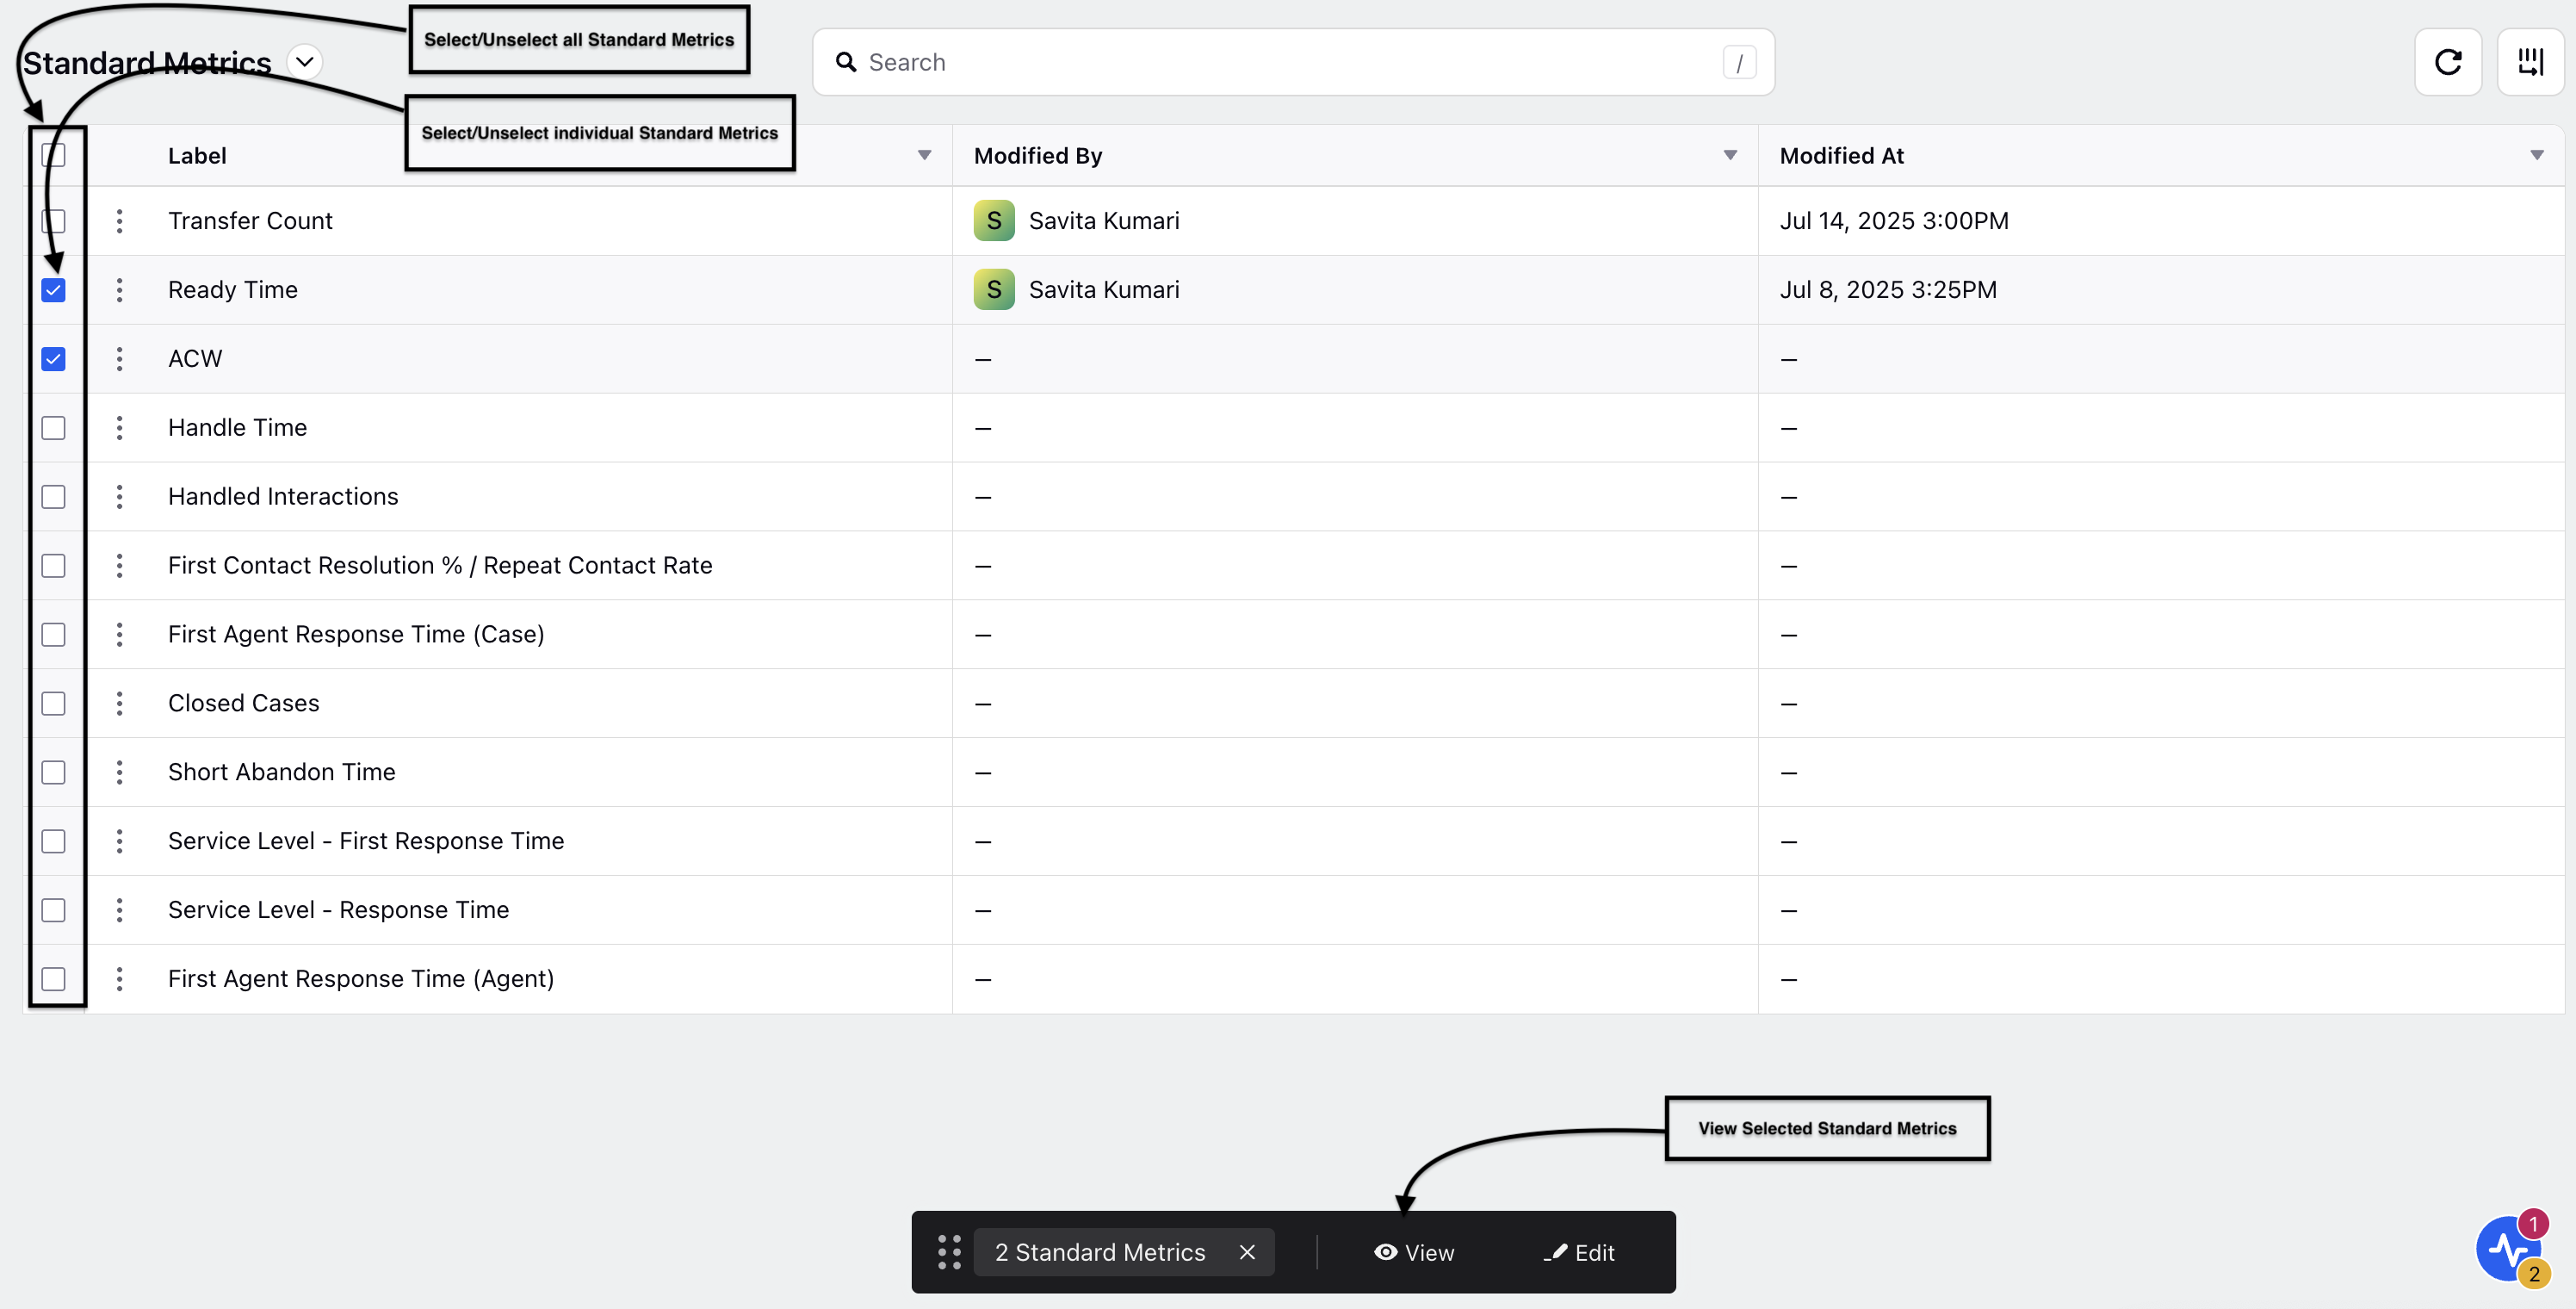
You can also view multiple Standard Metrics simultaneously. To do this, select the desired Standard Metrics and click the View button towards the bottom of the page. This will open the page where you can view the selected Standard Metrics.
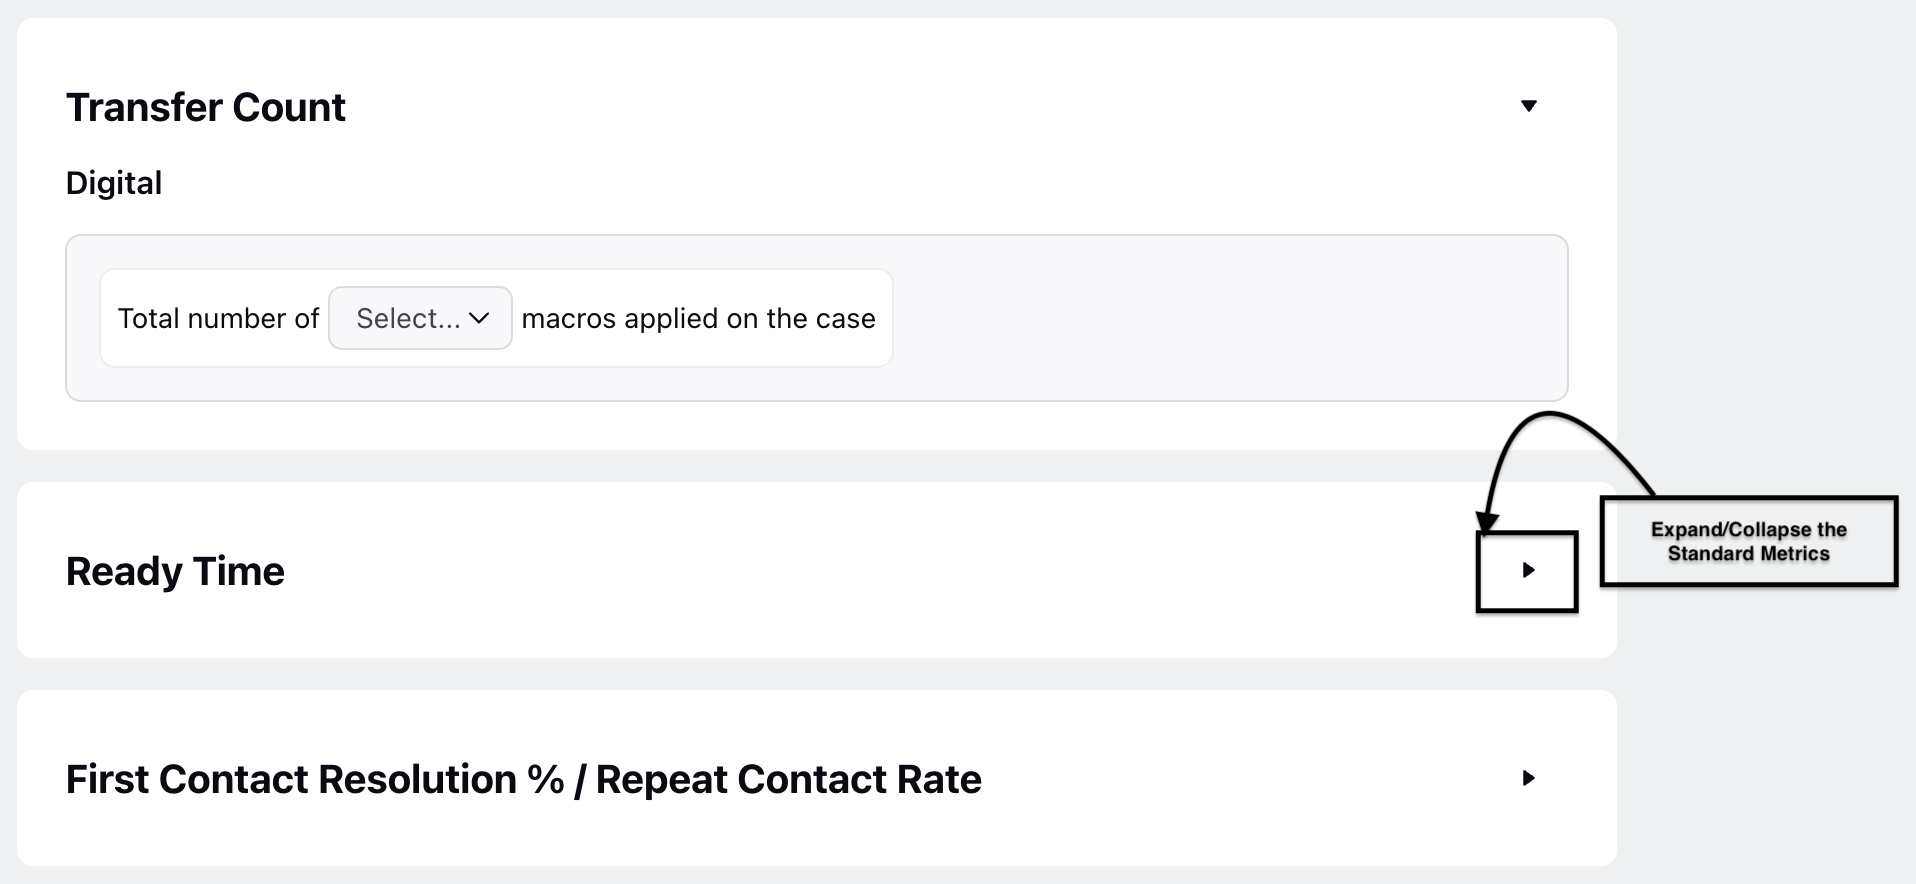
This completes the process of viewing the definition of a Standard Metrics.
Edit Standard Metrics
Note: You must have the View and Edit permissions under the Service Reporting Configuration Screen section in the Reporting module. Refer to Manage Roles for managing permissions.
Follow these steps to customize the definition of the Standard Metrics:

Go to Care Reporting in the Analyze column on the Launchpad. This will open the Reporting Dashboards Record Manager.
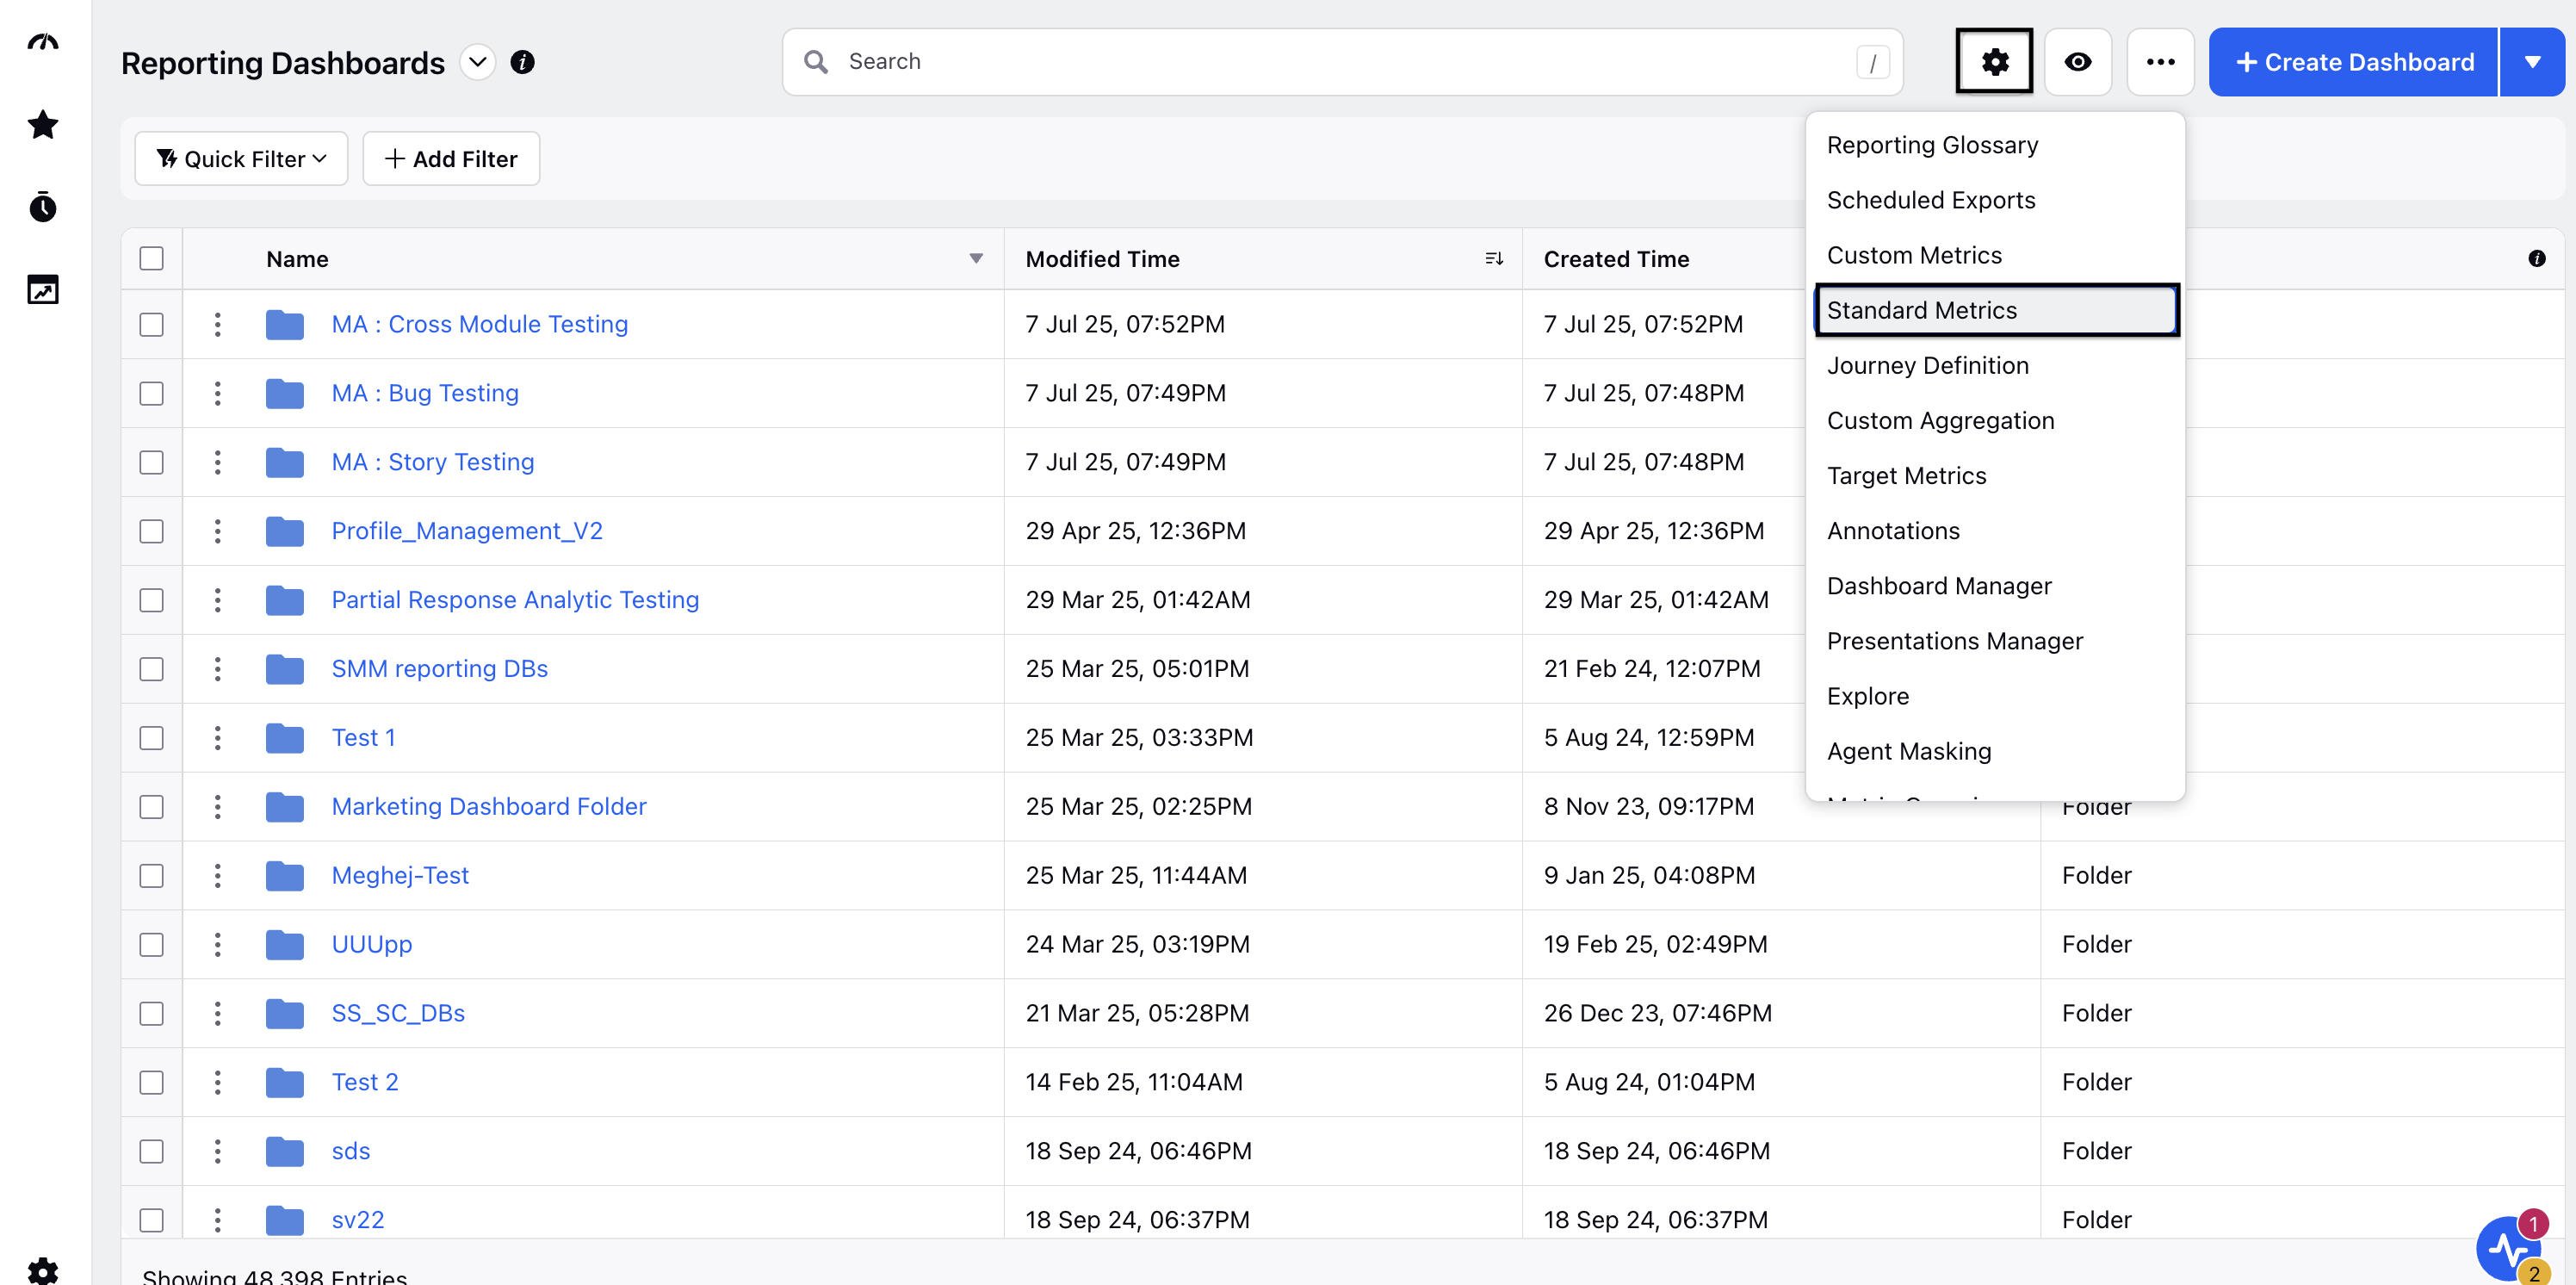
Click the Settings button at the top of the page to show a list of options.
Select Standard Metrics from this list to open the Standard Metrics Record Manager.

Hover over the vertical ellipsis (⋮) icon corresponding to the Standard Metrics whose definition needs to be customized. This will show a list of options.
Select the Edit option from the list to open the customization page. This page allows you to customize the definition of the selected Standard Metrics.
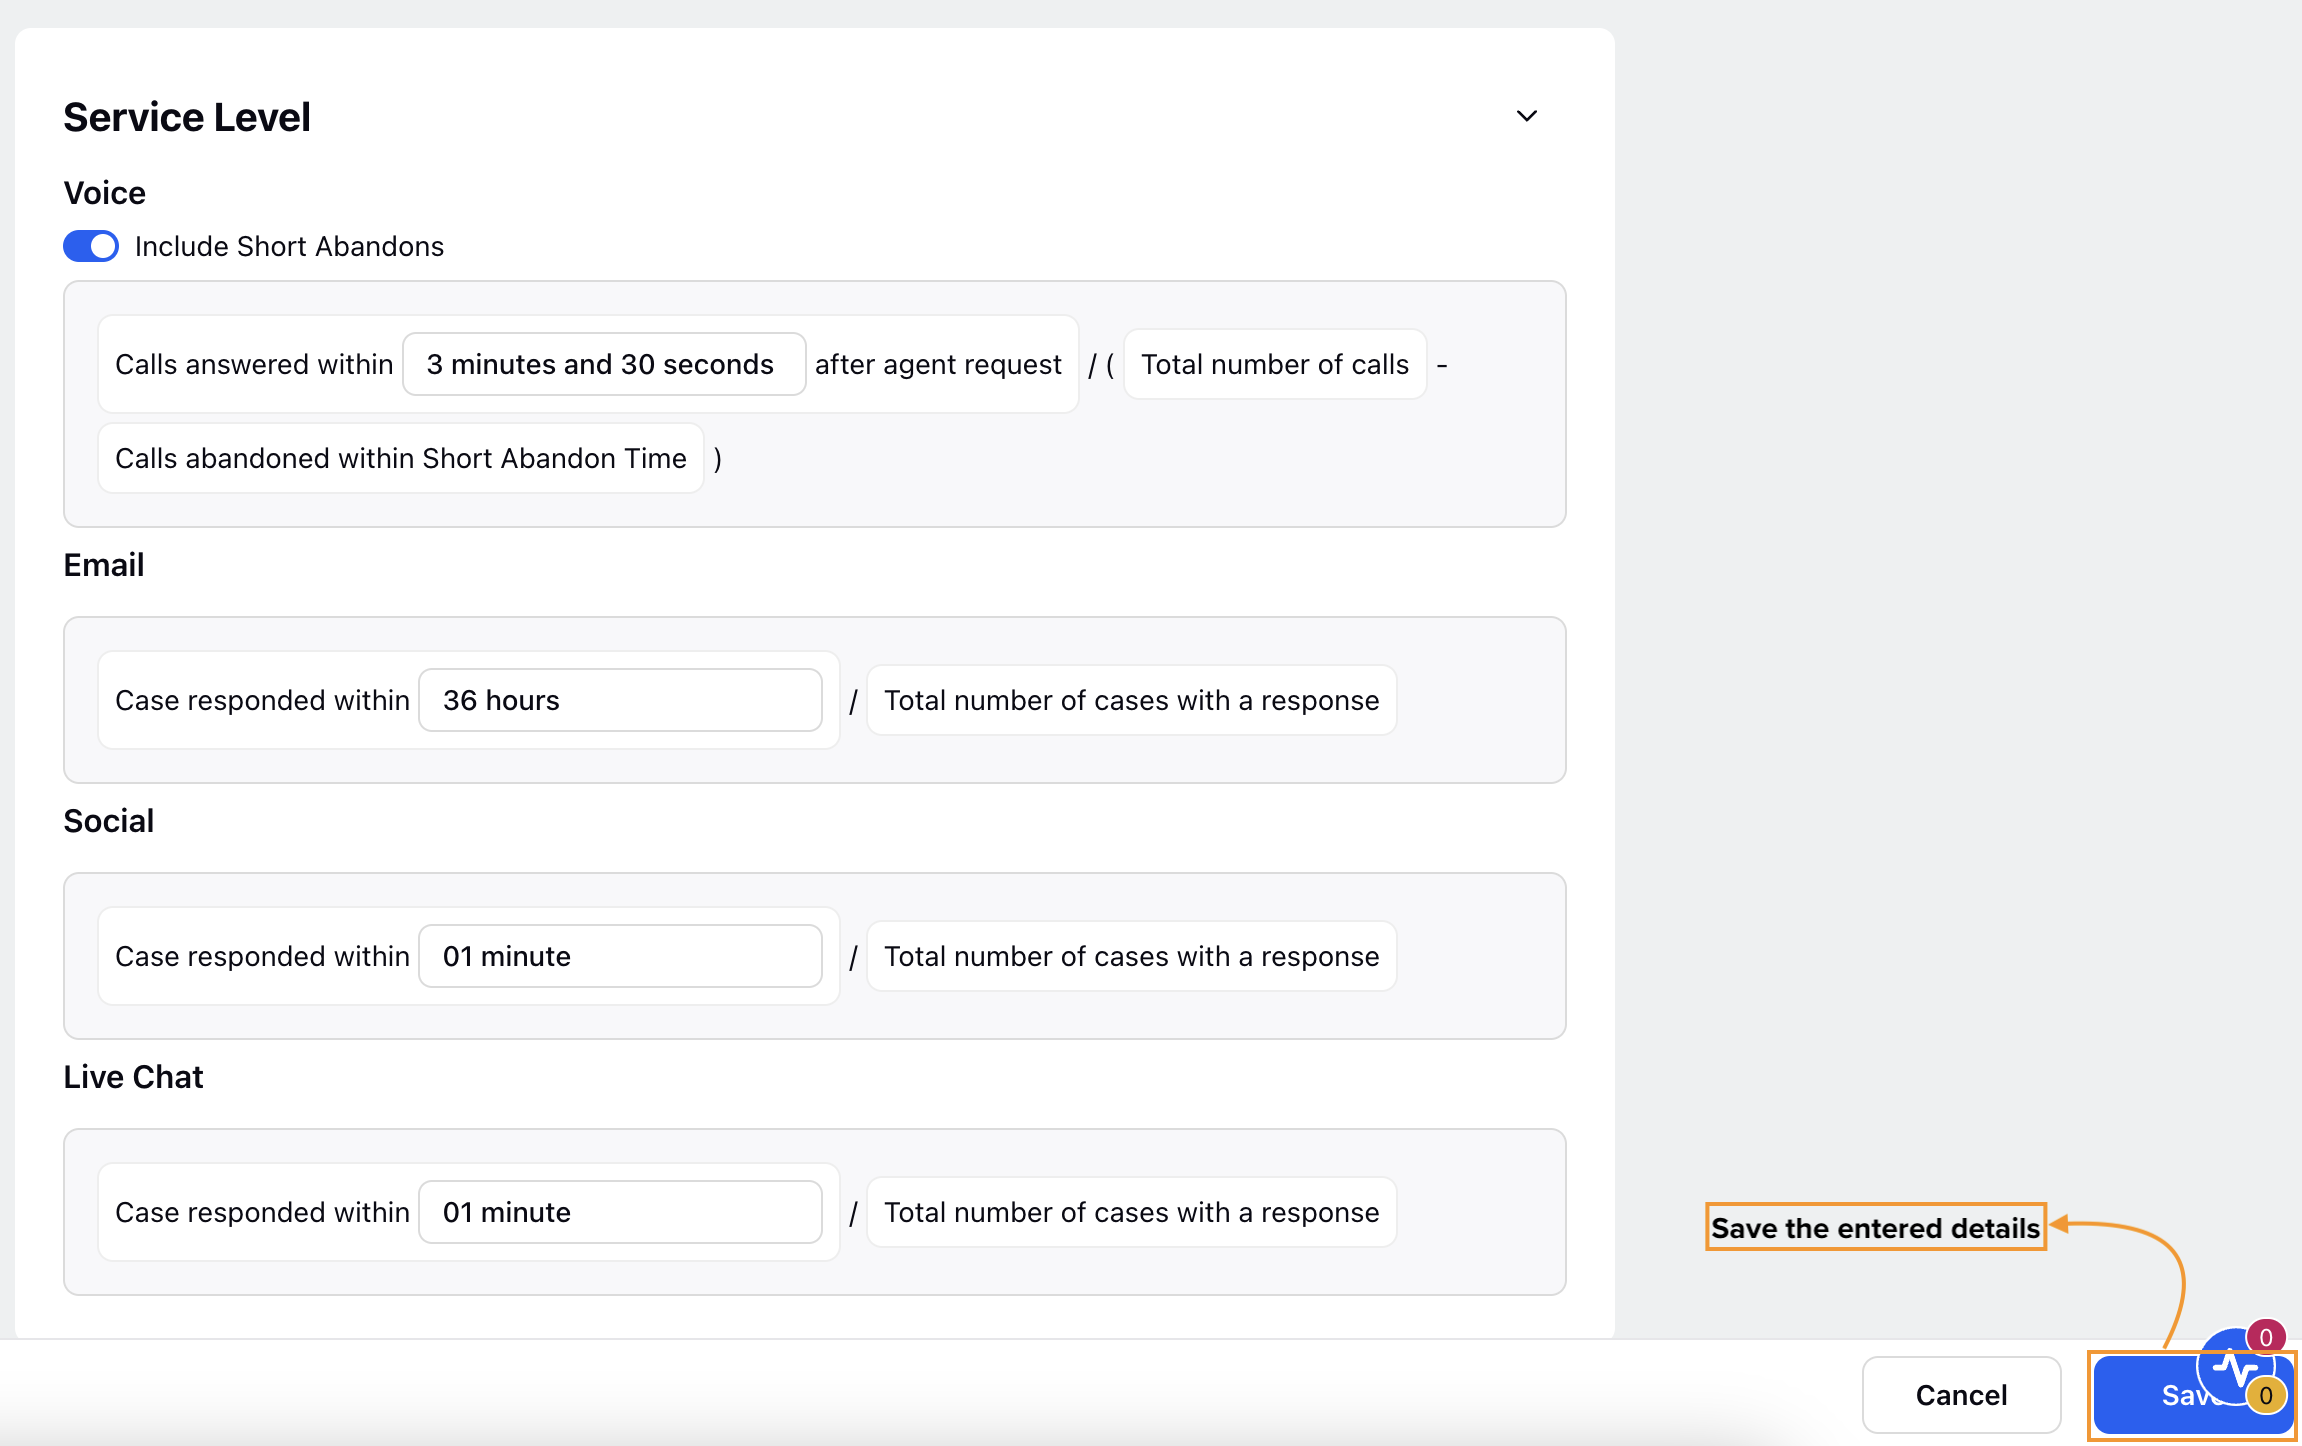
Click the Save button at the bottom right of the page to save the entered details.
Simultaneously Edit Multiple Standard Metrics
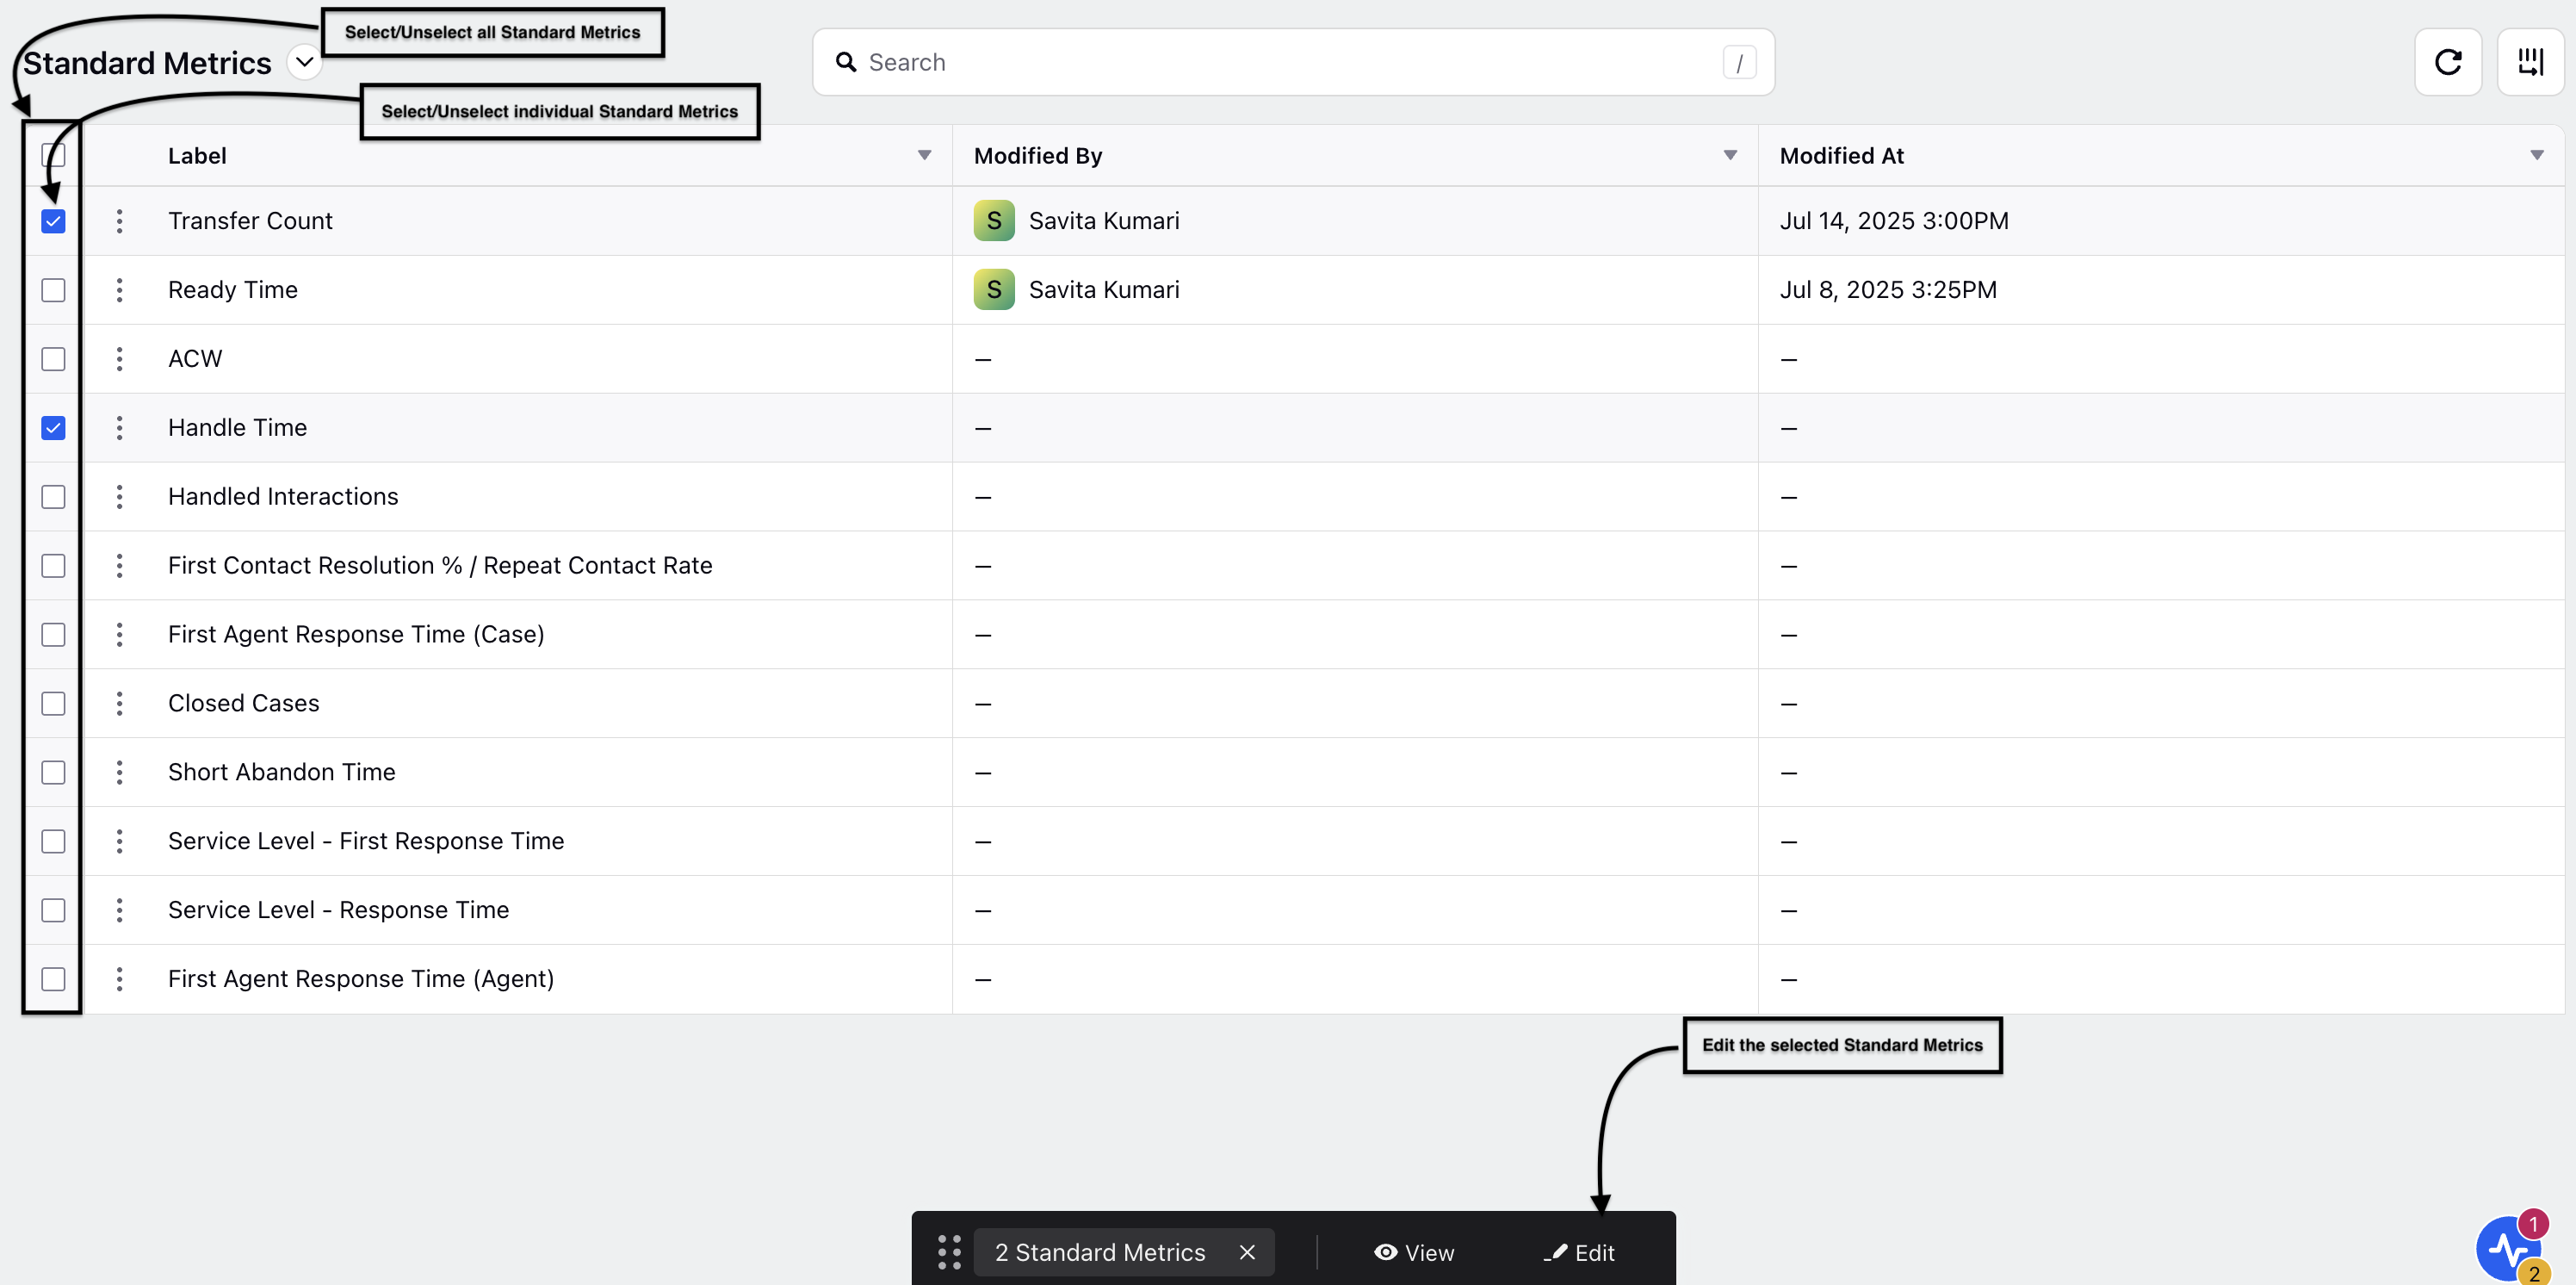
You can also edit multiple Standard Metrics simultaneously. To do this, select the desired Standard Metrics and click the Edit button towards the bottom of the page. This will open the customization page where you can modify the selected Standard Metrics.
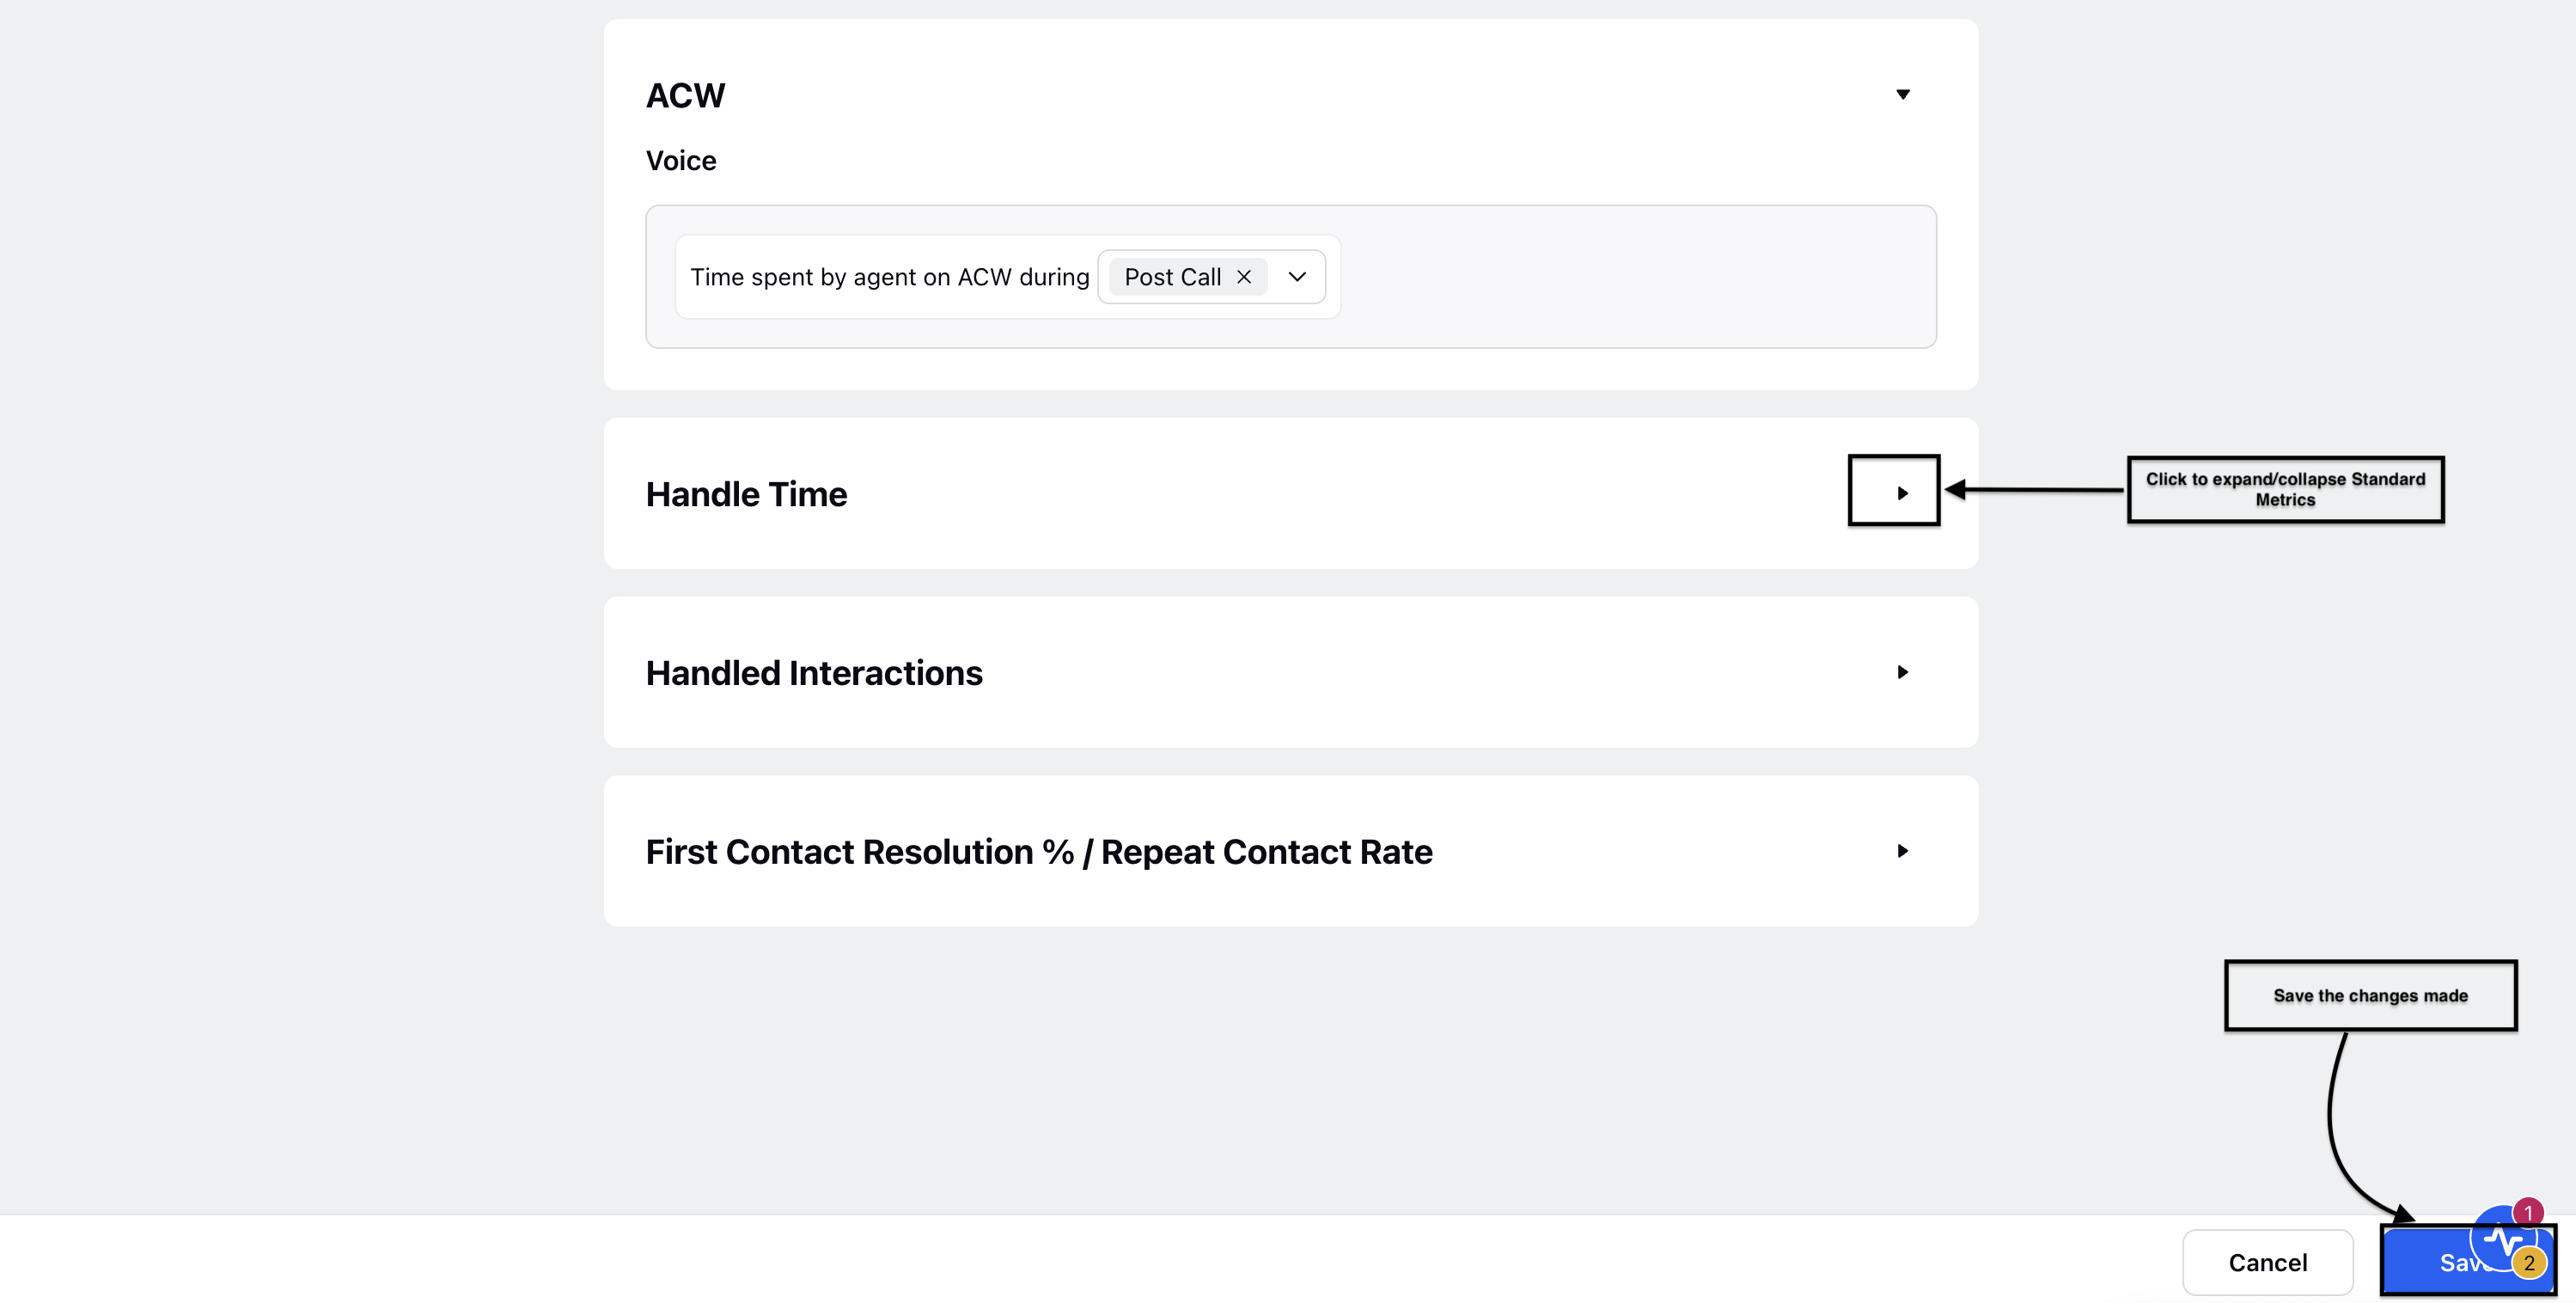
Click the Save button at the bottom right of the page to save the changes made to all Standard Metrics.
This completes the process of editing the definition of a Standard Metrics.
View Activity Log of Standard Metrics
Note: You must have the View permission under the Service Reporting Configuration Screen section in the Reporting module. Refer to Manage Roles for managing permissions.
Follow these steps to view the activity log of the Standard Metrics:

Go to Care Reporting in the Analyze column on the Launchpad. This will open the Reporting Dashboards Record Manager.

Click the Settings button at the top of the page to show a list of options.
Select Standard Metrics from this list to open the Standard Metrics Record Manager.

Hover over the vertical ellipsis (⋮) icon corresponding to the Standard Metrics whose activity log you want to view. This will show a list of options.
Select the Activity option from the list, which will open a window from the Third Pane showing the activity log of the selected Standard Metrics.
This completes the process of viewing the activity log for a Standard Metrics.
Available Parameters for Customization
The following parameters are available for customization in Standard Metrics:
Handle Time
After Call Work (ACW)
Service Level
Short Abandon Time
First Agent Response Time (Agent)
First Agent Response Time (Case)
Ready Time
Closed Cases
Transfer Count.
Handle Time
Handle time is the total time an agent spends on a call or interaction. It provides an option to configure for both voice and digital channels. The Standard Metrics feature allows it to be configured for the voice channel.
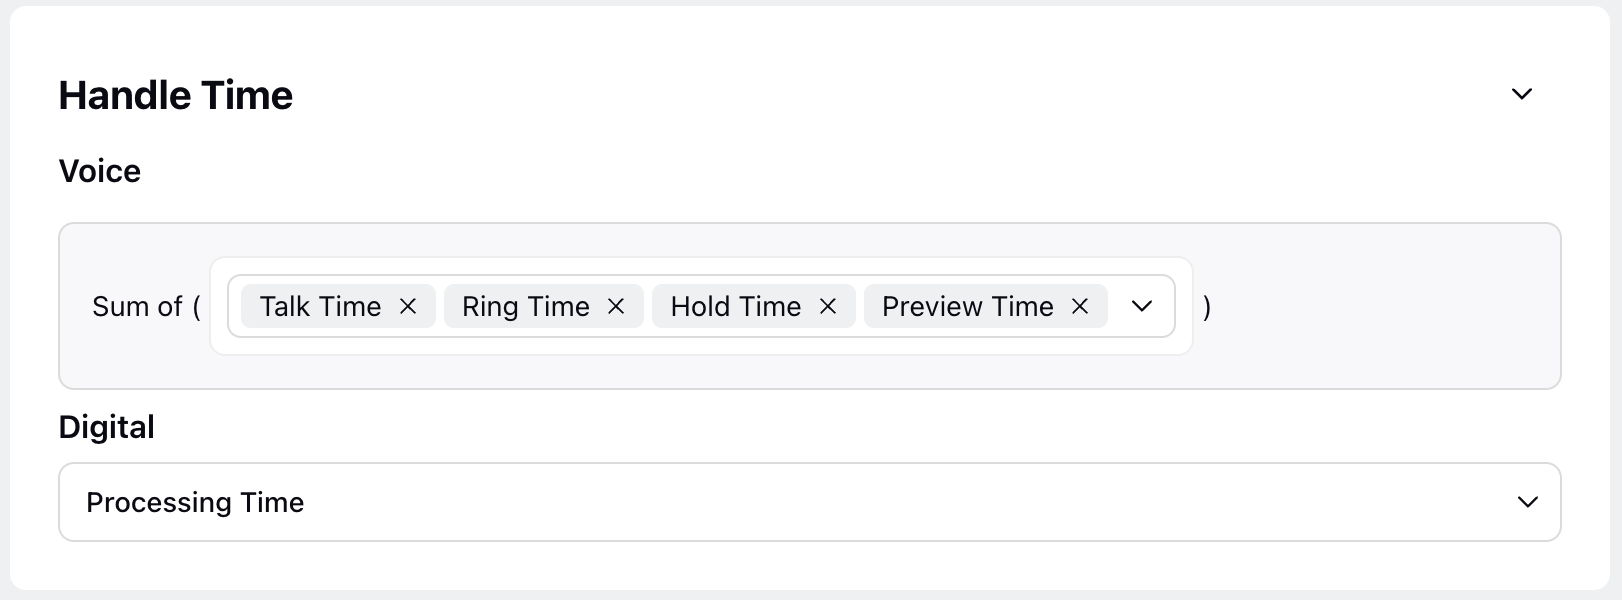
Configure Handle Time for Voice Channel
For voice channels, Handle Time can be composed of any combination of Ring Time, Talk Time, Hold Time, Preview Time, ACW Time and Consult Time (multiple options can be selected simultaneously).
For instance, if Talk Time, Hold Time, ACW Time, and Preview Time are selected, Handle Time will be calculated as the sum of Talk Time, Hold Time, ACW Time, and Preview Time.
Note: By default, Handle Time is calculated as the sum of Talk Time, Hold Time, and ACW Time ( Handle = Talk Time + Hold Time + ACW Time).

Definitions
Ring Time: The duration when the call is ringing on an agent console or for the customer after the call is requested to connect with the agent.
Talk Time: The time an agent spends actively speaking with a customer during a call. It is included by default when calculating Handle Time.
Hold Time: The time a customer spends on hold during a call. It is included by default when calculating Handle Time.
Preview Time: The time an agent spends reviewing information about the next call before initiating it. This generally applies to preview outbound calls.
ACW Time: The time an agent spends completing tasks related to a call (After Call Work) after it has ended. It is included by default when calculating Handle Time
Customer Dial Time: The time a call rings for the customer after dialing out. This typically occurs in outbound calls where the agent is connected first, and then the call is dialed out to the customer.
Consult Time: Consult time in handle time refers to the period when an agent seeks advice or additional information from a colleague or system while assisting a customer i.e when 2 agents are on call whereas the customer is on hold
NOTE: Since consult time is captured at both the agent and call level, when it's included in the handle time configuration, it is not reflected in voice queue (per assignment) and voice queue (per call) reports.
The following Reports and their respective Metrics/Dimensions will be impacted based on the selected options:
Report Group | Impacted Reports | Impacted Metrics/Dimensions |
Voice Additional Reports | Voice Report (Customer) | Total Handle Time |
Agent Performance | Agent Voice Performance | Handle Time (Agent) |
Queue Report | Voice Initial Queue | Total Handle Time |
Queue Report | Voice Queue (Per Assignment) | Handle Time (Per Assignment) |
Queue Report | Voice Queue (Per Call) | Handle Time (Per Call) |
The following Reports and their respective Metrics/Dimensions will be indirectly impacted based on the selected options:
Impacted Report | Impacted Metric | Remarks |
- | Average Handle Time | It is calculated based on the Handle Time for all 5 Reports in the above table. |
Configure Handle Time for Digital Channels (This feature is currently unavailable but will be included in a future release.)
Handle Time (Digital) refers to the total time an agent spends processing a digital interaction, such as responding to an email, chat, or social media message. For Digital Channels, Handle Time can be composed by selecting either Assigned Time or Processing Time from the options. This metric helps evaluate both the efficiency and effectiveness of agents in managing digital customer inquiries.
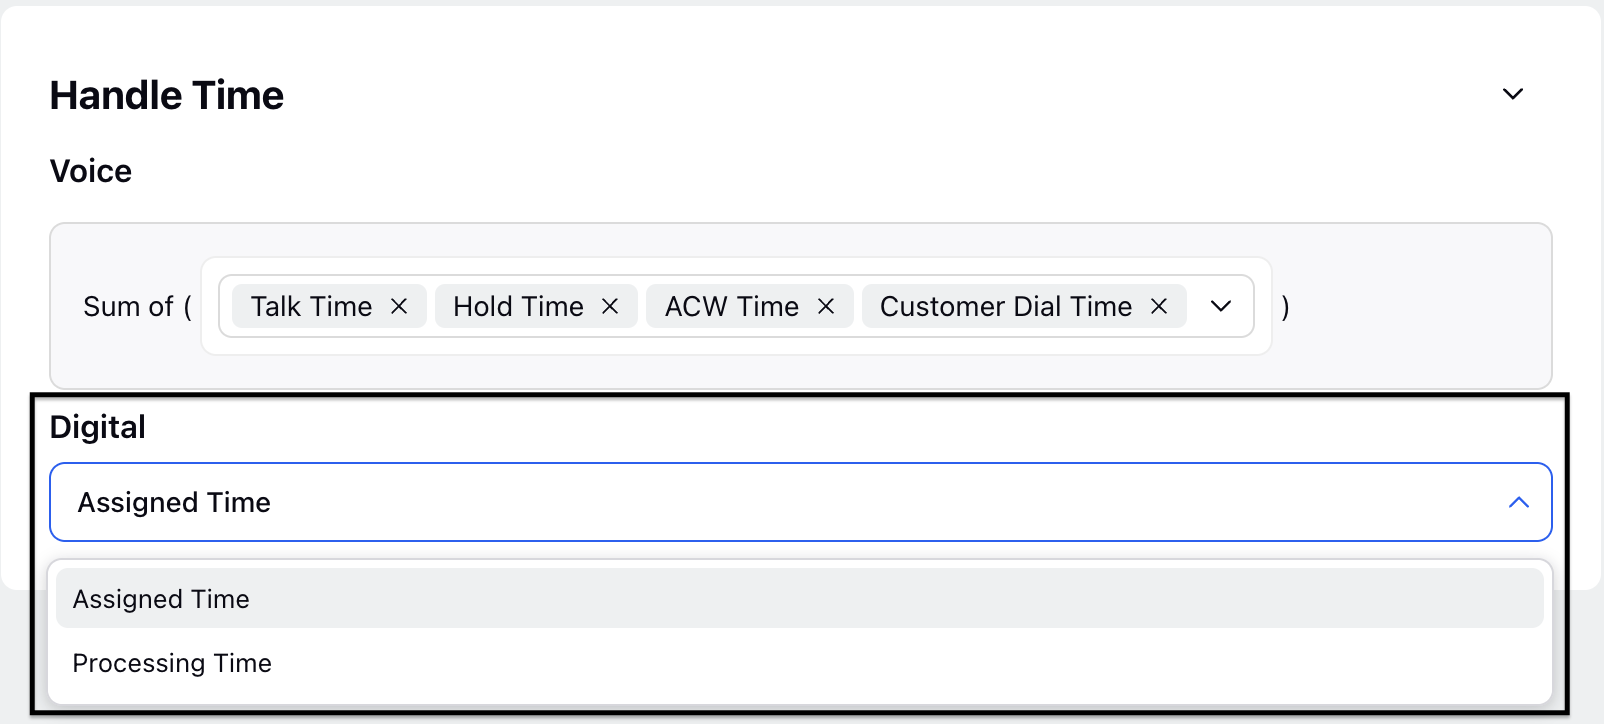
Definition:
Assigned Time: Assigned Time refers to the total time an agent is assigned to a case (to handle tasks) during their shift, regardless of whether the agent is actively engaged or not. It helps track an agent's availability and workload during a specific period.
Processing Time: Processing Time refers to the amount of time an agent spends actively working on a task, such as handling customer inquiries, resolving issues, or completing necessary follow-up actions. This is based on the case processing clock that runs when the agent is engaged on the case. It excludes idle or waiting time and is a key metric for evaluating an agent's efficiency.
The following Reports and their respective Metrics/Dimensions will be impacted based on the selected options:
Report Group | Impacted Report | Impacted Metrics/Dimensions |
Agent Performance Report Group | Digital Agent Performance Report | Handle Time (Digital) |
After Call Work (ACW)
After Call Work (ACW) is the task agents complete after a call, such as updating records and logging call details. You can adjust how to calculate the time spent by agents on ACW to include Post Call, Pending ACW, and During Call (multiple options can be selected simultaneously).
For example, if Post Call and Pending ACW are selected, ACW will be calculated as the sum of Post Call time and Pending ACW time.
Note: By default, the Post Call time is considered for ACW.
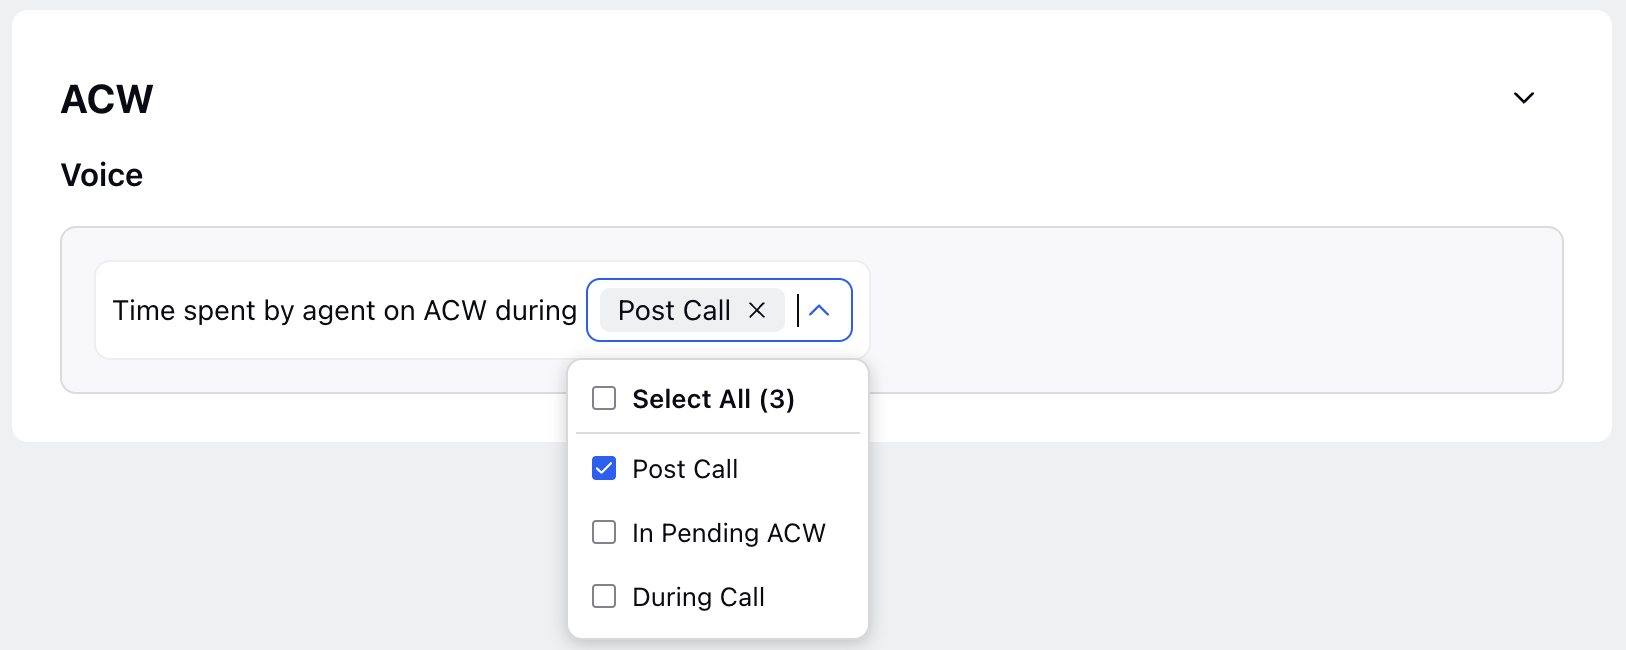
Definitions
Post Call: It is the time that agents spend on ACW tasks after a customer call ends. It is calculated based on the duration the ACW pop-up is opened on the agent's screen. In Sprinklr Service, this is the default time considered while calculating the time spent by agents on ACW.
In Pending ACW: This is the time an agent spends filling out/completing the tasks (ACW) after moving to the pending state. It usually happens when the agent has exceeded the configured/allotted ACW time or skipped the ACW.
During Call: It is the time an agent spends on ACW while being on a call with a customer.
The following Reports and their respective Metrics/Dimensions will be impacted based on the selected options:
Report Group | Impacted Reports | Impacted Metrics/Dimensions |
Voice Additional Reports | Voice Report (Customer) | Total ACW Time (Call) |
Agent Performance | Agent Voice Performance | ACW Time (Agent) |
Queue Report | Voice Initial Queue | Total ACW Time (Call) |
The following Reports and their respective Metrics/Dimensions will be indirectly impacted based on the selected options:
Impacted Reports | Impacted Metrics/Dimensions | Remarks |
Agent Voice Performance | Average ACW Time | It is calculated based on the ACW Time in Agent Voice Performance Report only. |
Service Level - First Response Time
Service Level- First Response Time measures the percentage of Cases handled within a specified time frame, indicating the contact center's efficiency. The Standard Metrics feature allows it to be configured differently for the voice channel, emails, social channels, and live chat.
Note: In Sprinklr Service Reporting, the Service Levels can be configured for Calls/Cases as well as for individual Queues. This section covers the configuration of the Service Levels for Calls/Cases. Refer to Configure Service Level for Individual Queues to configure Service Levels for individual Queues.
Configure Service Level for Voice Channel
For the voice channel, you can choose to consider Short Abandon Time for Service Level calculation. Use the 'Include Short Abandons' switch to determine whether Short Abandons are included in the voice channel Service Level calculation. Specify the interval to be considered for Service Level in the Voice field.

For example, if you enter 2 minutes and 30 seconds, the voice channel Service Level will be calculated as [(Calls answered within “2 minutes and 30 seconds” after agent request) / (Total number of calls - Calls abandoned within Short Abandon Time)] if Short Abandons are included.
If Short Abandons are not included, the voice channel Service Level will be calculated as [(Calls answered within “2 minutes and 30 seconds” after agent request) / (Total number of calls)].
Note: By default, the Service Level interval for the voice channel is 20 seconds.
The following Reports and their respective Metrics/Dimensions will be impacted based on the entered Service Level value for voice:
Report Group | Impacted Report | Impact Metric/Dimension |
Queue Report | Voice Initial Queue | Service Level (Per Call) |
Configure Service Level for Emails- First Response Time

You can configure how the Service Level is calculated for emails by specifying the interval to be considered in the Email field. For example, if you enter 3 minutes and 30 seconds, the Service Level for emails will be calculated as [(Case first responsed within “3 minutes and 30 seconds”) / (Total number of Cases with a response)].
Note: The default Service Level interval for emails is 24 hours.
The following Reports and their respective Metrics/Dimensions will be impacted based on the entered Service Level value for Email:
Report Group | Impacted Reports | Impact Metric/Dimension | Remarks |
Interation Summary | Case Summary | Service Level - FRT (Case) | This is the based on the First Agent Response Time (Case) from the available parameters. This metric calculates the cases answered within the time threshold difference between the first message time and option as selected in the service screen over total cases which were responded by the agent |
Interation Summary | Case SLA | Service Level - FRT | This is based on the First Response Time (Agent) from the available parameters. This metric calculates the cases answered within the time threshold difference between the first message time and option selected as per the service screen over total number of assigned cases that have been responded to by the agent. |
Configure Service Level for Social Channels- First Response Time

You can configure how the Service Level is calculated for social channels (such as Facebook, X (formerly Twitter), WhatsApp, Reddit, and more) by specifying the interval to be considered in the Social field. For example, if you enter 2 minutes, then SLA will be calculated as [(Case first responded within “2 minutes”) / (Total number of Cases with a response)].
Note: The default Service Level interval for social channels is 2 hours.
The following Reports and their respective Metrics/Dimensions will be impacted based on the entered Service Level value for Social:
Report Group | Impacted Reports | Impact Metric/Dimension | Remarks |
Interation Summary | Case Summary | Service Level - FRT (Case) | This is based on the First Agent Response Time (Case) from the available parameters. This metric calculates the cases answered within the time threshold difference between the first message time and option as selected in the service screen over the total cases which were responded by the agent. |
Interation Summary | Case SLA | Service Level - FRT | This is based on the First Response Time (Agent) from the available parameters. This metric calculates the cases answered within the time threshold difference between the first message time and option selected as per the service screen over total number of assigned cases that have been responded to by the agent. |
Configure Service Level for Live Chat - First Response Time
 For the Live Chat, specify the interval to be considered for Service Level in the Live Chat field. For example, if you enter 60 seconds, the Service Level for Live Chat will be calculated as [(Case first responded within “60 seconds”) / (Total number of cases with a response)].
Note: The default Service Level interval for Live Chat is 120 seconds.
The following Reports and their respective Metrics/Dimensions will be impacted based on the entered Service Level value for Live Chat:
Impacted Reports | Impact Metric/Dimension | Remarks |
Case Summary (Interaction Summary Report Group) | Service Level - FRT (Case) | This is based on the First Agent Response Time (Case) from the available parameters. This metric calculates the cases answered within the time threshold difference between the first message time and option as selected in the service screen over the total cases which were responded by the agent. |
Case SLA (Interaction Summary Report Group) | Service Level - FRT | This is based on the First Response Time (Agent) from the available parameters. This metric calculates the cases answered within the time threshold difference between the first message time and option selected as per the service screen over total number of assigned cases that have been responded to by the agent. |
Service Level - Response Time
Service Level - Response Time measures the number of responses made by the agent within the threshold against the total number of responses. The Service Level - Response Time feature is configured differently for Email, Social and Live Chat channels.
Configure Service Level - Response Time for Email
You can configure how the Service Level- Response Time is calculated only for Emails by specifying the interval to be considered in the Email field. The response time for Emails will only include Emails. For example: If you enter 3 minutes and 30 seconds, the Service Level- Response Time for emails will be calculated as { Number of responses made by the agent within {3 minutes 30 seconds}/Total Response Count}.

Note: The default Service Level interval for Email is 1 day.
The following Reports and their respective Metrics/Dimensions will be directly impacted based on the entered Service Level value for Email:
Report Group | Impacted Report | Impact Metric/ Dimension | Remarks |
Agent Performance Report Group | Agent Digital Performance Report | Service Level - RT | Percentage of responses sent by the agent within SLA over total response count sent by the agent on the case. The threshold for SLA can be based on value updated in the service level KPI in the Standard Metrics screen. |
Interaction Summary Report Group | Case SLA Report | Service Level - RT | Percentage of responses sent by the agent within SLA over total response count sent by the agent on the case. The threshold for SLA can be based on value updated in the service level KPI in the Standard Metrics screen. |
The following Reports and their respective Metrics/Dimensions will be indirectly impacted based on the selected options:
Report Group | Impacted Report | Impact Metric/ Dimension | Remarks |
Agent Performance Report Group | Agent Digital Performance Report | Response Count within SLA | Number of responses that were sent by the agent within the defined threshold set in the service level KPI in the Standard Metrics screen. |
Interaction Summary Report Group | Case SLA Report | Response Count within SLA | Number of responses that were sent by the agent within the defined threshold set in the service level KPI in the Standard Metrics screen. |
Agent Performance Report Group | Agent Digital Performance Report | Response count oustide SLA | Number of responses that were sent by the agent outside the defined threshold set in the service level KPI in the Standard Metrics screen. |
Interaction Summary Report Group | Case SLA Report | Response count oustide SLA | Number of responses that were sent by the agent outside the defined threshold set in the service level KPI in the Standard Metrics screen. |
Configure Service Level - Response Time for Social
You can configure how the Service Level- Response Time is calculated for emails by specifying the interval to be considered in the Social field. The response time for social will include all social channels, excluding email and live chat.For example: If you enter 3 minutes and 30 seconds, the Service Level- Response Time for Social will be calculated as { Number of responses made by the agent within {3 minutes 30 seconds}/Total Response Count}.

Note: The default Service Level interval for Social is 2 hours.
The following Reports and their respective Metrics/Dimensions will be directly impacted based on the entered Service Level value for Social:
Report Group | Impacted Report | Impact Metric/ Dimension | Remarks |
Agent Performance Report Group | Agent Digital Performance Report | Service Level - RT | Percentage of responses sent by the agent within SLA over total response count sent by the agent on the case. The threshold for SLA can be based on value updated in the service level KPI in the Standard Metrics screen. |
Interaction Summary Report Group | Case SLA Report | Service Level - RT | Percentage of responses sent by the agent within SLA over total response count sent by the agent on the case. The threshold for SLA can be based on value updated in the service level KPI in the Standard Metrics screen. |
The following Reports and their respective Metrics/Dimensions will be indirectly impacted based on the selected options:
Report Group | Impacted Report | Impact Metric/ Dimension | Remarks |
Agent Performance Report Group | Agent Digital Performance Report | Response Count within SLA | Number of responses that were sent by the agent within the defined threshold set in the service level KPI in the Standard Metrics screen. |
Interaction Summary Report Group | Case SLA Report | Response Count within SLA | Number of responses that were sent by the agent within the defined threshold set in the service level KPI in the Standard Metrics screen. |
Configure Service Level - Response Time for Live Chat
You can configure how the Service Level- Response Time is calculated for emails by specifying the interval to be considered in the Live Chat field. The response time for live chat will include all Live Chat channels except email and social.For example: If you enter 3 minutes and 30 seconds, the Service Level- Response Time for Live Chat will be calculated as { Number of responses made by the agent within {3 minutes 30 seconds}/Total Response Count}.

Note: The default Service Level interval for Live Chat is 3 minutes.
The following Reports and their respective Metrics/Dimensions will be directly impacted based on the entered Service Level value for Live Chat:
Report Group | Impacted Report | Impact Metric/ Dimension | Remarks |
Agent Performance Report Group | Agent Digital Performance Report | Service Level - RT | Percentage of responses sent by the agent within SLA over total response count sent by the agent on the case. The threshold for SLA can be based on value updated in the service level KPI in the Standard Metrics screen. |
Interaction Summary Report Group | Case SLA Report | Service Level - RT | Percentage of responses sent by the agent within SLA over total response count sent by the agent on the case. The threshold for SLA can be based on value updated in the service level KPI in the Standard Metrics screen. |
The following Reports and their respective Metrics/Dimensions will be indirectly impacted based on the selected options:
Report Group | Impacted Report | Impact Metric/ Dimension | Remarks |
Agent Performance Report Group | Agent Digital Performance Report | Response Count within SLA | Number of responses that were sent by the agent within the defined threshold set in the service level KPI in the Standard Metrics screen. |
Interaction Summary Report Group | Case SLA Report | Response Count within SLA | Number of responses that were sent by the agent within the defined threshold set in the service level KPI in the Standard Metrics screen. |
Handled Interaction
Handled Interactions refer to the total number of customer interactions that have been successfully managed and resolved. These interactions could occur across various digital channels such as social media, email and live chat. A handled interaction is typically considered complete when the agent has responded to the customer’s inquiry or issue and no further action is required. For Digital Channels, Handled Interactions can be composed by selecting either Brand Responses or Agent Assignments.

Brand Response: The number of assignments filtered by the case action type, where the brand response is selected and a brand response exists for that specific assignment.
Agent Assignment: The number of assignments filtered by the case action type, specifically for user assignment, for that particular assignment.
The following Reports and their respective Metrics/Dimensions will be impacted based on the selected options:
Report Group | Impacted Report | Impacted Metric or Dimension |
Agent Performance | Agent Digital Performance Report | Handled Interactions |
Short Abandon Time
Short Abandon Time refers to the duration within which a call is considered abandoned if the caller hangs up before a specified short time threshold. This helps contact centers identify and exclude very brief calls from their performance metrics, as these calls often do not provide meaningful data for evaluating agent performance or customer satisfaction.

For the voice channel, enter the Short Abandon Time in the Short Abandon Time field. For example, if you enter 10 seconds, the Short Abandon Time for the voice channel will be [Calls abandoned within “10 secs” after requesting for agent].
Note: By default, the Short Abandon Time for the voice channel is 5 seconds.
The following Reports and their respective Metrics/Dimensions will be impacted based on the selected options:
Report Group | Impacted Report | Impacted Metrics/Dimensions |
Queue Report | Voice Initial Queue | Total Customer Short Abandons |
Voice Additional Reports | Voice Report (Customer) | Total Customer Short Abandons |
First Agent Response Time (Agent)
First Agent Response Time (Agent) is the time taken for an agent to respond to a customer inquiry for the first time. This is a static metric calculated using Agent Assignment Time.
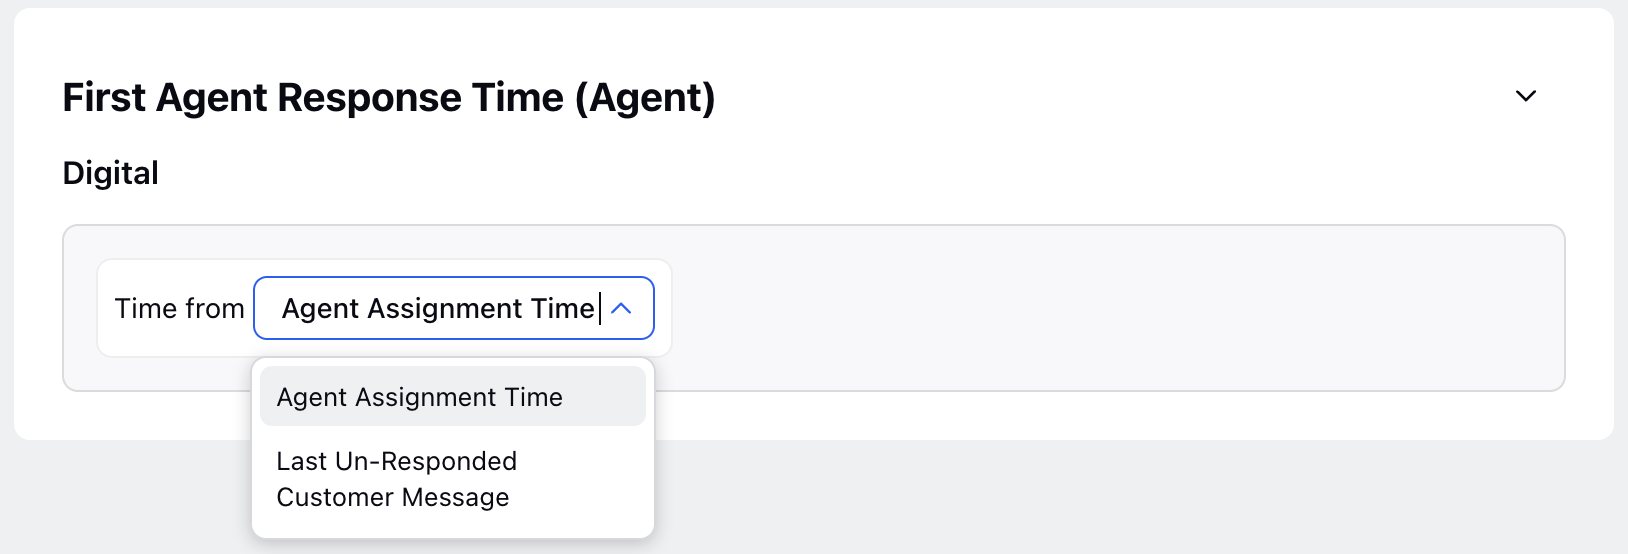
Below are explanations of how each option calculates the First Agent Response Time (Agent):
Agent Assignment Time: The First Agent Response Time (Agent) will be calculated as the time difference between the first agent message on the case for that agent and the agent's assignment time on the Case.
Note: By default, the first customer message time option is considered for calculating the First Agent Response Time (Agent).
The following Reports and their respective Metrics/Dimensions will be impacted based on the selected options:
Report Group | Impacted Reports | Impacted Metrics/Dimensions | Remarks |
Interaction Summary | Case SLA | First Agent Response Time (Agent) | This is an agent-level metric and is calculated separately for each agent assigned to the case. |
Agent Performance | Agent Digital Performance | First Agent Response Time (Agent) | This is an agent-level metric and is calculated separately for each agent assigned to the case. |
First Agent Response Time (Case)
First Agent Reponse Time (Case) is the time taken for the first response to be made on a customer case, regardless of the agent. You can adjust how Sprinklr Reporting calculates this by either using the Case Creation Time, Last Un-Responded Customer Message, First Customer Message Time, or Bot Handover Time/ Agent Request Time (only one option can be selected).
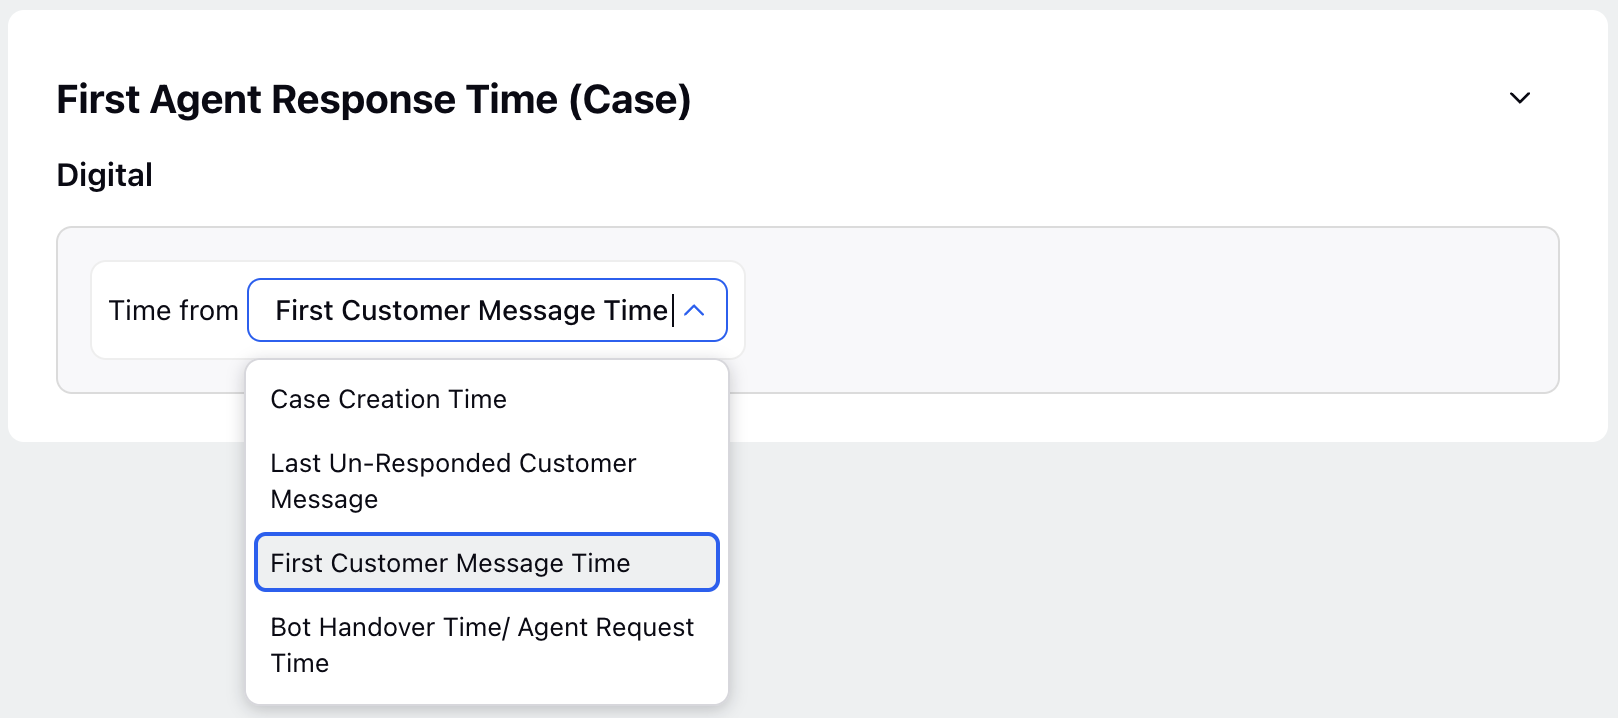
Below are explanations of how each option calculates the First Agent Response Time (Case):
Case Creation Time: The First Agent Response Time (Case) will be calculated as the interval between the first agent message on the Case and Case creation time.
Last Un-Responded Customer Message: The First Agent Response Time (Case) will be calculated as the interval between the first agent message on the Case and the last un-responded customer message time.
First Customer Message Time: The First Agent Response Time (Case) will be calculated as the interval between the first agent message on the Case and the first customer message time.
Bot Handover Time/ Agent Request Time: The First Agent Response Time (Case) will be calculated as the interval between the first agent message on the Case and the bot handover time/ agent request time
Note: By default, the Last Un-Responded Customer Message option is selected for calculating First Agent Response Time (Case).
The following Reports and their respective Metrics/Dimensions will be impacted based on the selected options:
Report Group | Impacted Report | Impacted Metric/Dimension | Remarks |
Interaction Summary | Omnichannel Case Summary | First Agent Response Time (Case) | This is a case level metric and in cases where multiple agents are involved on the case - only the first agent response per case is counted. The metric is based on case creation time. |
Interaction Summary | Case SLA | First Response Time (Case) | This is a case level metric and in cases where multiple agents are involved on the case - only the first agent response per case is counted. The metric is based on case action time. |
The following Reports and their respective Metrics/Dimensions will be indirectly impacted based on the selected options:
Report | Metric | Remarks |
Omnichannel Case Summary | First Agent Response Count Within SLA (Case) | The calculation of this Metric is based is dependent on the 'First Agent Response Time (Case)' Metric. |
Omnichannel Case Summary | First Agent Response Count Outside SLA (Case) | The calculation of this Metric is based is dependent on the 'First Agent Response Time (Case)' Metric. |
Ready Time
Ready Time is the amount of time agents are available and ready to take calls or handle Cases. It can be configured to be the sum of any available agent statuses, such as Available, Lunch, Training, and so on (multiple agent statuses can be selected simultaneously). The list will show all available agent statuses in your Workspace.
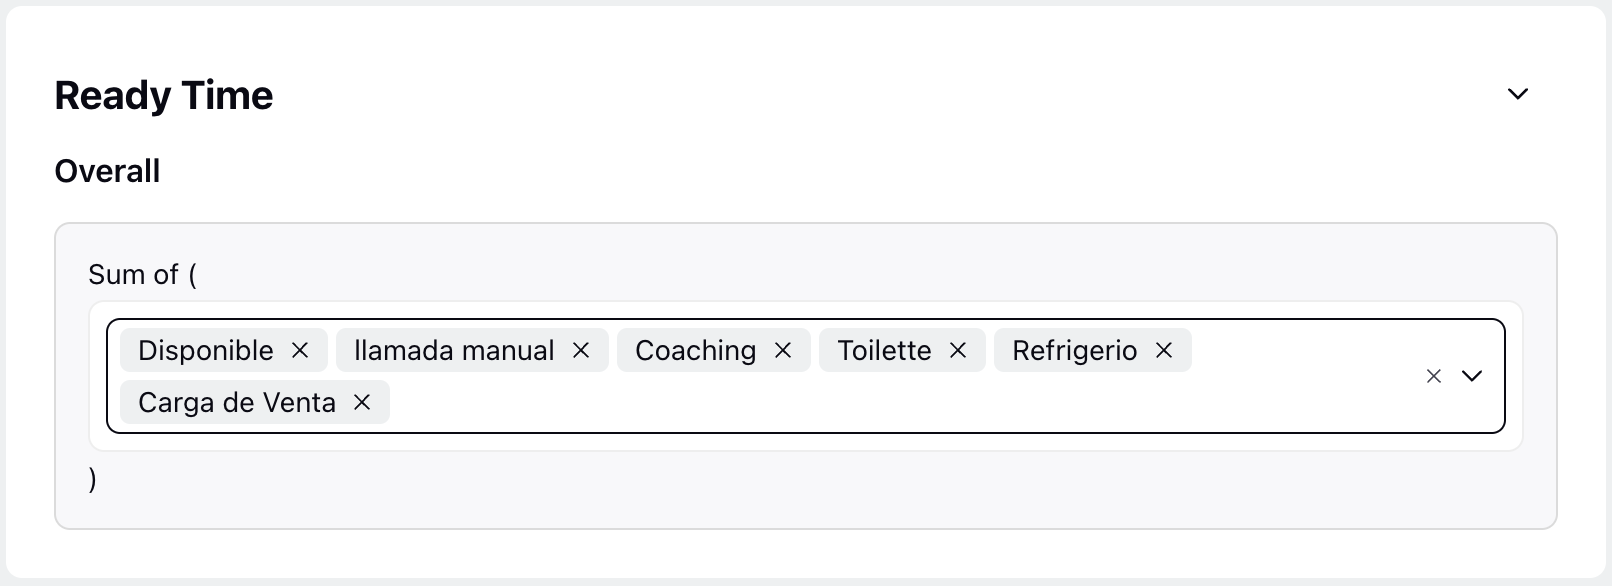
For instance, if Available and Training are selected, an agent's total Ready Time will be calculated as the sum of the time spent in Available status and the time spent in Training status.
Note: By default, the “Available” agent status is considered to calculate Ready Time.
The following Reports and their respective Metrics/Dimensions will be impacted based on the selected options:
Report Group | Impacted Report | Impacted Metric/Dimension |
Agent Time Card | Agent Occupancy | Ready Time |
The following Reports and their respective Metrics/Dimensions will be indirectly impacted based on the selected options:
Impacted Report | Impacted Metric | Remarks |
Agent Occupancy | Time Spent in Ready Status with any Case assigned | - |
Agent Occupancy | Idle Time - No case Assigned | This Metric is calculated as “Ready Time - Time spent in ready status with any Case assigned”. |
| Idle Time - Not working | This Metric is calculated as “Ready Time - Time spent working on the Case”. |
Agent Occupancy | Status Non Ready time % | This Metric is calculated as “Not Ready Time / Total Logged-in Time”. |
Agent Occupancy | Utilization % | This Metric is calculated as “Ready Time/ Total Logged-In Time”. |
Agent Occupancy | Not Ready Time | This Metric is calculated as “Logged in time - Ready Time”. |
Agent Occupancy | Occupancy % | This Metric is calculated as “Time spent in ready status with any Case assigned / Ready Time”. |
Closed Cases
Closes Cases are the number of customer issues or tickets that the agent has resolved and closed. By default, only Cases with a 'Closed' status are counted as Closed Cases. Other Case statuses, such as ‘Auto-Closed,’ ‘No Required Action,’ or other customized Case statuses, can be configured to be included in the Closed Cases count (multiple Case statuses can be selected simultaneously). The list will show all available Case statuses in your Workspace.
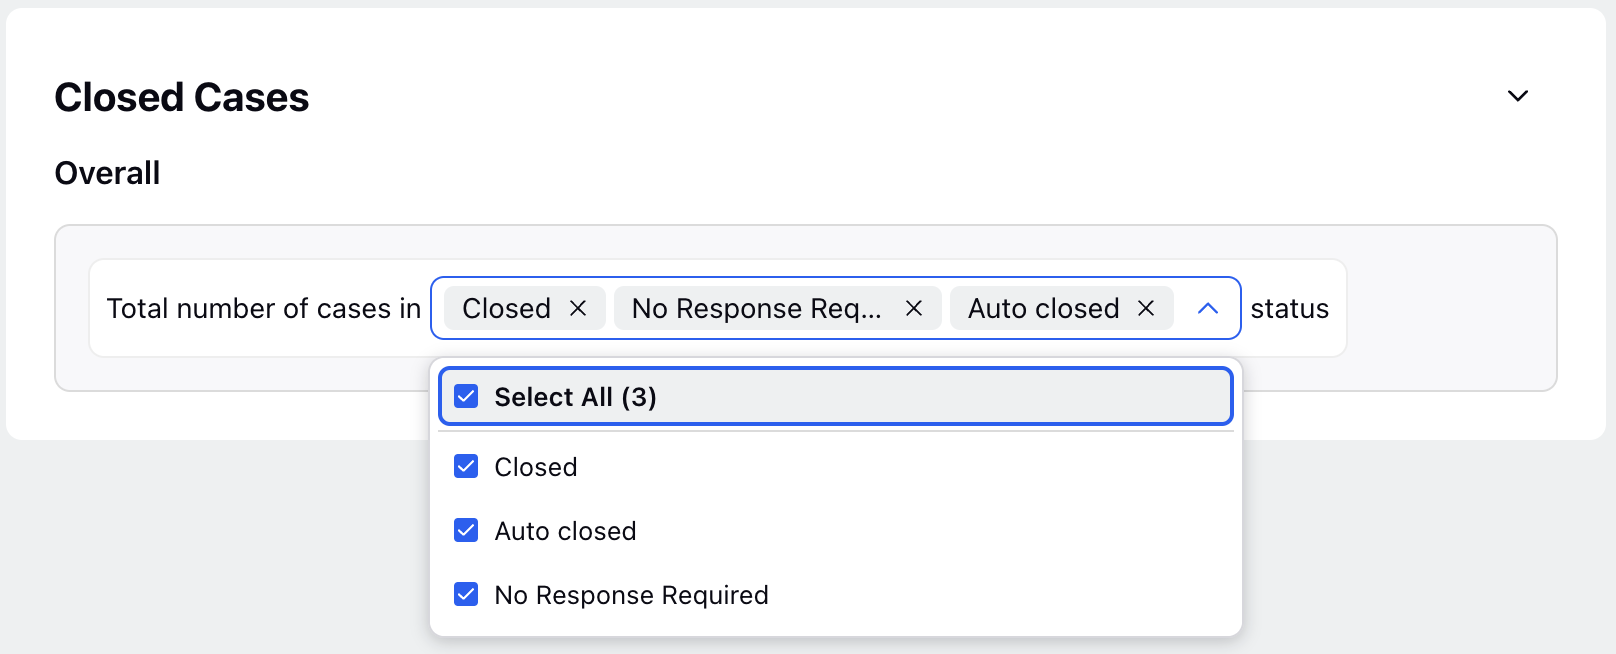
For instance, if the 'Closed' and 'Auto-Closed' case statuses are selected, the total number of Closed Cases will be the sum of cases in the 'Closed' and 'Auto-Closed' statuses.
Note: By default, Cases in the Closed status are considered for calculating Closed Cases.
The following Reports and their respective Metrics/Dimensions will be impacted based on the selected options:
Report Group | Impacted Report | Impacted Metric/Dimension |
Interaction Summary | Omnichannel Case Summary | Closed Case Count |
The following Reports and their respective Metrics/Dimensions will be indirectly impacted based on the selected options:
Impacted Report | Impacted Metric | Remarks |
Omnichannel Case Summary | Open Case Count | This Metric is calculated as "Case Count - Closed Case Count" |
Transfer Count
Transfer Count is the number of times a call or interaction is transferred between agents using Macros. It can be configured to show the total number of times the selected Macro(s) have been applied to the Case. You can select from any Macro available on the Workspace to be considered while calculating the Transfer Count (multiple Macros can be selected simultaneously).

For example, Macro A and Macro B are selected, Macro A has been applied 3 times, and Macro B has been applied 4 times to a Case. In this scenario, the Transfer Count for the Case will be the sum of the number of times each Macro has been applied to the Case, which in this scenario is 7 (3 for Macro A and 4 for Macro B).
The following Reports and their respective Metrics/Dimensions will be impacted based on the selected options:
Report Group | Impacted Reports | Impacted Metrics/Dimensions |
Agent Performance | Agent Case Macro Usage | Transfer Macro Count |
First Contact Resolution %/ Repeat Contact Rate
FCR (First Contact Resolution) measures the number of calls resolved during the first interaction within a given time period, compared to the total number of calls received in the system. Repeat Contact Rate is calculated using the same threshold input, with the formula: RCR = 100 - FCR. You can adjust how Sprinklr Reporting calculates this by either using the Inbound Calls or Unique Customer Contacts (only one option can be selected). Lets's have a look at the explanation:
Note: When analyzing interactions, you have the ability to compare the values of Custom Fields. If Custom Fields are associated with several calls, you can compare their values in a side-by-side manner.
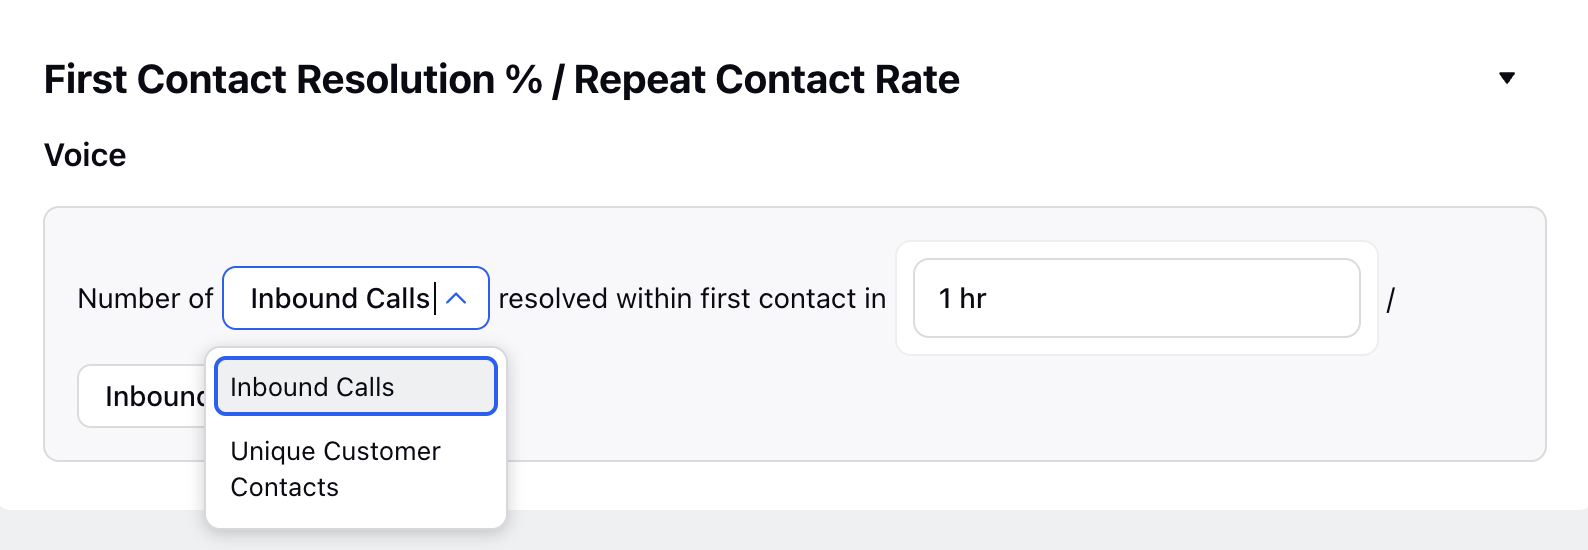
Inbound Calls: If you select inbound calls, the FCR will be calculated only on inbound calls. For example, if you enter 3 minutes and 30 seconds the First Contact Resolution will be calculated as {Number of "Inbound Calls" resolved within first contact in {3 minutes 30 seconds} / {Number of Inbound Calls}}.
Unique Customer Contact: If you select unique customer contacts, the FCR will be calculated on unique customer phone numbers that comes into the system. For example, if you enter 3 minutes 30 seconds the FCR will be calculated as {Number of "Unique Customer Contacts" resolved within first contact in {3 minutes 30 seconds} / Number of {Unique Customer Contacts}}.
Note: A new toggle has been added, when enabled, the FCR calculation will now consider not only call events but also Disposition and Sub-Dispositions as part of the logic. Previously, FCR was determined based solely on call comparisons; with this update, the system can now more accurately identify whether an interaction qualifies as FCR or should be marked as RCR (Repeat Call Resolution), based on additional context provided through dispositions.
The following Reports and their respective Metrics/Dimensions will be impacted based on the selected options:
Note: By default, these metrics on Inbound Calls with a threshold of the last 7 days.
The following Reports and their respective Metrics/Dimensions will be directly impacted based on the selected options for First Contact Resolution %:
Report Group | Impacted Reports | Impacted Metrics/Dimension |
Voice Additional Reports | Voice Report (Customer) | FCR % (First Contact Resolution)(Call) |
Voice Additional Reports | Voice Report (Customer) | FCR Call Count |
Agent Performance | Agent Voice Performance Report | FCR % (First Contact Resolution)(Agent) |
Agent Performance | Agent Voice Performance Report | FCR Call Count (Agent) |
The following Reports and their respective Metrics/Dimensions will be indirectly impacted based on the selected options:
Report Group | Impacted Reports | Impacted Metrics/Dimension |
Voice Additional Reports | Voice Report (Customer) | RCR % (Repeat Contact Rate)(Call) |
Voice Additional Reports | Voice Report (Customer) | Repeat Call Count |
Agent Performance | Agent Voice Performance Report | RCR % (Repeat Contact Rate)(Agent) |
Agent Performance | Agent Voice Performance Report | Repeat Call Count (Agent) |