Reporting on Similar Cases
Updated
You can create reporting widgets to view the usage and adoption of the Similar Cases capability.
Configuring a reporting widget
Click the New Tab icon
. Under the Sprinklr Service tab, click Care Reporting within Analyze.
On the Reporting Home window, select the desired dashboard within the Dashboards section.
On the selected Reporting Dashboard window, click Add Widget in the top-right corner.
On the Create Custom Widget window, enter a Name for the widget, and select the Data Source as Social Analytics.
Select the Visualization for your widget as Counter.
Next, within the What would you like to plot on your widget section, select the following metrics.
Unique Case Count (Case Similarity) - Total number of unique cases on which AI predicted similar cases.
Event Count (Case Similarity) - Total number of AI-predicted similar cases.
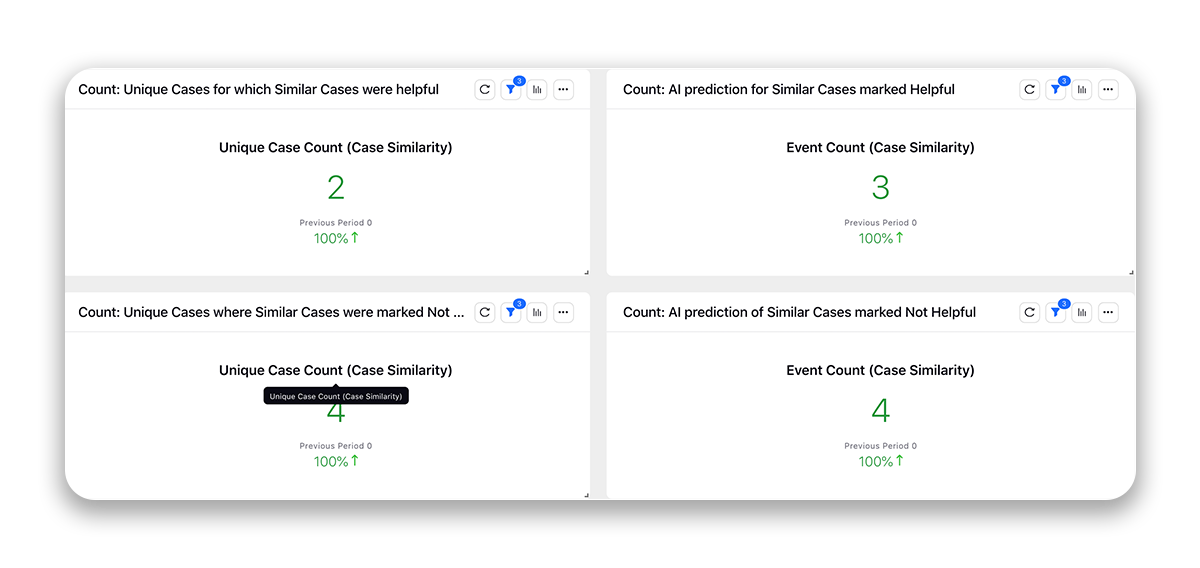
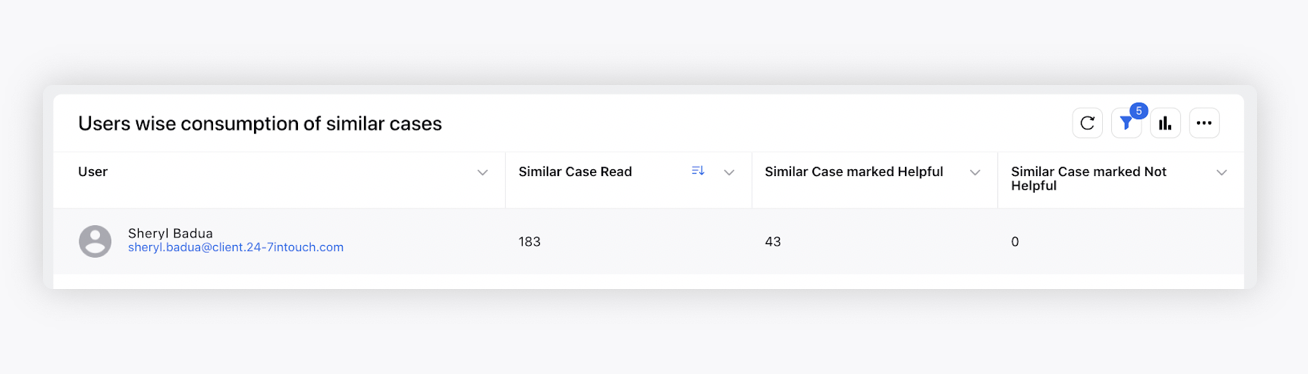
Table widget to show the number of similar cases read, marked helpful/unhelpful at the user level.
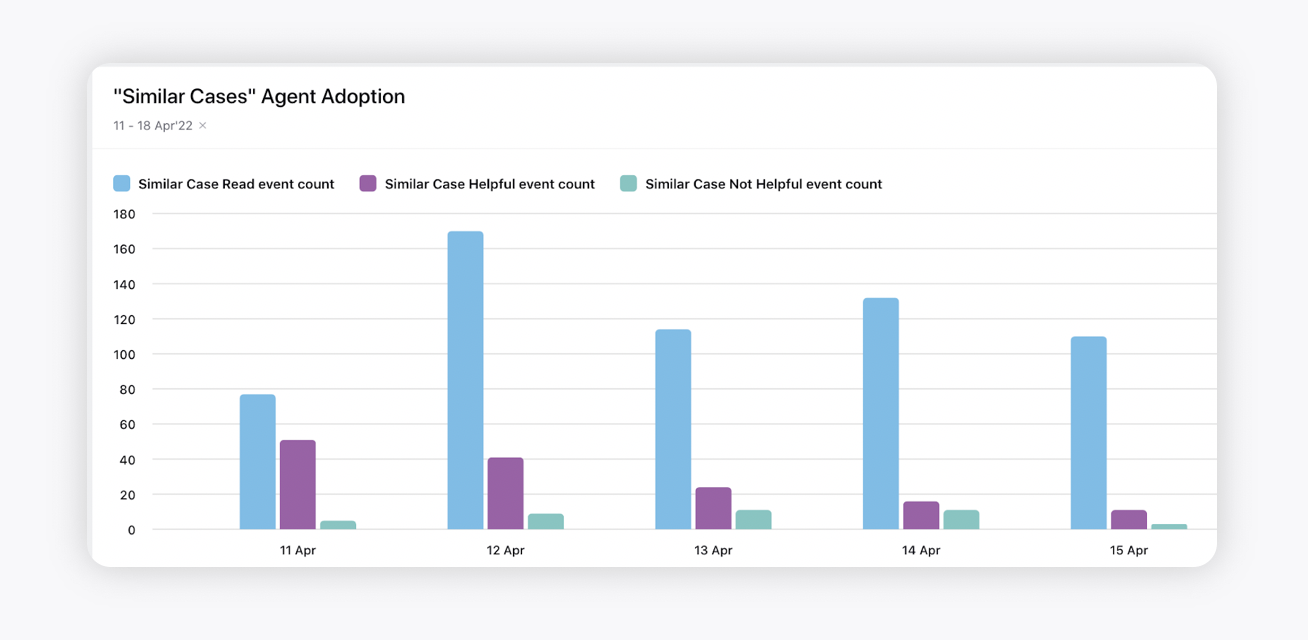
Column chart to show the agent adoption with time.
Click Add to Dashboard in the bottom-right corner to add the widgets to the dashboard.