Use Smart Insights to gain quick insights on multiple data points/anomalies
Updated
Gain deep actionable AI-powered insights by drilling down on multiple data points/anomalies in your widget.
Detecting the relevant point of anomalies or spikes in your data is imperative to study the deviations. By turning Smart Insights on in your widget, the most significant points of anomalies/deviations are auto-detected by the AI. A single click on these points yields the most crucial factors driving that particular anomaly. These auto-generated insights absolve you from the strenuous act of manually selecting these points. Now, with a single click, you can deep dive into decisive insights such as top hashtags, top sources, Sentiment distribution, etc, which can be further drilled down to the metric of your preference. Smart Insights are supported on multiple widget visualizations making them more accessible.
In this article, we will study the functionality, scope, and limitations of smart insights in Sprinklr.
Personas
Analysts find a hard time drilling down on data anomalies or deviations to figure out the exact cause and underlying factors for any data point of their choice.
A brand manager requires a lot of effort and estimation to manually skim through the conversations to identify the contributing drivers for any data point.
Analysts require more data points with available built-in smart insights with an informative review display that can be expanded for deeper insights.
Use Cases
Detecting a deviation in the data displayed in widgets, charts, graphs, etc, is often a laborious task when done manually. With Smart insights activated, understanding the point of deviation or spike becomes easier if the exact factors influencing that point become accessible with a single click.
Smart insights available only for a few data points might not be enough for an analyst to get a wholesome analysis of deviation/anomalies. Smart insights counter this by being available on multiple data points on your widget.
Doing multiple drill downs and applying complex filters makes the workflow cluttered and unproductive. With smart insights, you get top driving factors influencing the data point summarized in a card with just a single click. This reduces the time to reach insights in an efficient manner.
Availability
Smart insights can be availed for the following modules and widgets.
Modules: Listening, Standard Benchmarking dashboards, and Media Insights.
Supported Widget Types: Line, Spline, Area, Area Spline, Bar, Column, Combination, Dual Axis, Table,Stacked Bar, Stacked Column.
Functioning of Smart Insights
The supported widget types will have a bulb icon. Toggling the bulb icon on will expose the Smart Insights Bulbs at points of anomalies/peaks. Toggling it off will revert the widget to its previous state. Sprinklr’s AI detects the data points on which smart insights are deemed most fit, removing the effort of manually selecting those points.
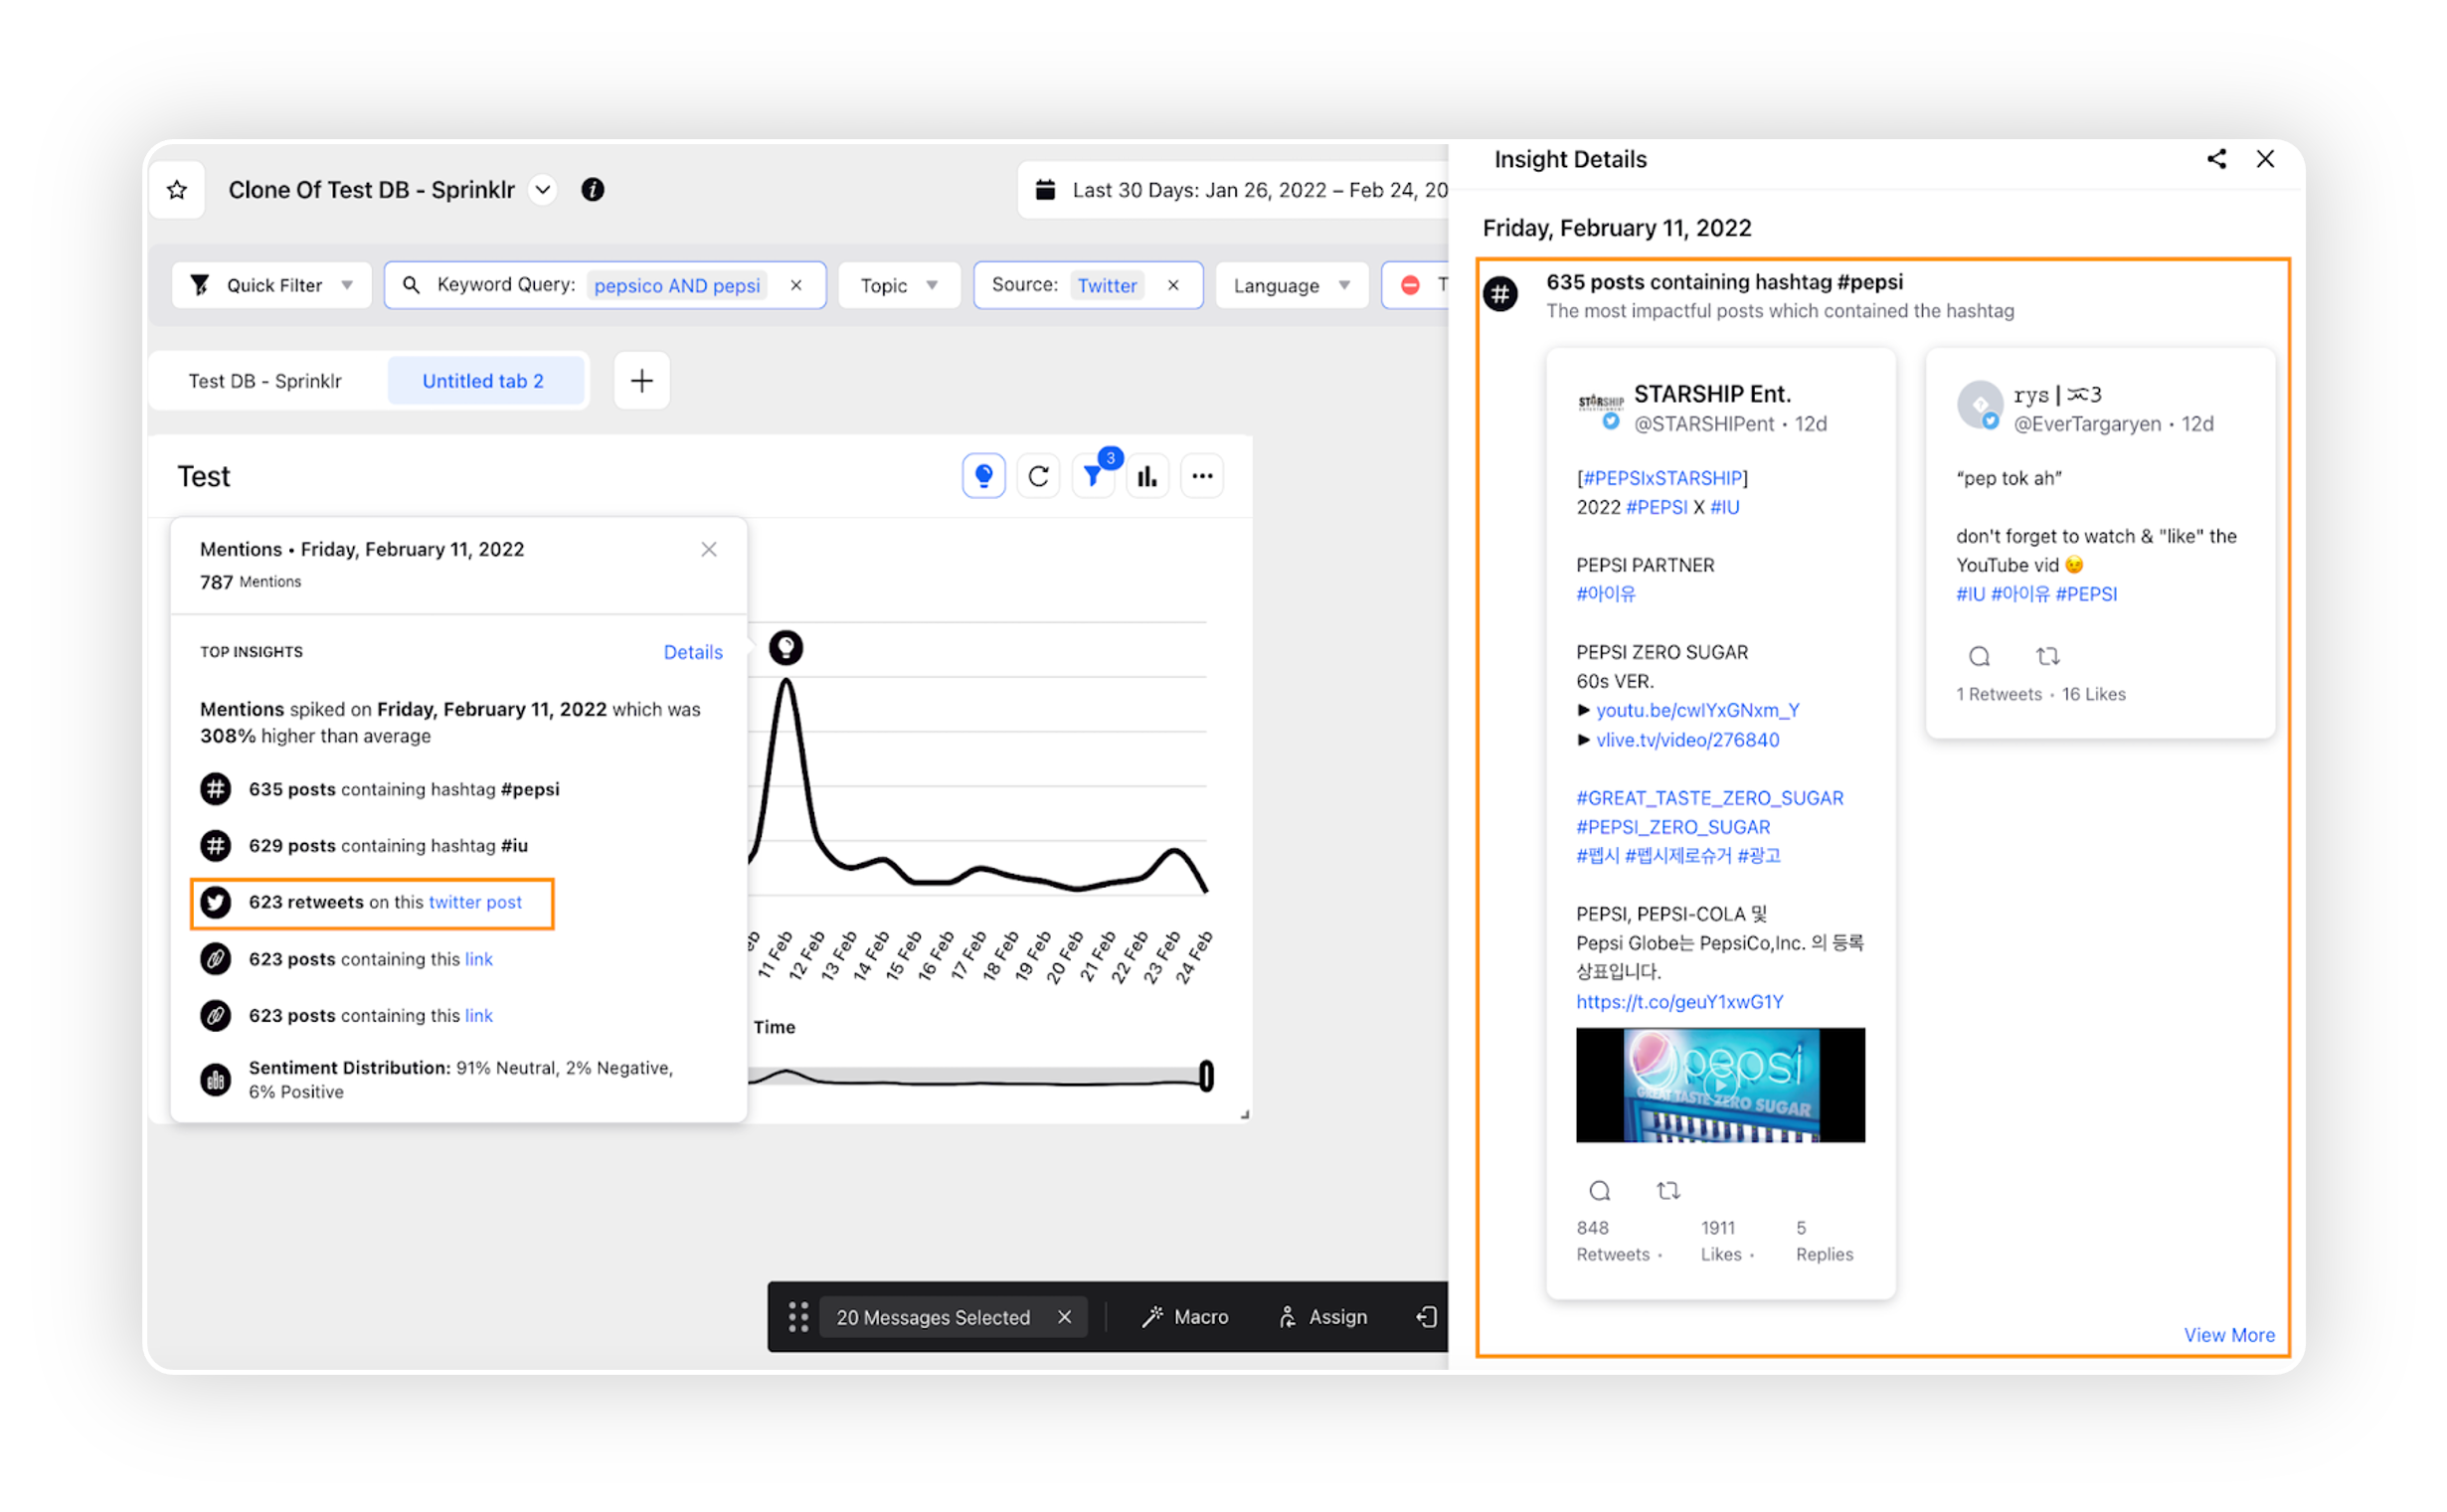
Upon clicking the Smart Insights Bulb, an insights card is generated which displays top insights summarized for a quick glance over the top driving factors for that data point. Crucial insights such as top hashtags, sentiment distribution, sources, etc, can be seen at once with just a single click. One can explore these insights by clicking Details on the card.
Insights Details Pane
Clicking Details on the insights preview card will showcase an Insight Details pane on the right side of the window. This pane will possess detailed, drillable, and actionable insights which expand the previewed insights to their full scope.
One-click Smart Insights
Earlier, smart insights were shown on anomalies found critical by Sprinklr's AI. For all the other points, the user had to manually drill down to gather relevant insights which was a laborious task.
Now with the upgraded smart insights, when a user clicks at a data point, the drill-down menu opens up, having the top entry as Smart Insights.
Upon clicking Smart Insights the card opens up revealing the insights of the selected data point. Crucial information such as Top hashtags, Sources, are displayed in the form of a summary to glance over the top insights. These insights can be further drilled downed and dissected to narrow down the metrics driving the data point.
Smart Insights for Product Insights and Location Insights
Earlier, smart Insights highlights only one hashtag or post with Highest Retweet Count. Now, with the upgraded and revamped smart insights, you can see more insights of an insight type - such as most retweeted, most popular hashtags, most used links, etc.
Smart insights will now work on a dip in case of a star rating & experience score when displaying Product Insights & Location Insights.
Users shall be able to see the Smart insights when there is a dip in Star rating or Experience Score.
For Instance,
At Dip: Experience Score dipped by 120% from the average during 10th September'20 - 12th September'20
At Spike: Star Rating spiked by 120% from the average during 10th September'20 - 12th September'20.
Smart Insights For Benchmarking
Smart Insights is available for standard benchmarking dashboards. Powered by Sprinklr's robust AI, Smart Insights automatically detects and uncovers meaningful insights from the clutter of social & digital media conversations. It enables you to find and report the pinpointed factors in a summarized format which are contributing towards any anomaly in the Brand's tracking metrics - competitor brand social account engagements, brand social media followers, or social account activities.
It answers a few questions such as:
What were the most used hashtags and keywords in competitors' content that caused a spike in their social engagement?
What was the most delayed reply by a brand's social account on a fan post?
What were the top used content themes and tones in brand posts on a given day?
Smart Insights for Media Insights
Smart Insights are now available for media insights. This will enable stronger media monitoring and analysis by gaining insights on any data point in a timeline. Smart insights for media insights reveal pivotal insights such as print mentions, story mentions, etc, which are dominant in driving the detected anomaly.
Note:
|