Agent Performance Voice

Updated 

An Agent Performance Report provides detailed insights into an individual agent's work metrics and efficiency. It typically includes data such as the number of cases handled, response times, resolution times, customer satisfaction scores, and other key performance indicators (KPIs). This report helps evaluate an agent's overall effectiveness and identify areas for improvement or training.

Scenarios to use Agent Performance Voice Report

  • Evaluating Efficiency: Helps assess how quickly and effectively agents handle cases, identifying top performers and areas for improvement.

  • Identifying Training Needs: Pinpoints areas where agents may need additional training based on performance metrics like response and resolution times.

  • Performance Reviews: Provides data-driven insights for agent performance reviews, feedback sessions, and goal setting by evaluating the number of calls handled and Average Handling Time (AHT).

  • Customer Satisfaction Tracking: Monitors customer feedback and satisfaction scores to ensure quality service and identify any issues.

  • Optimizing Staffing: Assists in balancing workloads and ensuring optimal resource allocation based on agent performance trends.

Dashboard Sections

  • Performance Overview: The Performance Overview tab provides a concise summary of key metrics, offering a quick snapshot of an agent's overall performance.

  • Inbound: The Inbound Call Summary is a report provides an overview of key metrics related to inbound calls handled by agents. This summary helps assess the efficiency and effectiveness of agents in handling inbound customer inquiries and can be used to identify trends, areas for improvement, or to measure overall team performance.

  • Outbound: An Outbound Call Summary provides an overview of all outbound calls made by agents, including key metrics like total calls made, talk time, call outcomes (successful, abandoned, or unanswered), and agent performance. It also tracks conversion rates, call distribution across agents, and any trends related to abandoned calls.

  • Time Card: A Time Card Report that includes detailed information about login and logout times, agent status, occupancy, and utilization offers a comprehensive view of how agents spend their workday and how efficiently they are managing their time.

  • Raw Data: The raw data report provides detailed insights into agent performance across all metrics.

Let's have a look at the metric's

Name

Definition

Number of Offered Calls

The Number of Calls refers to the total count of calls offered to the agent, including both inbound and outbound calls.

Number of Connected Calls

Number of calls where agent and customer both connected on the call, including inbound and outbound calls dialled.

Number of Abandoned Calls

Refers to calls where the customer failed to connect in outbound calls, or the agent failed to connect in inbound calls, after the call was offered to the agent. 

Handle Time (Agent)

Shows the total handle time of a conversation, encompassing talk time, hold time, preview time, wrap time, and other relevant metrics, as configured in the "Service Settings" screen.

Average Handle Time

Measures the average duration an agent spends handling a customer interaction.AHT= (Total Handle Time/Number of Connected Calls)

Average Talk Time

Measures the average duration an agent spends speaking with a customer during an interaction. 
 Average Talk Time= Total talk Time/ Number of Connected Calls

Average Hold Time

Measures average amount of time a customer spends on hold during an interaction. 
 Average Hold Time= Total Time Spent on Hold by an Agent/ Number of Connected Calls. 

Average ACW Time

Time measures the average amount of time an agent spends on tasks related to a customer interaction after the call has ended. 
 Average ACW Time= ACW Time (Agent) / Number of Connected Calls.

Average Handle Time

Measures the average time an agent spends on a customer interaction, including talk time, hold time, and after-call work (ACW).

Average Inbound Ring Time

Measures the average time it takes for an inbound call to be answered by an agent after it is offered. 

Average Outbound Ring Time

Measures the average duration a call rings on the agent console for outbound calls, from when the call is initiated until the customer first connects. 

Average Preview Time

Measures the average time an agent spends in the preview phase before dialling out an outbound call. 


There are 6 different types of reports that you can visualise in the Performance Overview Report:

The ACW/Disposition Summary provides an overview of the After-Call Work (ACW) and call dispositions for each agent or team over a specified period.

Let’s try to understand the various metrics in it:

Name

Definition

Is ACW Submitted

A Boolean field indicating whether the ACW (After-Call Work) has been submitted or not. 

ACW Time Pending State

Time spent on ACW after it is moved to a Pending state due to a timeout. 

ACW Time (Agent)

Time spent by the agent on filling out the ACW, based on the values selected in the "Service Settings" screen. 

Call Disposition

Shows the disposition field entered by the agent while completing the ACW or Disposition Form. 

Top Performers by AHT highlights the agents with the lowest Average Handle Time (AHT), indicating their efficiency in managing customer interactions. This metric helps identify high-performing agents who resolve issues quickly while maintaining quality service.

Identifies agents who complete the most After-Call Work (ACW) tasks. This metric highlights agent who efficiently handle their post-call responsibilities, ensuring accurate and timely documentation or follow-up actions.

Highlights agents who manage the highest number of both inbound and outbound calls. This metric helps recognize agents with high call volumes, showcasing their productivity and ability to handle large workloads effectively.

Some of the Key Metrics are:

Name 

Definition 

Number of Connected Calls 

The number of calls where both the agent and customer successfully connected, including both inbound and outbound calls.  

Number of Inbound Connected Calls 

The number of inbound calls where both the agent and customer successfully connected.  

Number of Outbound Connected Calls: 

The number of outbound calls where both the agent and customer successfully connected. 

This graph tracks the daily count of unique agents actively handling calls, whether inbound or outbound.

Metrics for Transfer Summary are as follows:

Name 

Definition 

Transfers Initiated (Blind or Warm) 

The total number of warm and blind transfers initiated by the agent during a call, either to a queue or directly to another agent.  

Warm Transfers Initiated 

The total number of warm transfers initiated by the agent during a call, including transfers directly to another agent (regardless of whether the agent answered) or to a queue.  

Blind Transfers Initiated 

The total number of blind transfers initiated by the agent during a call, including transfers directly to another agent or to a queue.  

Consult Transfers Initiated 

A Warm Transfer initiated by the agent, regardless of whether the agent is connected to the call. If connected, it indicates a consultative transfer where the agent only provides assistance, but the call control is not transferred to them.  

External Transfers Initiated 

The total number of external transfers initiated by the agent, regardless of whether the external agent connected to the call or not. 


To analyze inbound call performance, the user can click on the Inbound Tab. Within this tab, the Inbound Calls Summary provides a detailed table.

Let’s deep dive into all the metrics of Inbound Call Summary:

Name 

Definition 

Date 

Date of call occurrence 

Agent 

The Sprinklr user for whom the report is being generated. 

Number Of Offered Calls 

The total number of calls offered to the agent, including both inbound and outbound calls. 

Number Of Connected Calls 

The total number of calls where both the agent and customer successfully connected, including both inbound and outbound calls.  

Number Of Abandoned Calls 

Number of calls abandoned where the customer did not connect in the case of outbound calls, and the agent did not connect in the case of inbound calls, after an offer was made to the agent.  

% Connected Calls 

Percentage of calls connected out of the total number of calls offered to a particular agent.  

Ring Time 

Time taken by the agent to connect the call after the offer was made, for both outbound and inbound calls.  

Average Ring Time 

Average inbound ring time based on the number of inbound calls offered to the agent.  

Talk Time 

Total talk time of the agent across all calls  

Average Talk Time 

Total talk time spent by agents divided by the number of connected calls  

Hold Time 

Total time the call was on hold by the agent  

Average Hold Time 

Total time spent by agents on hold divided by the number of connected calls  

ACW Time 

Time spent by the agent filling out the ACW, based on the values selected in the 'Service Settings' screen.  

Average ACW Time 

ACW time per agent divided by the number of connected calls.  

Handle Time 

Represents the total handle time of the conversation, including talk time, hold time, preview time, wrap time, etc., based on the metrics selected in the 'Service Settings' screen 

Average Handle Time 

Average total handle time, based on values selected in the 'Service Settings' screen, divided by the total number of connected calls. 

Transfer Initiated: 

Total number of warm and blind transfers initiated by the agent, either to a queue or directly to another agent  

Blind Transfer Initiated 

Total number of blind transfers initiated by the agent during the call, including transfers directly to an agent or to a queue  

Warm Transfer Initiated 

Total number of warm transfers initiated by the agent during the call, including transfers directly to an agent (regardless of whether the call was answered) or to a queue  

Transfers Received 

Total number of warm and blind transfers received by the agent during the call. For warm transfers, the call rang on the agent's console, whether the agent accepted it or not. For blind transfers, the call was accepted and connected after ringing on the agent's console.  

Blind Transfers Received 

Total number of blind transfers received by the agent during the call and accepted by the agent (counted only if the agent is successfully connected to the call).  

Warm Transfers Received 

Total number of warm transfers received by the agent during the call. This includes when the call rings on the agent's console, when the agent connects to the call (consult call), or when the agent takes full control of the call after the transfer (successful transfer).  

Max Ring Time 

Time taken by the agent to connect the call after the offer was made, for both outbound and inbound calls  

Pending ACW Count 

Pending ACW for calls that are eligible for ACW. 


Let's understand the metrics.This summary helps evaluate the efficiency and effectiveness of outbound calling efforts.

Let’s deep dive into all the metrics of Outbound Call Summary:

Name 

Definition 

Number of Offered Calls 

Total number of calls offered to the agent, including both inbound and outbound calls.  

Number of Connected Calls 

Total number of calls where both the agent and customer connected, including both inbound and outbound calls.  

Number of Dialer Calls Connected 

Number of outbound dialer attempted calls which were connected by customer i.e. both agent and customer connected on the call.  

Number of Manual Calls Connected 

Total number of outbound manual calls attempted by the agent where both the agent and customer connected on the call.  

Number of Schedule Callbacks Connected 

Number of outbound schedule callbacks attempted calls which were connected by customer i.e both agent and customer connected on the call.  

Number of Abandoned Calls 

Total number of abandoned calls where the customer did not connect in outbound calls and the agent did not connect in inbound calls, after the offer was made to the agent.  

% Connected Call 

Percentage of calls connected out of the total number of calls offered to a specific agent.  

Ring Time 

Time taken by the agent to connect the call after the offer was made, for both outbound and inbound calls.  

Average Ring Time 

Average time the call rang on the agent's console for outbound calls where the customer first connected.  

Talk Time 

Total talk time of the agent across all calls.  

Average Talk Time 

Total talk time spent by agents divided by the number of connected calls.  

Hold Time 

Total time the call was put on hold by the agent.  

Average Hold Time 

Total time spent by agents on hold divided by the number of connected calls.  

ACW Time 

Time spent by the agent completing the ACW, based on the values selected in the Service Settings screen.  

Average ACW Time 

ACW Time (Agent) / Number of Connected Calls.  

Preview Time 

Indicates the preview time spent by the agent before making an outbound call.  

Average Preview Time 

Average preview time per agent, based on the number of preview calls dialed out from the system (for outbound calls only).  

Customer Dial Time 

Time spent by the agent on an outbound call while it's ringing to the customer, where the agent is connected and waiting for the customer to join (for manual and preview calls).  

Handle Time 

Depicts the total handle time of the conversation including the talk time, hold time, preview time, wrap time etc based on metrics selected in the service settings screen.  

Average Handle Time 

Average of total handle time as per values selected in service settings screen over total number of connected calls.  

Transfers Initiated 

Total number of warm and blind transfers initiated by the agent during the call, either to a queue or directly to another agent.  

Blind Transfers Initiated 

Total number of blind transfers initiated by the agent during the call, including transfers either directly to an agent or to a queue.  

Warms Transfers Initiated 

Total number of warm transfers initiated by the agent during the call, including transfers directly to an agent (whether or not the agent answered) or to a queue.  

Transfers Received 

Total number of warm and blind transfers received by the agent. For warm transfers, the call rang on the agent’s console, whether accepted or not. For blind transfers, the call was accepted and connected after ringing.  

Blind Transfers Received 

Total number of blind transfers received by the agent and accepted by the agent (counted only if the agent is connected to the call).  

Warm Transfers Received 

Total number of warm transfers received by the agent. This includes when the call rings on the agent's console, when the agent connects to the call (consult call), or when the agent is fully transferred control of the call (successful transfer).  

Pending ACW Count 

Pending ACW for calls that are eligible for ACW. 

Let’s try and understand different types of reports and the information that it provides:

  • Detailed Login and Logout Report

  • Time in different Statuses

  • Occupancy and Utilization Report

  • Logged in Agent Trend

A Detailed Login and Logout Report tracks the exact times an employee or agent logs in and out of a system, providing insights into shift start and end times, total logged-in duration, and any inactivity gaps. This report is essential for time tracking in environments like customer support centers, call centers, or remote work settings.

Here are following metrics for this report:

Name 

Definition 

Agent 

Refers to the user for whom the report is being generated.  

Agent ID 

Refers to the Sprinklr User ID for whom the ID is generated.  

Logged in Time 

Measures the total time an agent is logged into the system.  

Login Timestamp 

Date and timestamp of when the agent logged into the system.  

Logout Timestamp: 

Date and timestamp of when the agent logged out of the system. 


The Time in Different Statuses Report provides a detailed breakdown of how an agent allocates their time during their shift, categorizing it into various work statuses.Here are following metrics for this report:

Name 

Definition 

Agent 

Refers to the user for whom the report is being generated.  

Agent Status 

Agent Status refers to the work states assigned to an agent in the Sprinklr platform, such as Available, Break, Lunch, and other custom statuses. These help manage agent availability and optimize resource allocation. 

Time in Status 

Time Spent in Status within a given interval, associated with Agent Status.  

Status Assign Time 

Refers to timestamp when an agent transitions into a specific status. Apply a filter for the desired Agent Status to view the details.  

Status Receive Time 

Refers to timestamp when an agent exits a specific status. Apply a filter for the desired Agent Status to view the details. 

The Occupancy and Utilization Report tracks agent productivity by measuring Occupancy (time spent actively working vs. available time) and Utilization (time spent on task-related activities). These metrics help managers optimize workload distribution and improve overall efficiency.

Here are following metrics for this report:

Name 

Definition 

Date 

Date of the report. 

Agent 

Agent for whom report is generated. 

Agent ID 

Refers to the unique ID of the user.  

Occupancy % 

The percentage of time an agent spends handling ACD (Automatic Call Distribution) conversations, calculated by dividing the time spent in Ready Status with any case assigned by the total Ready Time. 

Utilization % 

The percentage of time an agent spends handling tasks in statuses like Interacting, Idle, and Not Responding, calculated by dividing the time spent in these statuses by the total login time. 

Ready Time 

The time spent in the Ready status during the specified period, where "Ready Status" includes all agent statuses in which a case can be assigned to them.  

Not Ready Time 

The time spent in any status other than Offline and Ready during the specified period.  

Logged In Time 

Measures the total time an agent is logged into the system.  

Time spent working on cases 

The time an agent has a case open in the Care Console, Agent Console, or Third Pane, with the option to filter by Agent Status. 

The Logged in Agent Count represents the number of unique users who logged in within the specified time range. This metric is not suitable for tracking hourly trends, as it is based on the agent's login timestamp.

It also includes information on whether the call was inbound or outbound, along with the customer’s phone number and a breakdown of the call count for both inbound and outbound calls along with other metrics.

Manage Dashboard

Date Range Section

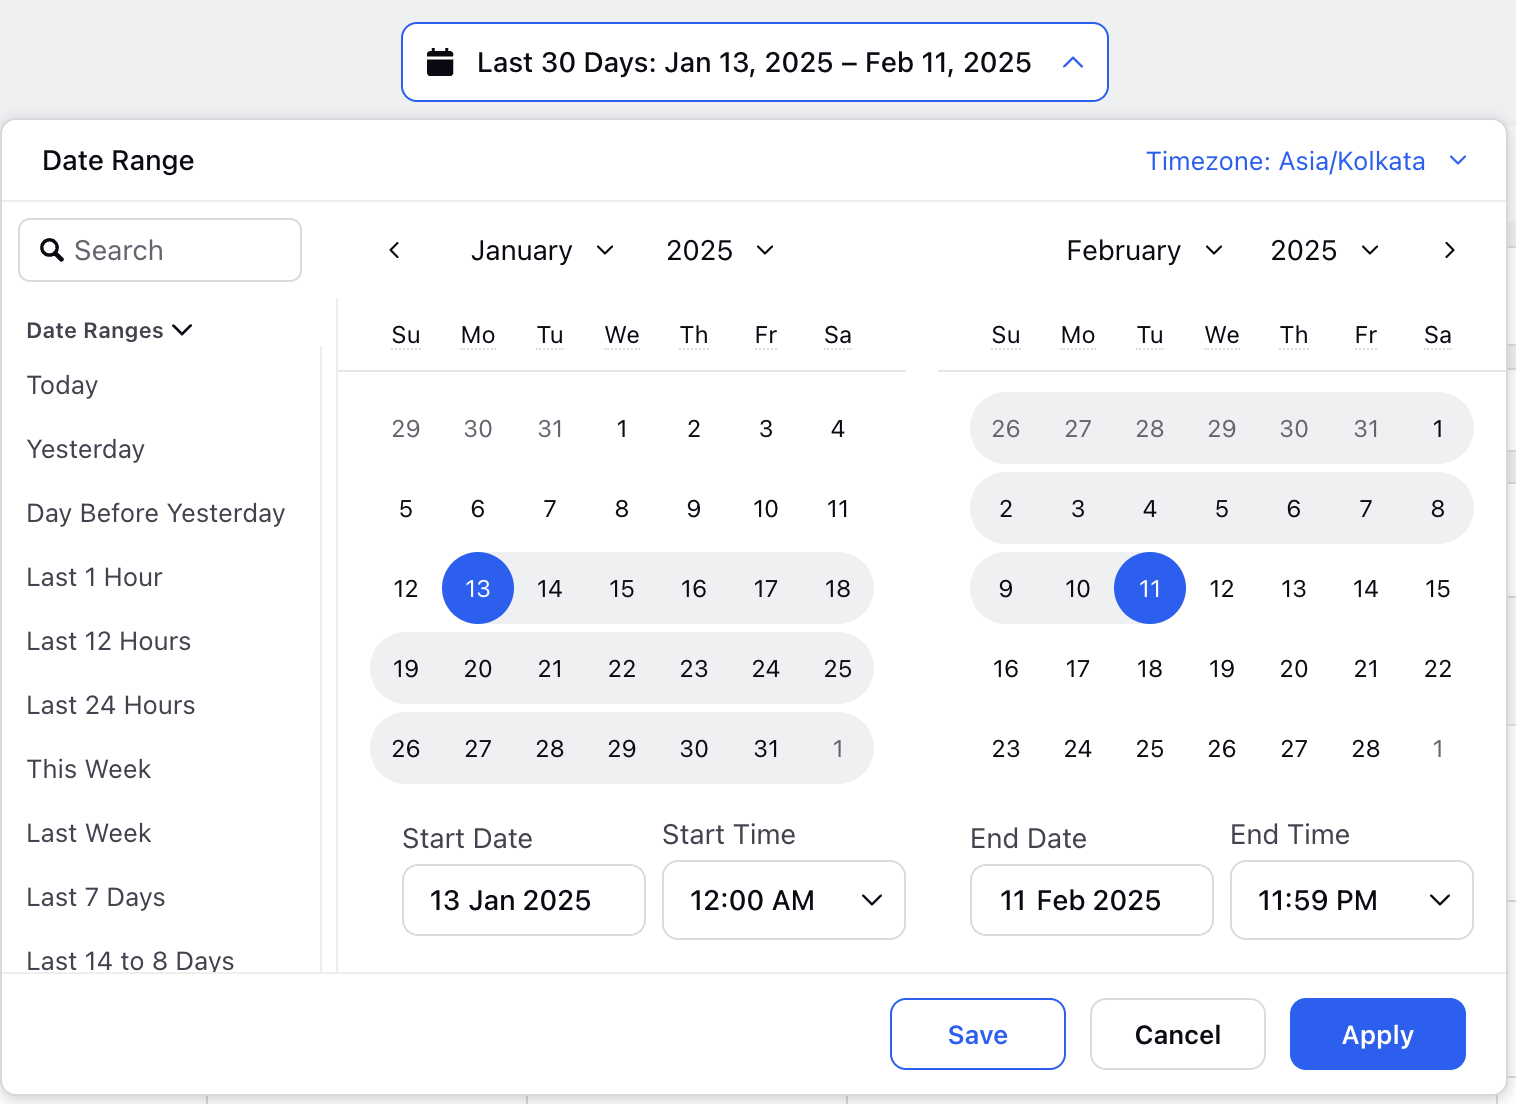
A date range selector allows you to choose the period for viewing data. You can customize the range by setting a start and end date, or select from options like today, this week, last 7 days, last 30 days, last 60 days, last month, last year, or lifetime.