Standard Dashboards
Updated
The Standard dashboards are a part of Service Analytics Data Source , designed to address key industry use cases and KPIs, giving you quick access to relevant insights. They come with out-of-the-box metrics and dimensions to reduce setup time and speed up the delivery of insights. These offerings are designed to empower you with actionable data at your fingertips, enabling faster decision-making and improving efficiency.
Pre-requisites for Standard Services Reporting Dashboard
In order to access these, Standard Dashboard Service Analytics should be enabled.
Navigation Steps
Go to Sprinklr Services > Care Reporting (under Analyse section).
Go to Standard Reports (in the left pane).

Go to Service Key Performance Indicators, which helps to monitor key metrics for agents and queue performance.
There are 3 different types of Dashboards that you can access:
Service-Queue Performance: There are 2 different types of dashboard that you can access here:

Voice Work Queue Performance : Track real-time updates and service level agreements (SLAs) at the queue level to manage priority calls and optimize agent allocation.
Digital Work Queue Performance : Track real-time updates and service levels at the queue level to optimize agent allocation for digital channels.
Service-Agent Performance: There are 3 different types of dashboards:

Digital Agent Performance : Track a comprehensive overview of agent performance across all digital channels combined, providing insights into efficiency and effectiveness.
Voice Agent Performance : Monitor agent performance across inbound and outbound voice channels, along with timecard data, for a complete overview of their productivity.
Agent Performance Time Card : Track individual login and logout activities, along with status changes, and generates reports detailing user activity on the platform. This helps monitor and analyze user engagement and behavior over time.
Self Monitoring Dashboard: There are 3 different types of dashboard that you can access here:

Self Monitoring-Voice : Tracks an individual's performance on the voice channel, with the report displaying data specific to the currently viewing user by default.
Self Monitoring-Digital : Monitors an individual's performance on the voice channel, with the report showing data tailored to the currently viewing user by default.
Self Monitoring-Time Card : Tracks an individual's performance on the voice channel, with the report defaulting to show data specific to the viewing user.
Note: These are standard dashboards and cannot be edited.
Once you access any of the dashboards, you will have the option to clone either the entire dashboard or individual widgets and add them to a custom dashboard.
Navigation Steps to Clone a Dashboard
Go to More Option(...) on the right side top corner of the standard dashboard.
Click Clone.
In the Clone a Dashboard Section Add Name to the dashboard.
Click Clone.

Navigation Steps to Clone a Widget
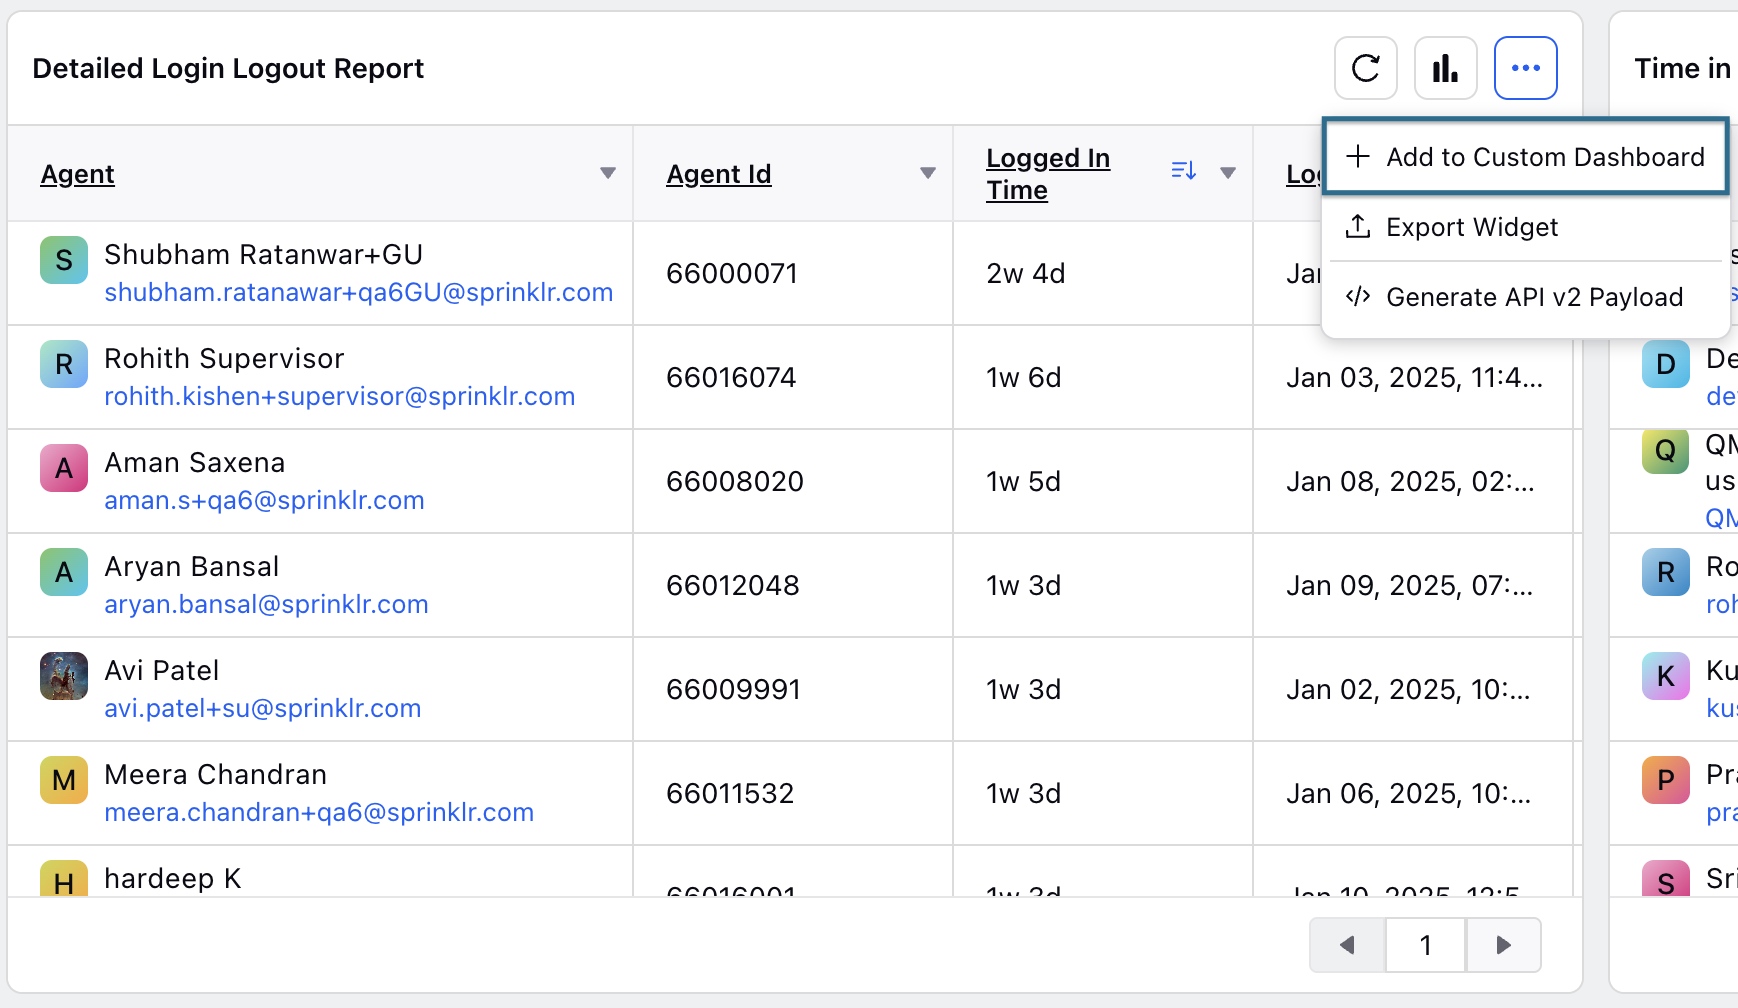
You can even add a widget to a Custom Dashboard without having to add the entire dashboard.
Click Horizontal Ellipses(...) on the Widget.
Click + Add to Custom Dashboard.

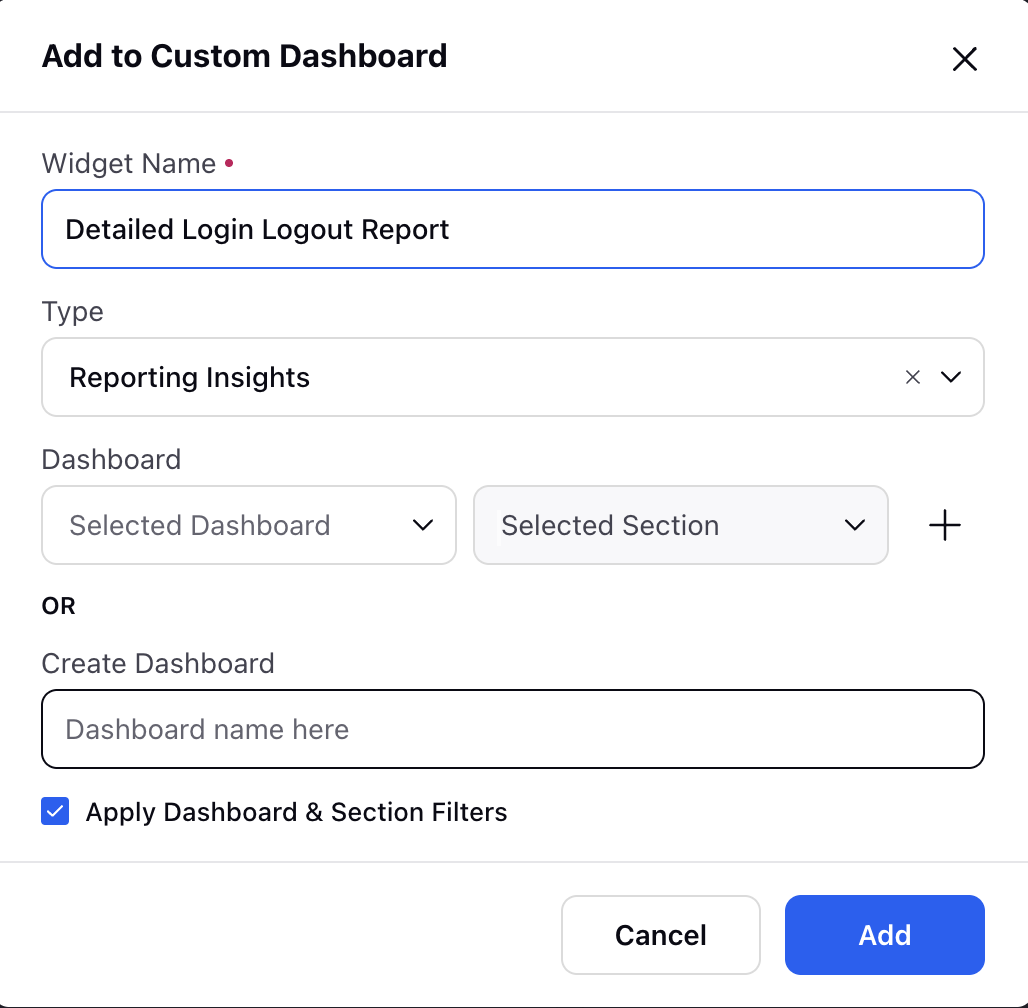
Fill details in Add the Custom Dashboard Section:
Widget Name: Add Name of the widget.
Type: Select of Reporting.
Dashboard: Select the dashboard and select the section of the dashboard.
Or you can even Create a New Dashboard by adding a Dashboard Name
Check the box to Apply Dashboard and section level filters.

Click Add.
Governance
To access the Standard Dashboards, you must have access to the Service Module, as these dashboards are only available through it. Attempting to access them through other modules, such as Sprinklr Insights, Sprinklr Social, or Sprinklr Marketing, will not grant access.