Social accounts help any brand to build and increase their brand awareness by sharing boosted or organic content and responding to fan comments thereby building a community of loyal customer base. Thus, it is really important for brands to analyze the performance of their social accounts, benchmark them against competitors and find areas of improvement in their social media strategy and customer engagement.
To access the Compare Brand Performance dashboard
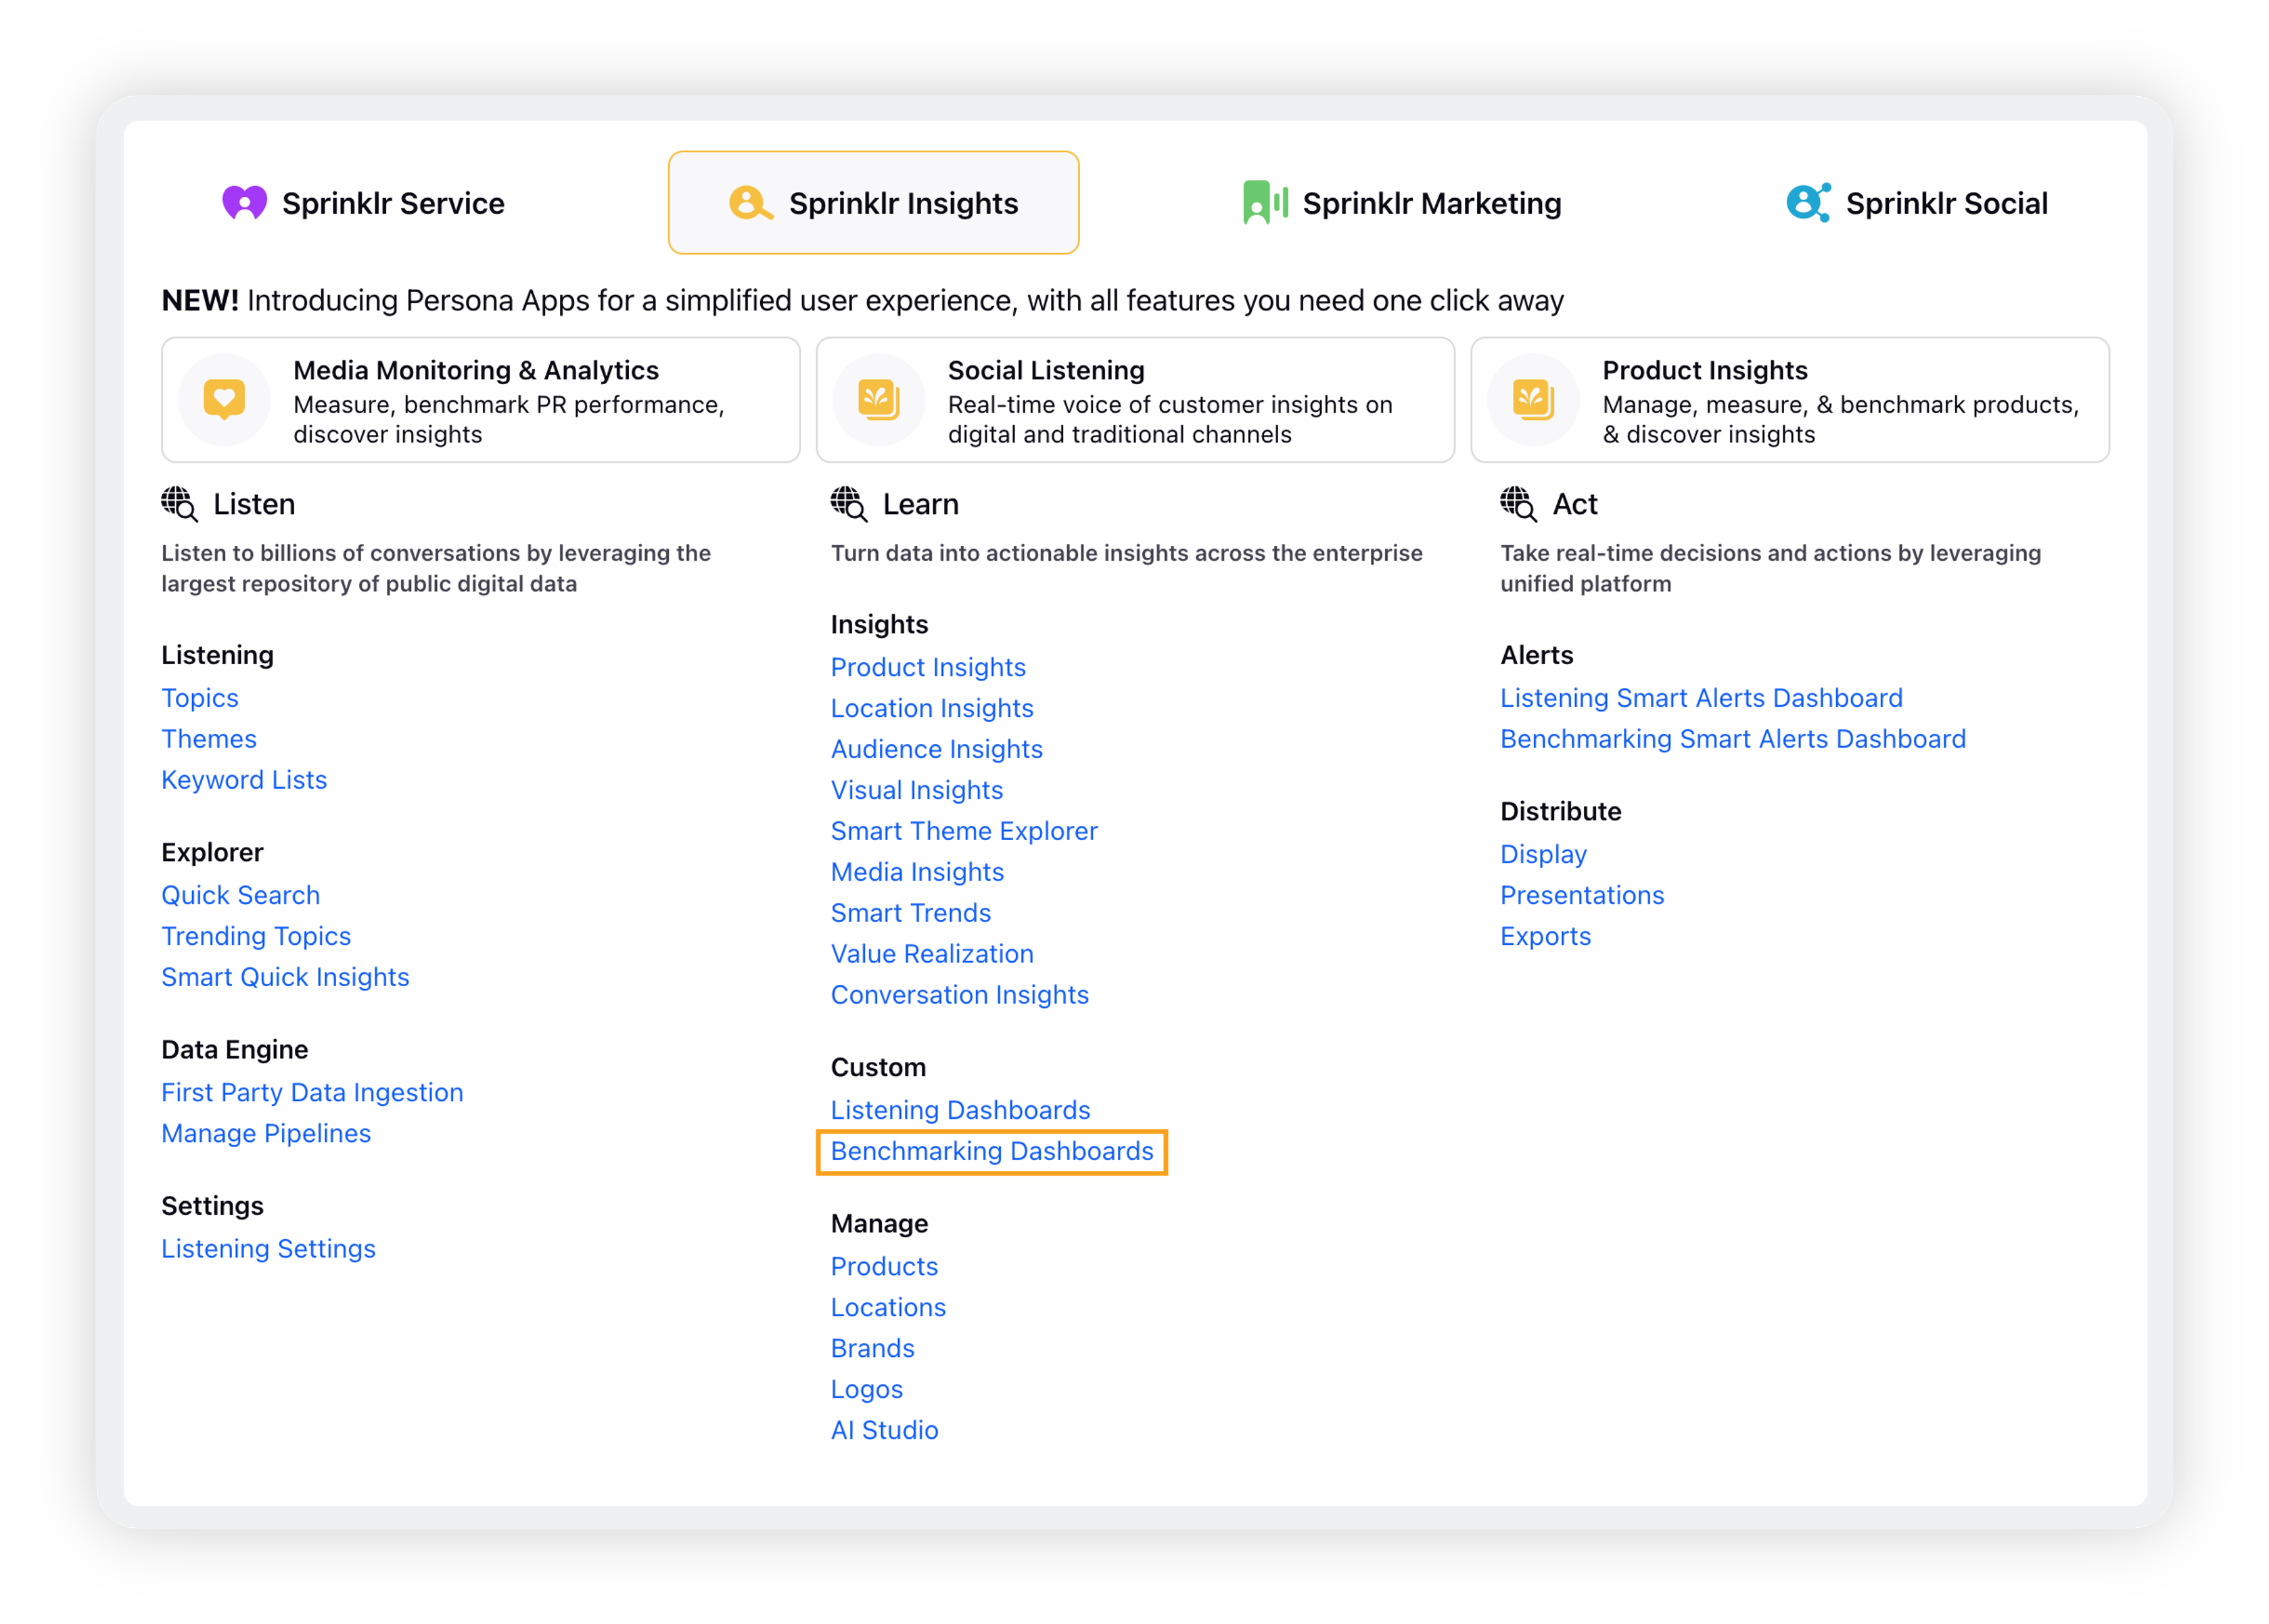
Click the New Tab icon. Under Sprinklr Insights, click Benchmarking Dashboards within Learn.
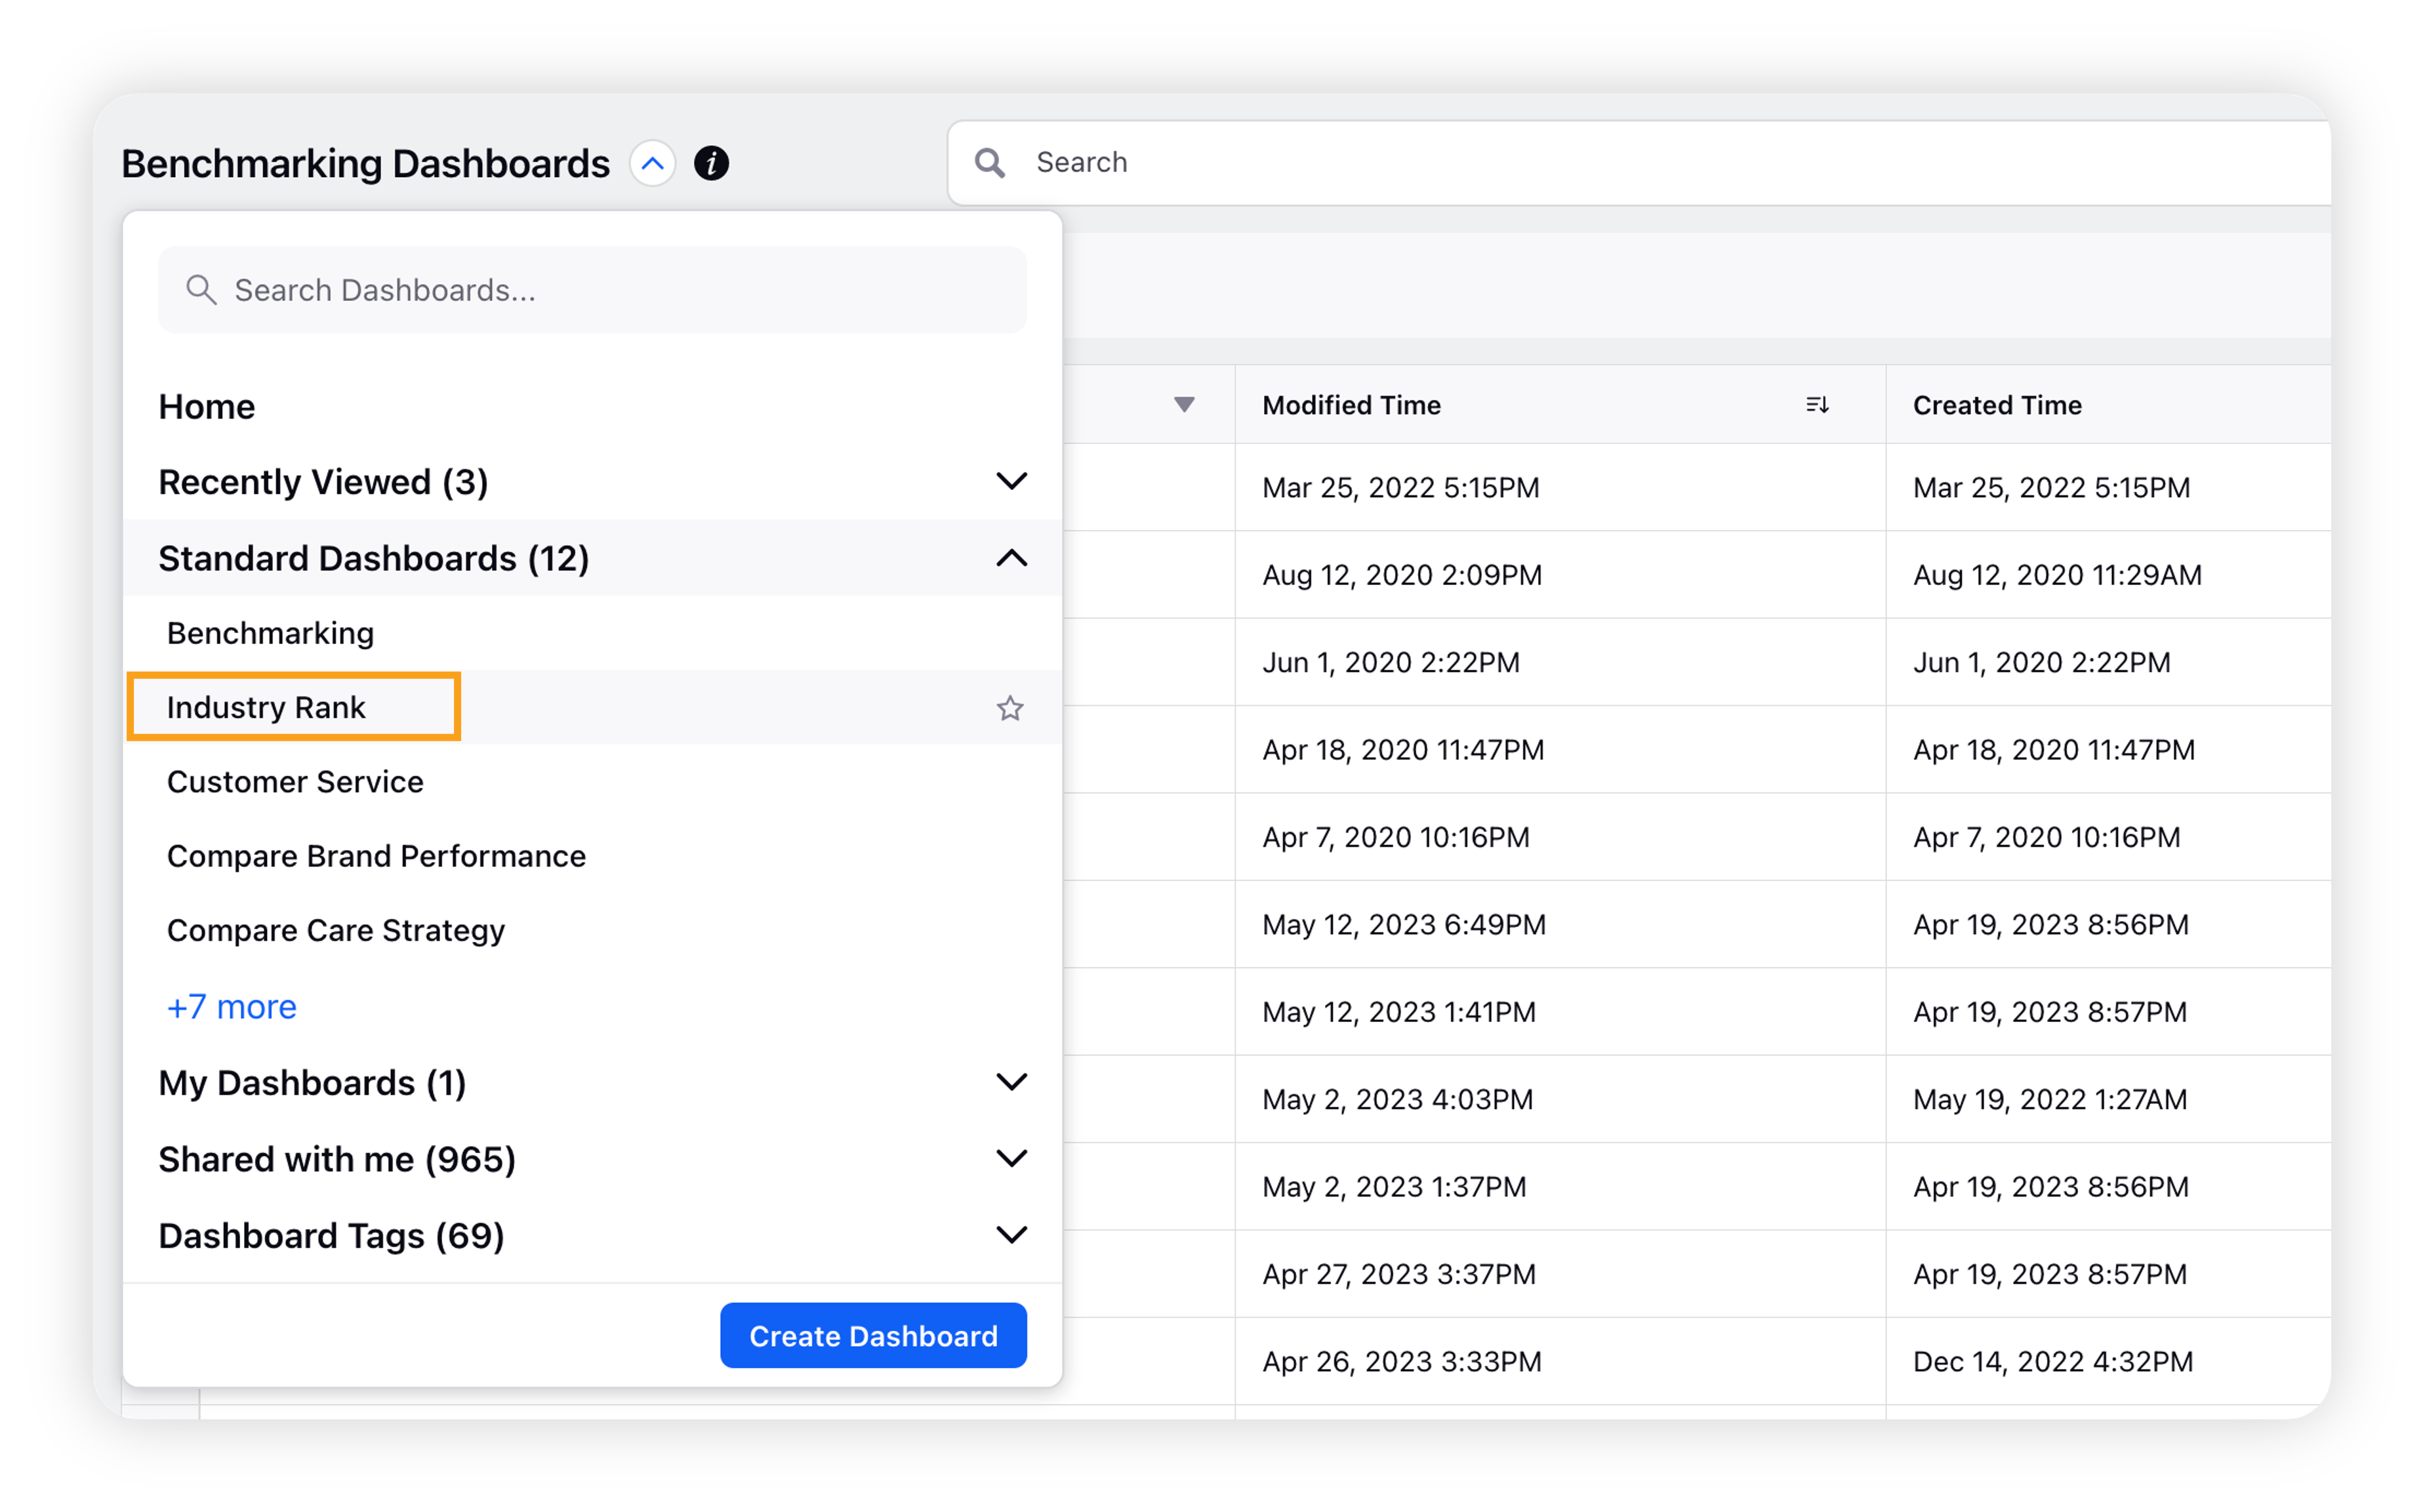
On the Benchmarking Dashboards homepage, click the dropdown icon and go to Standard Dashboards.
Expand the Standard Dashboard options and select Compare Brand Performance.
Also, Standard dashboards can be accessed and filtered out in the Benchmarking Home using the Type filter. Select Dashboard to display only the standard dashboards.
Relevant Filters to fetch data into the dashboard
Add relevant brands/brand groups to populate the data in the widgets.
Use cases for the Compare Brand Performance dashboard
Let’s dive into each section of this standard dashboard –
This section of the dashboard helps you visualize what are the most active, engaging and followed brands in your industry and also provides you with a scorecard view of where your brand stands compared to the competitors.
This section provides insights into the theme, tone, brand objectives, and customer stages targeted in brand content. These are detected by AI models.
Identify themes of content that are getting maximum results and compare the same with the themes and tone of the content which your brand is publishing. This helps you bridge the gap between you and your competitors.
A quick view on what is the key objective of the brand posts of your and your competitors will land you in a better position in terms of understanding the objectives driving the most engagement.
This section will help brands understand how your social accounts are performing (in terms of engagement or reach) across social channels. The insights provided in this section will help in improving social strategy.
Benchmarking's Paid Post Detection uses AI-powered models to determine if the posts are likely to be paid or organic. The model considers engagement trends, reach trends, and media types of posts. This section of the dashboard shows the paid vs organic posts split by brand. Using this, brands can understand how competitors are investing in boosted/ paid content and using this insight, brands can improve their overall paid strategy & investment decisions.
The effectiveness of a brand is greatly impacted by how quickly marketers react to customer input. According to 90% of brand marketers polled, responsiveness and the capacity to address demands and comments are essential components of a positive customer experience.
This section helps brands benchmark how their SLAs fare against that of competitors and use this insight to improve overall response rates & SLAs, thereby improving customer satisfaction and loyalty.
The voice of the customers is the component of customer experience that mainly focuses on customers’ needs, expectations, and feedback.
This section of the dashboard provides insights about the audience (followers) of the brands, the growth of the followers count, brand reputation, top themes discussed by the audience about the brand, and the share of the voice of the brand amongst its competitors. It also provides insights about the trend of fan messages and also filters the fan messages worth engaging with. This classification of fan messages whether they are engageable or not is done by sprinklr AI models.