Supervisor Comprehensive Reporting Dashboard - Digital
Updated
This report provides a consolidated view for Supervisors or Team leads on their agents overall performance including their Login-Logout activity, Case Assignments, Productivity, Macro Application, Handling and Response SLA, Escalations and CSAT.
Note: User and User Manager mapping is required. 'User / Agent / Brand response by user' should be filtered with 'All reportees', for Supervisors to view the data of all the agents. 'User / Agent / Brand response by user' should be filtered with 'Direct reportees' for Team Leads to view only their reportees data.
Team Hygiene
(Agent Time Utilization) - This section details the Login - Logout activity, Status Assignment & Un-Assignment activity of agents.
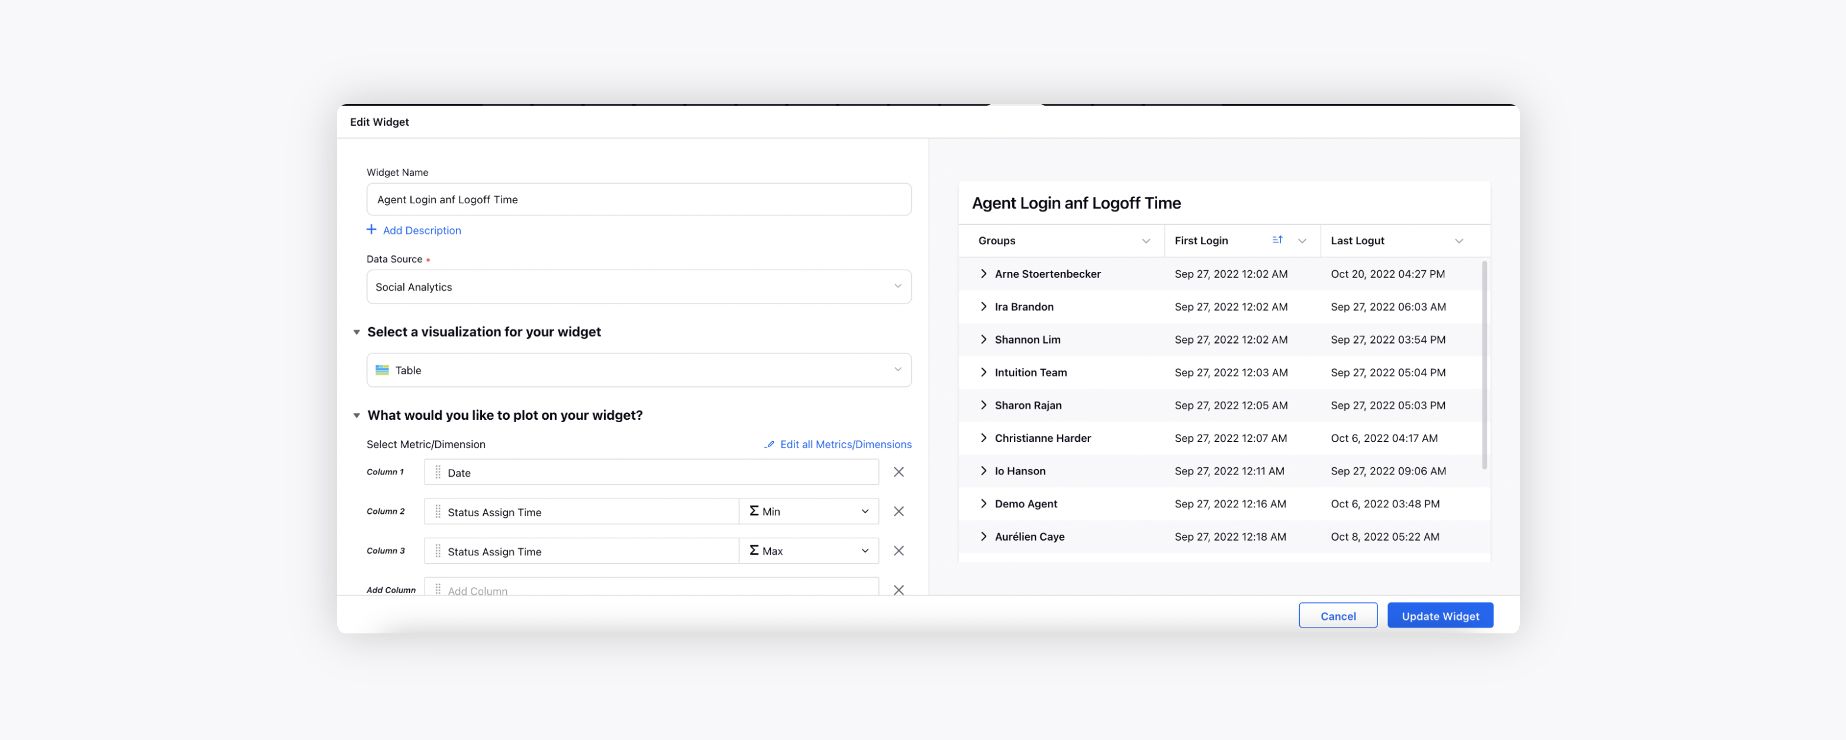
Agent Login and Logoff Time
Date: The calendar date on which the activity occurred.
Status Assign time (Min): First time the status was assigned to the user for that time aggregation.
Status Assign Time (Max): Last time the status was assigned to the user for that time aggregation.
Agent Login Time Log
Agent: Name of the agent.
Time in Login Status: Total time spent in the logged-in status.
Status Assign Time: Time when the status was assigned to the user.
Login Status Remove Time: Time when the logged -in status was removed by the user.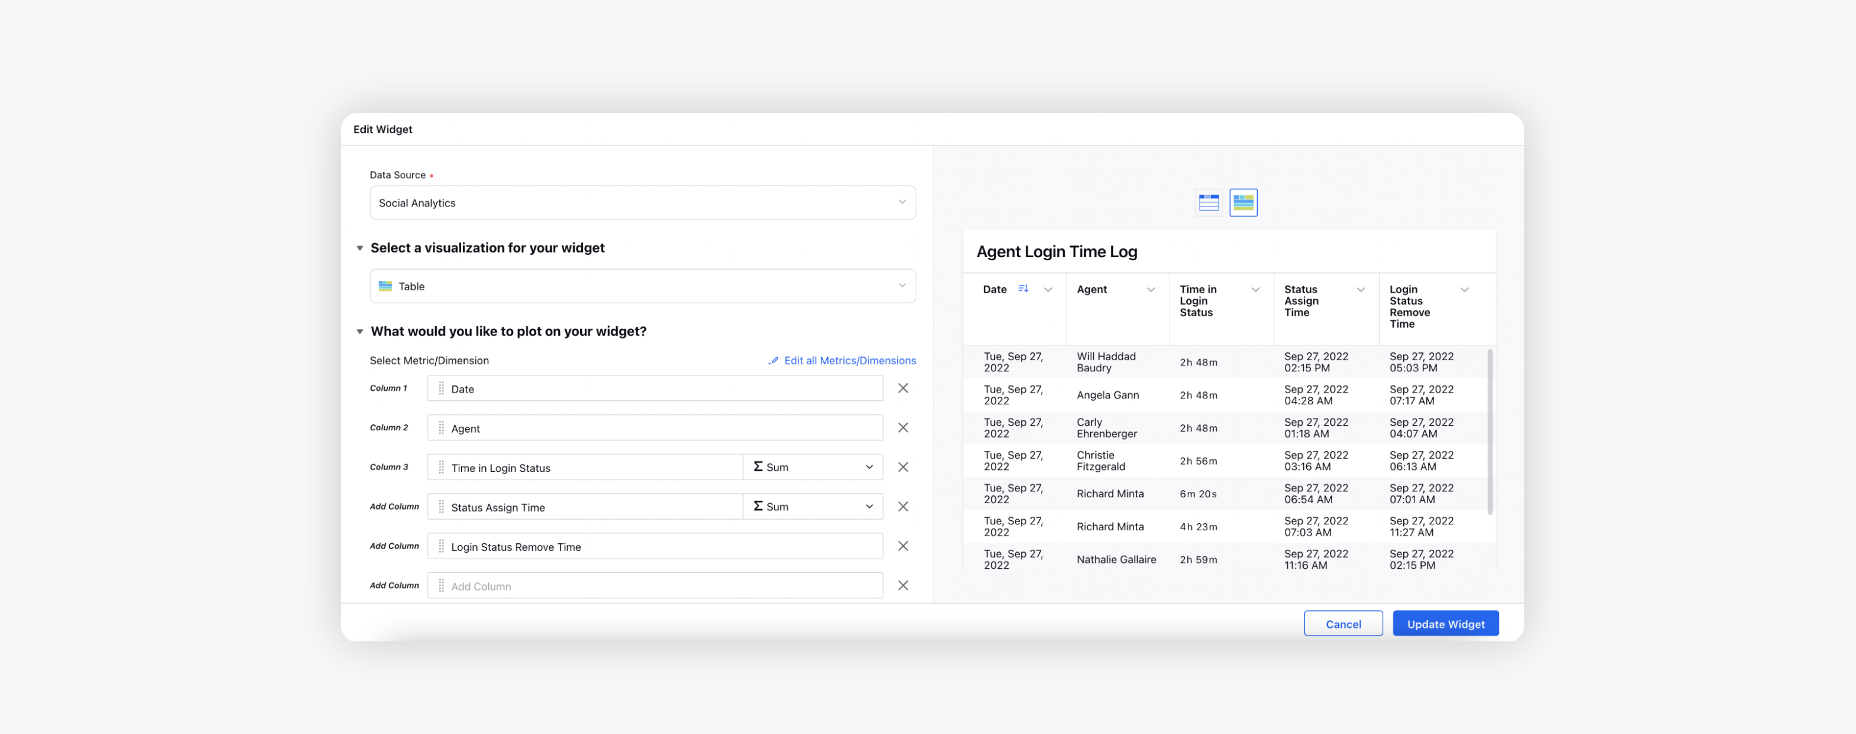
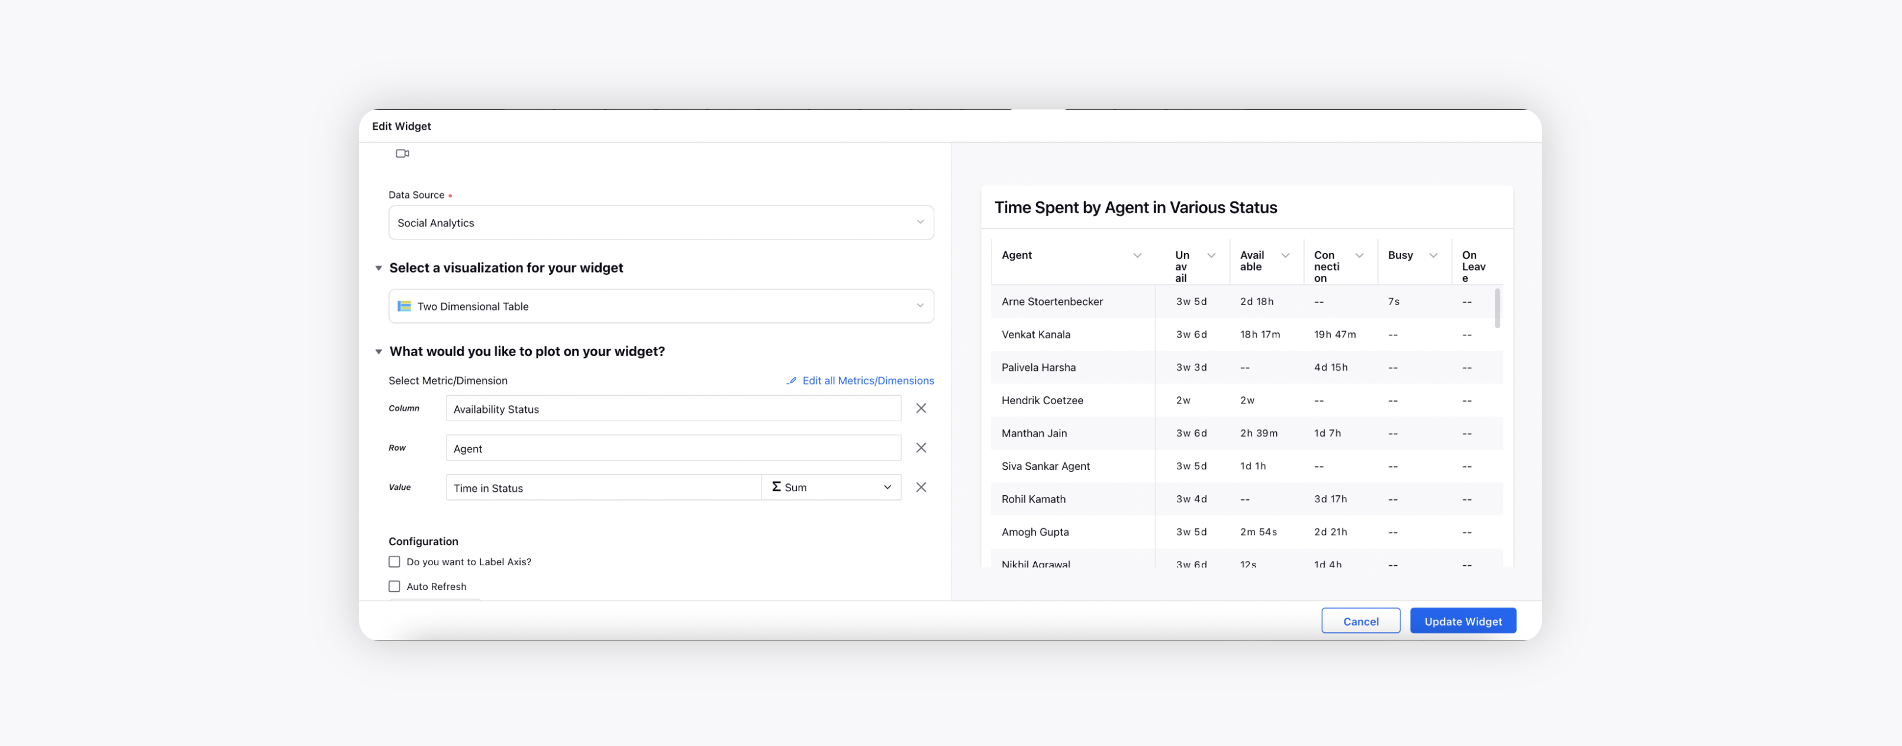
Time Spent by Agent in Various Status
Availability Status: Different availability statuses configured in the console.
Agent: Name of the agent.
Time in Status: Total time spent in that status.
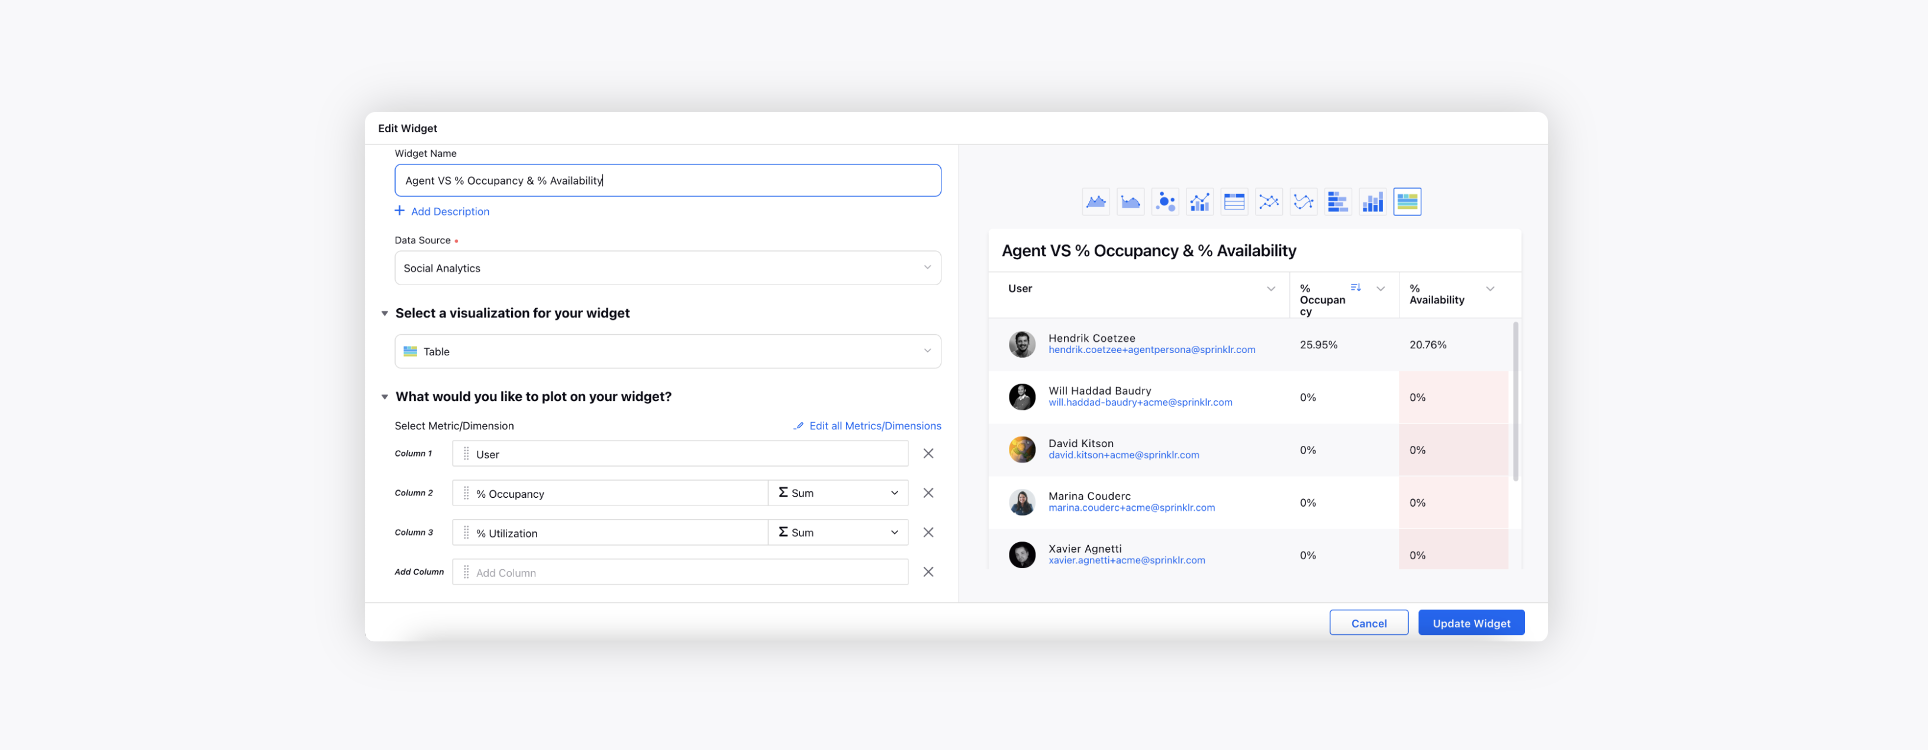
Agent VS % Occupancy & % Availability
% Occupancy - Gives productive hours of Agent (Time Spent with any Case Assigned/Time for which Agent was in Available State).
% Availability - Time for which Agent was in Available State/Total logged in time Time for which Agent was in Available State is a Custom Metric select the status which are considered to be available for the agent. Total Logged in Time is the custom metric containing Available & Break Status.
Team Productivity
This section details the productivity of agents based o the response time and the macro application time.
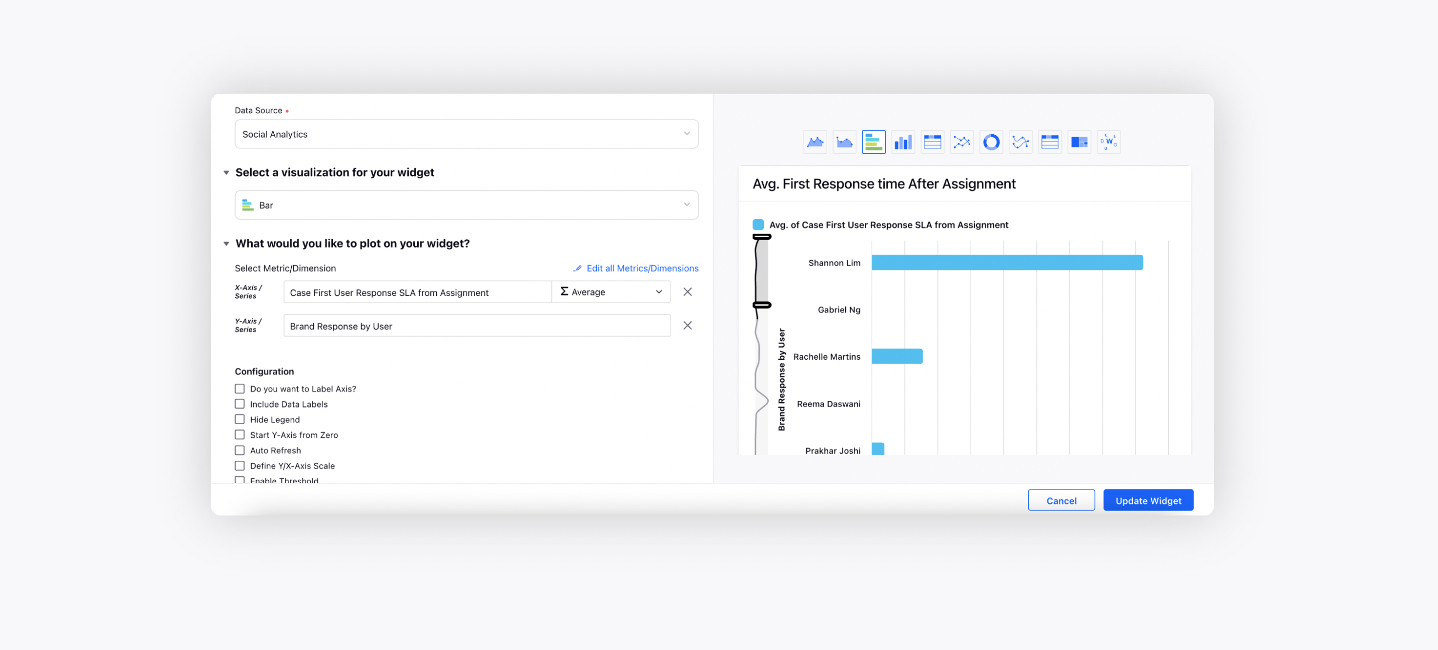
Avg. First Response time After Assignment
Case First User Response SLA from Assignment: Time difference between the users first response from the time the case was assigned to that particular user.
Brand Response by User: The name of the user who has responded to the case.
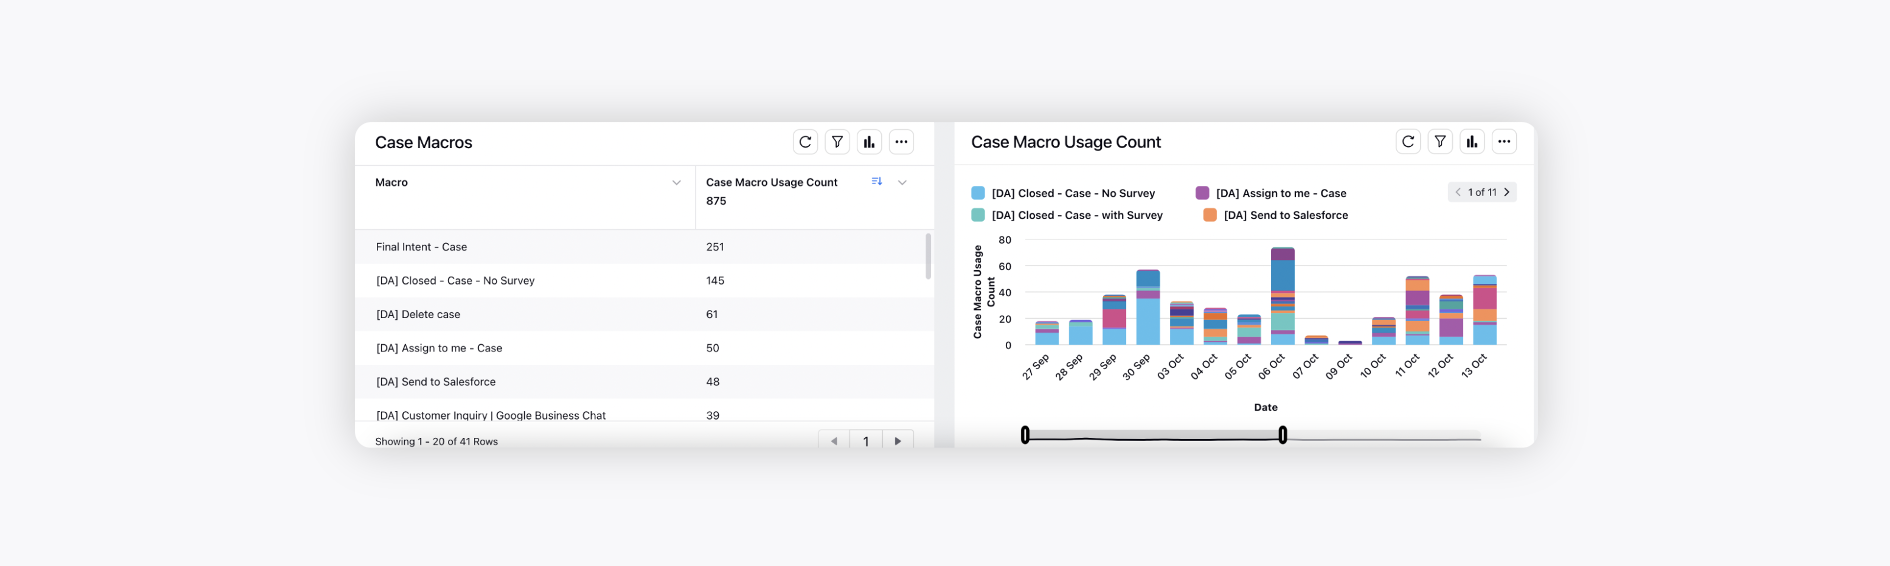
Top Agents by Case Macro count
User: Name of the agent/ user.
Case Macro Usage Count: Total number of macros used on the cases.

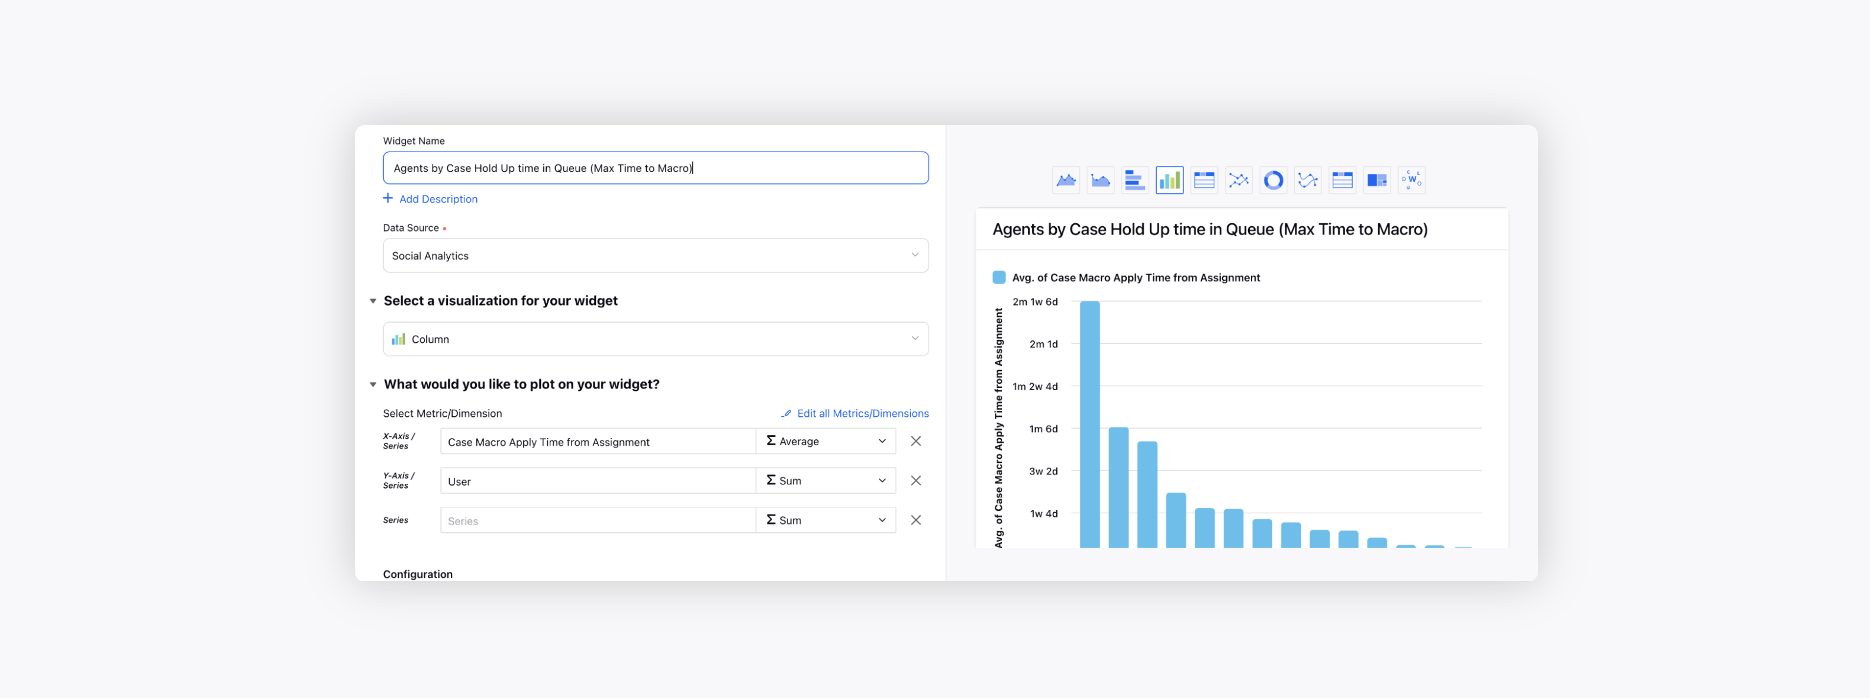
Agents by Case Hold Up time in Queue
Case Macro Apply time from Assignment: Average of the time difference between the macro apply time and the Case assignment time to an agent.
User: Name of the agent/ user.
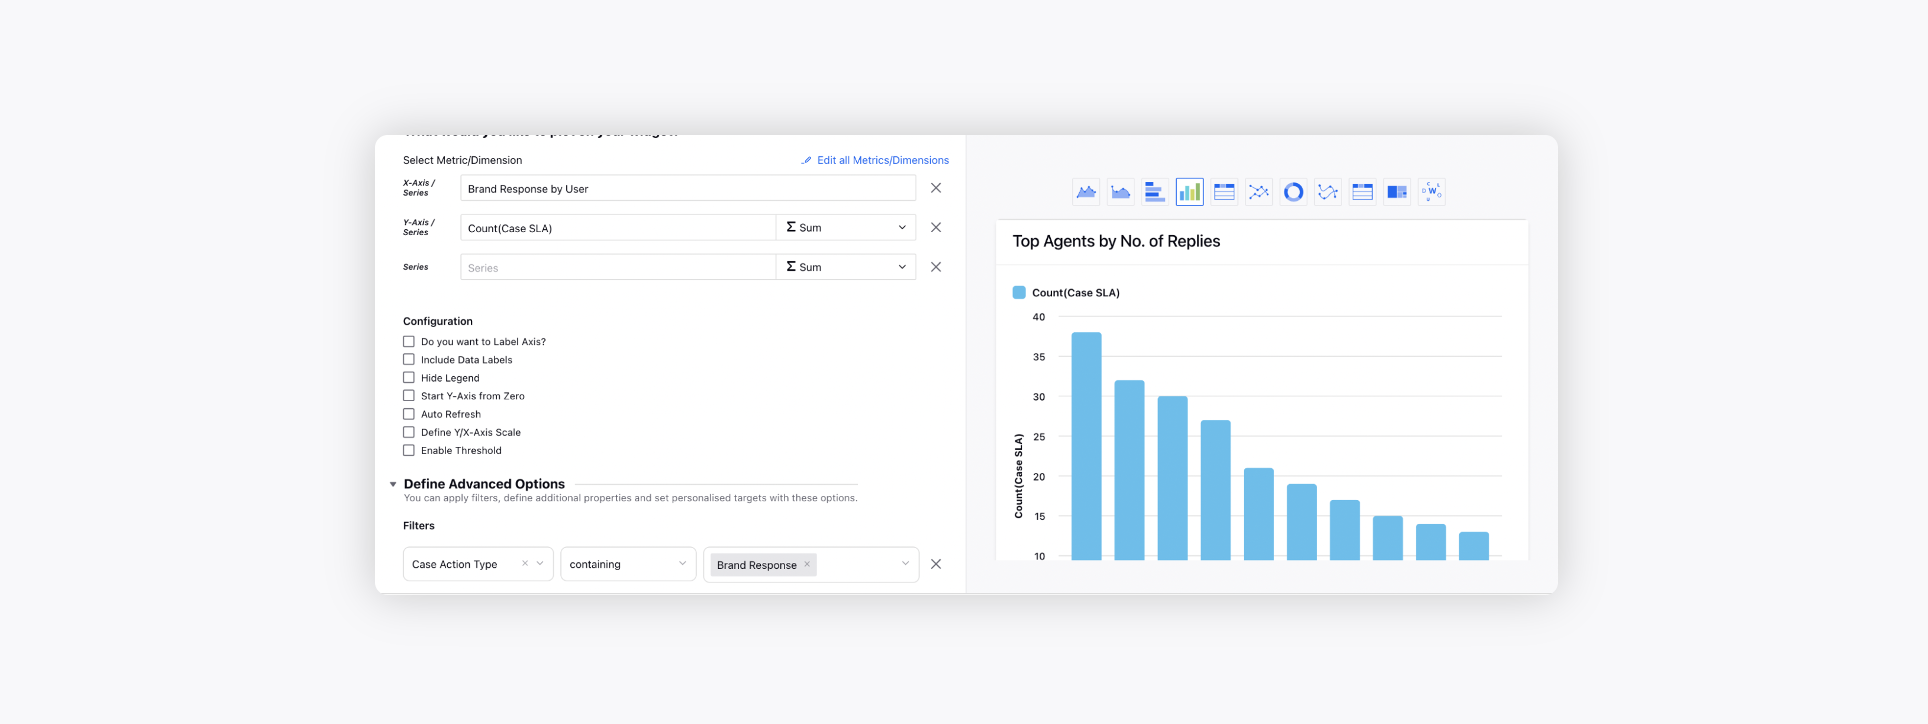
Top Agent by No. of Replies
Brand Response by User: The name of user who has responded to the case.
Count (Case SLA): Number of brand responses shared in the cases.
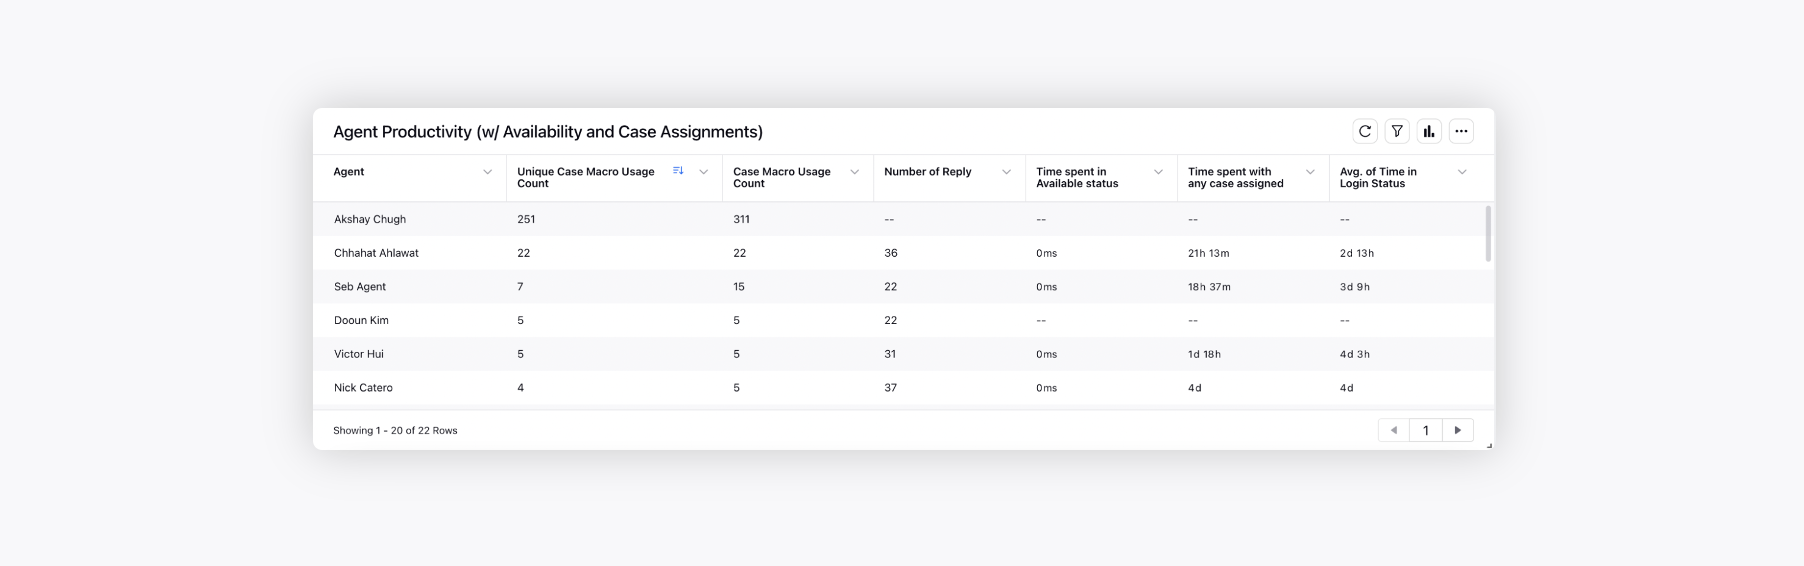
Agent Productivity (Availability and Case Assignments)
Agent: Name of the agent/ user.
Unique Case Macro Usage Count: Number of unique cases on which macro was applied.
Case Macro Usage Count: Total number of macros used on the cases.
Number of Reply: Number of brand responses shared in the cases.
Time spent in Available status: Overall time spent in available status by the agent.
Time spent with any case assigned: Time spent with any case assigned to the user during the available status.
Avg. of Time in Login Status: Average of Time in Login Status.
Team Performance
This section details the case assignments across channels, SLA & case handling time and macro application time stats.
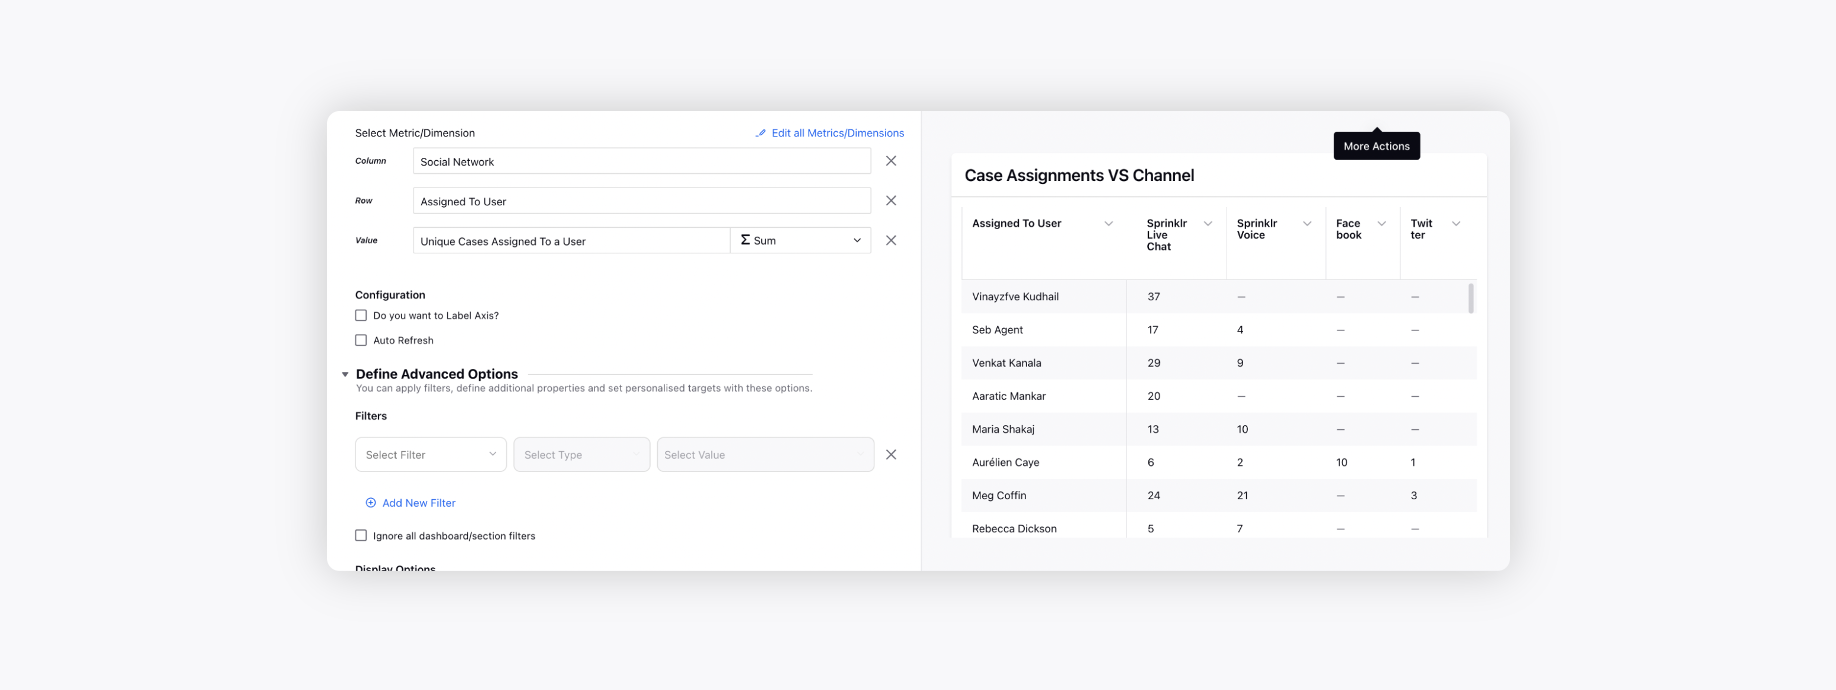
Case Assignments VS Channel
Social Network: The name of the social network on which the case was associated/came.
Assigned to user: The name of user/agent to whom the case is assigned.
Unique Cases Assigned to user: Number of unique cases that are assigned to a user (in case same case being multiple assigned to a user - count will be 1 here because the case id is unique).
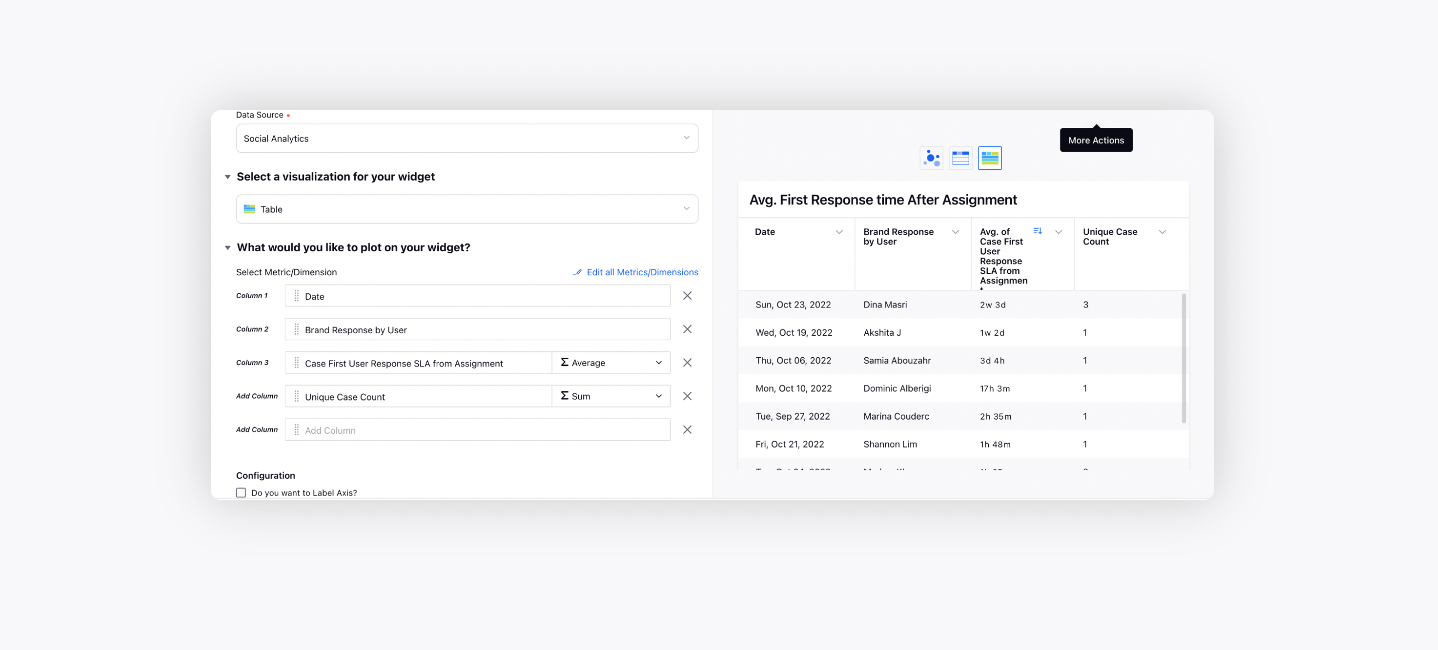
Avg. First Response time After Assignment
Date: The calendar date on which the activity occurred.
Brand Response by User: The name of the user who has responded to the case.
Avg. of Case First User Response SLA from Assignment: Average of the time difference between the users first response from the time the case was assigned to that particular user.
Unique Case Count: Unique number of cases (unique on case ID).
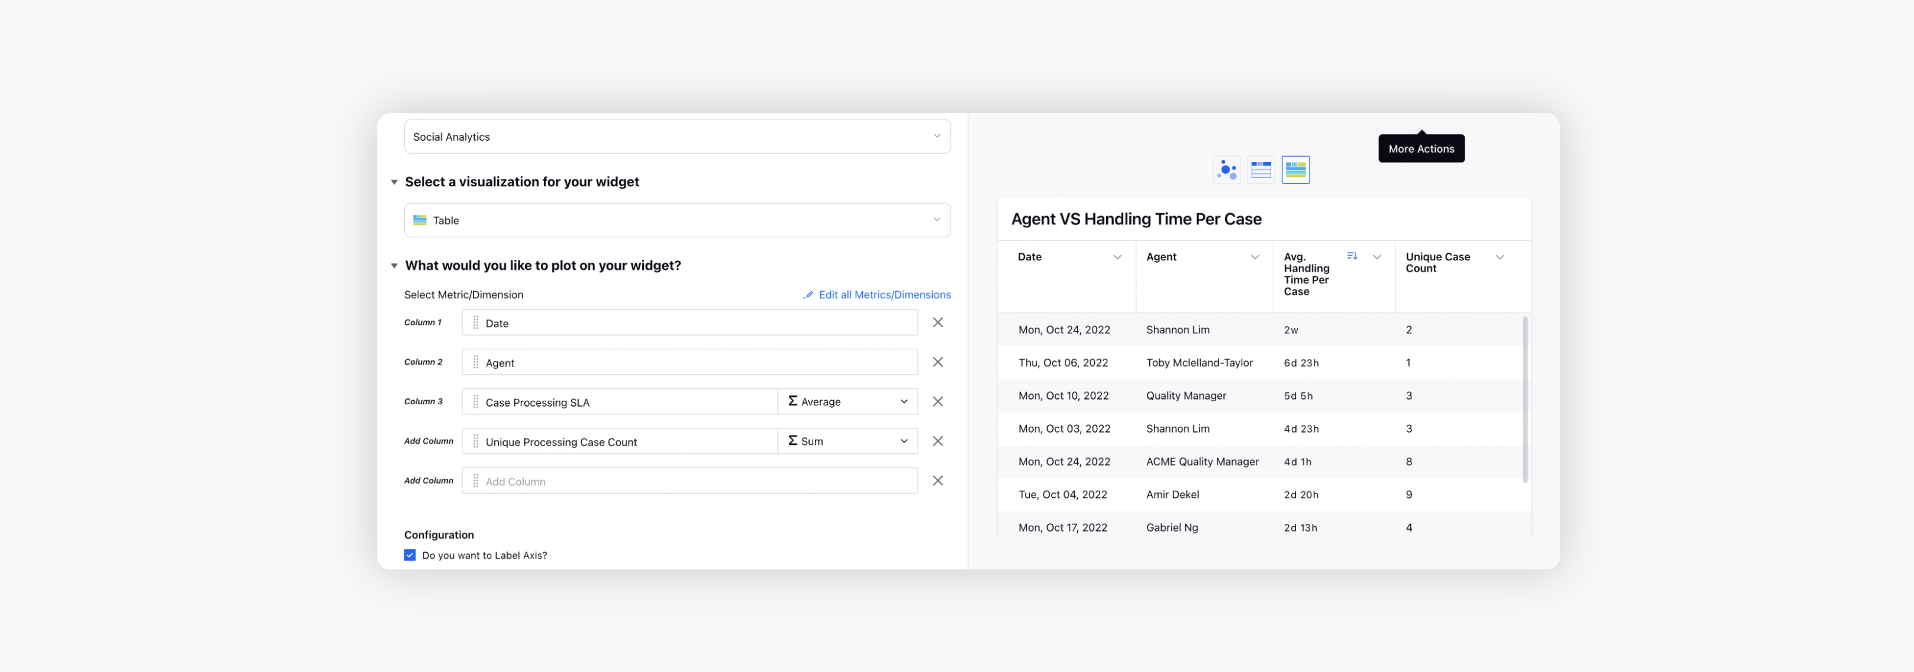
Agent VS Handling Time Per Case
Date: The calendar date on which the activity occurred.
Agent: Name of the agent/ user.
Avg. Handling Time Per Case: Time for which the processing clock was opened in the third pane for the case.
Unique Case Count: Unique number of cases (unique on case ID).
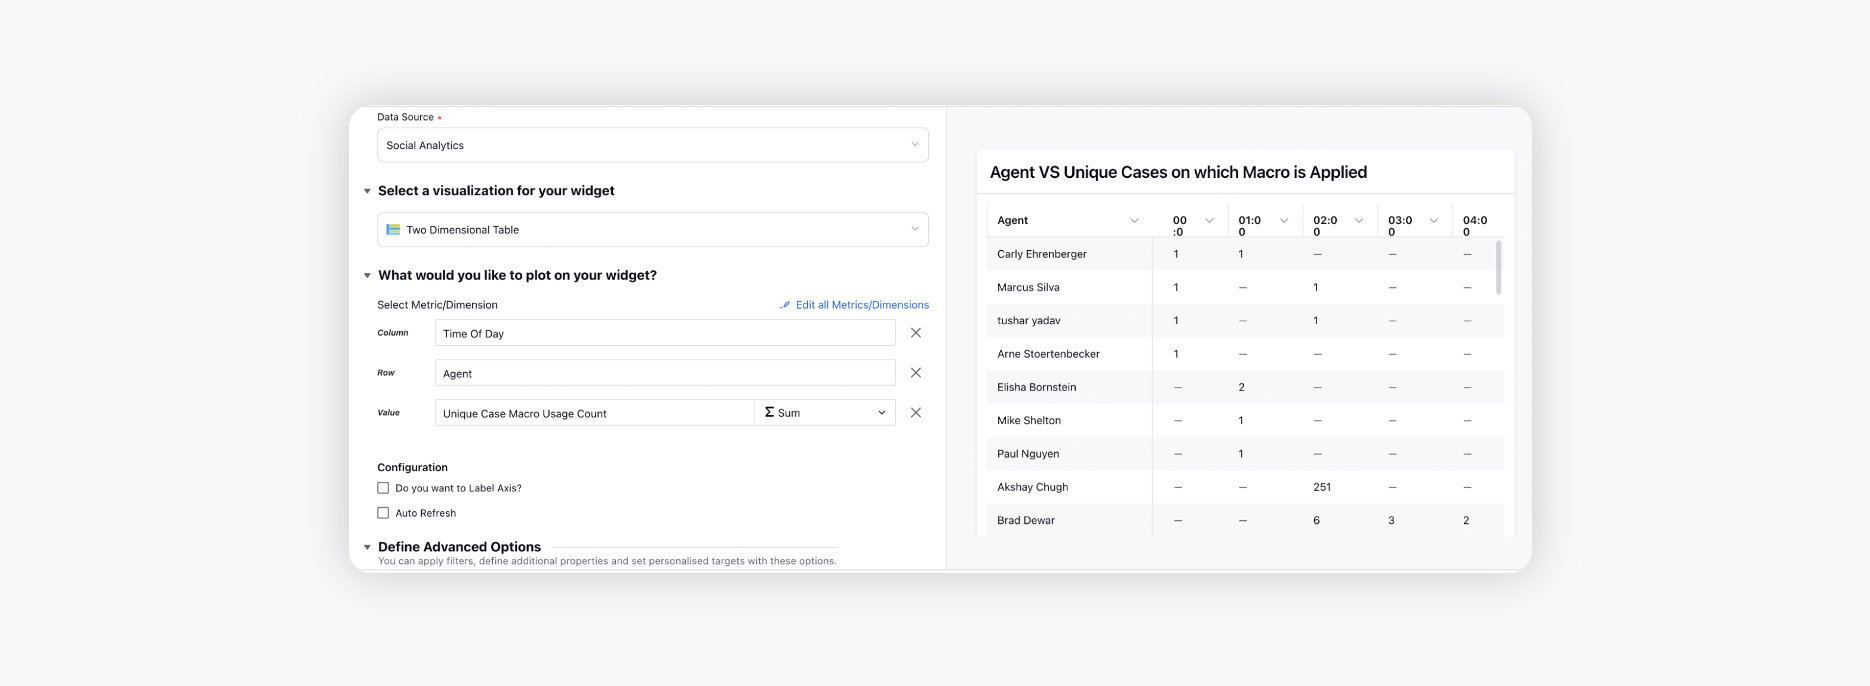
Agent VS Unique Cases on which Macro is Applied
Time of Day: The hour of the day on which the activity occurred. This is generally displayed according to the 24 hour clock and should display based upon the timezone of the Sprinklr user.
Agent: Name of the agent/ user.
Unique Macro Usage Count: Number of unique cases on which macro was applied.
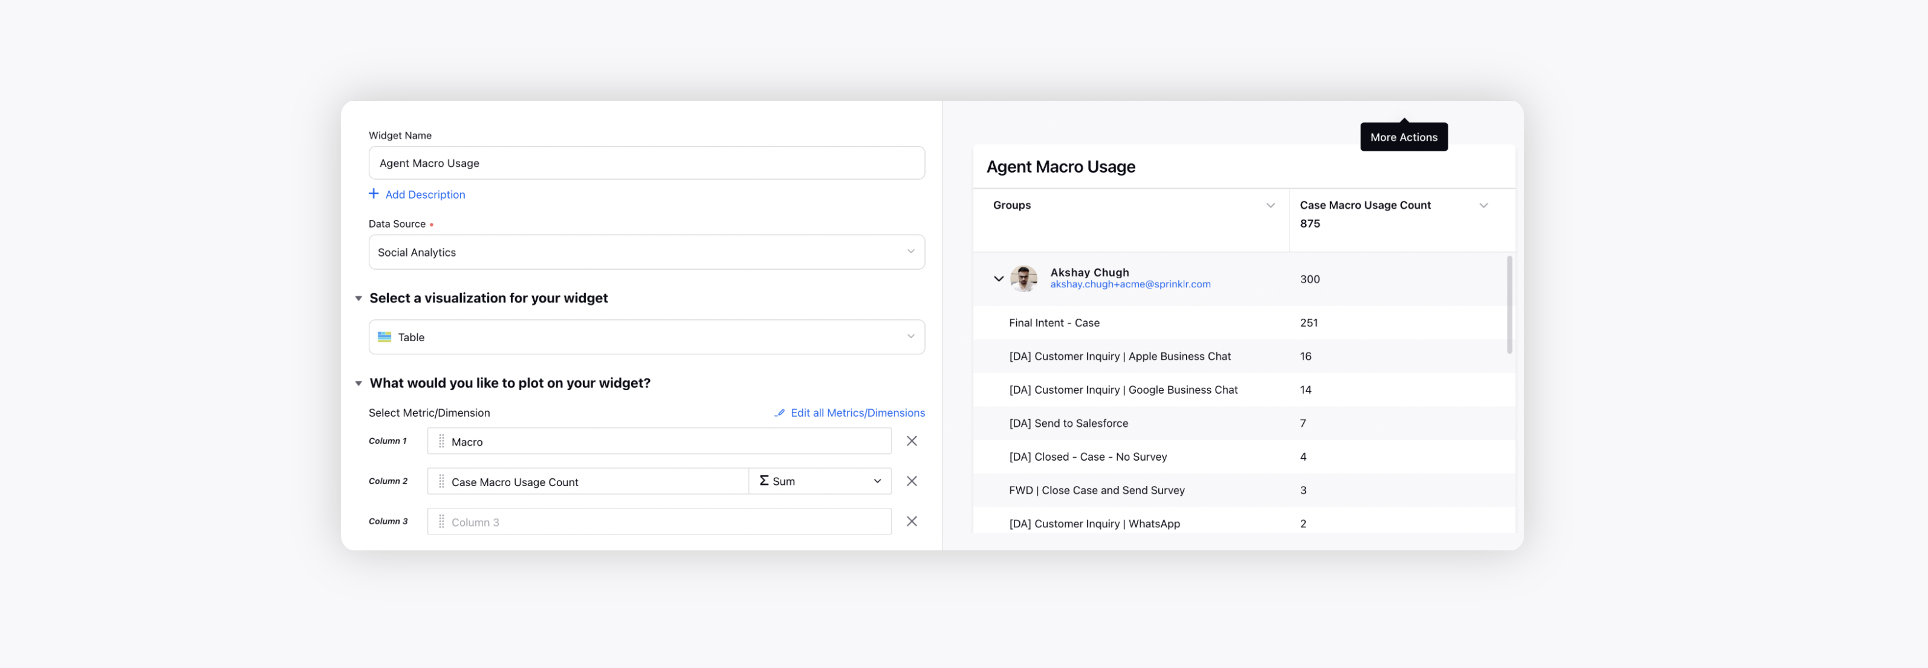
Agent Macro Usage
Macro: Name of the macro used.
Macro Usage Count: Total number of macros used on the cases.
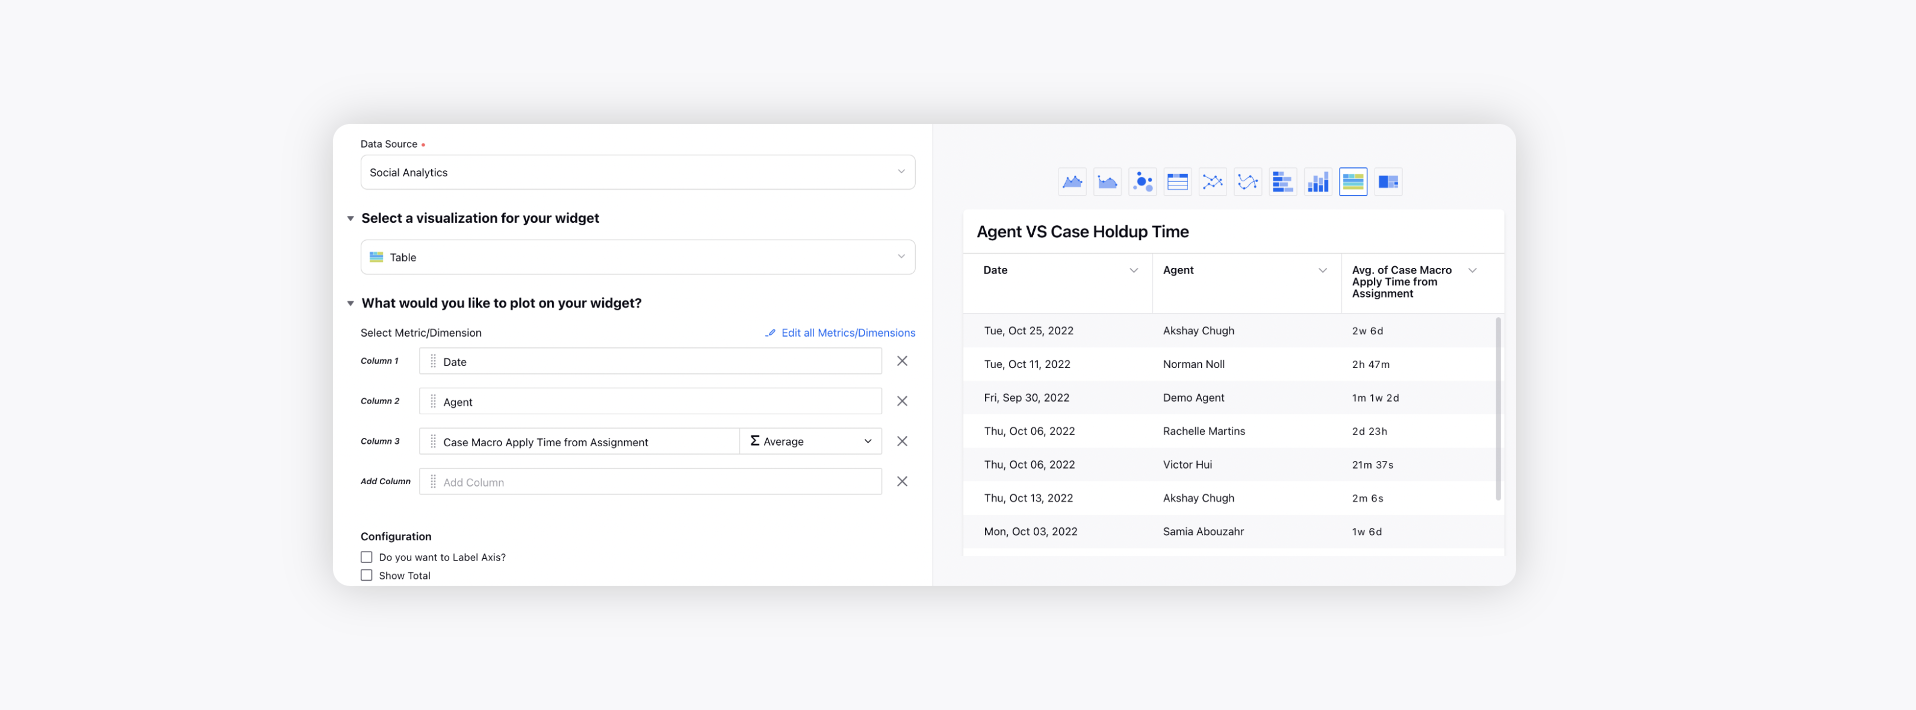
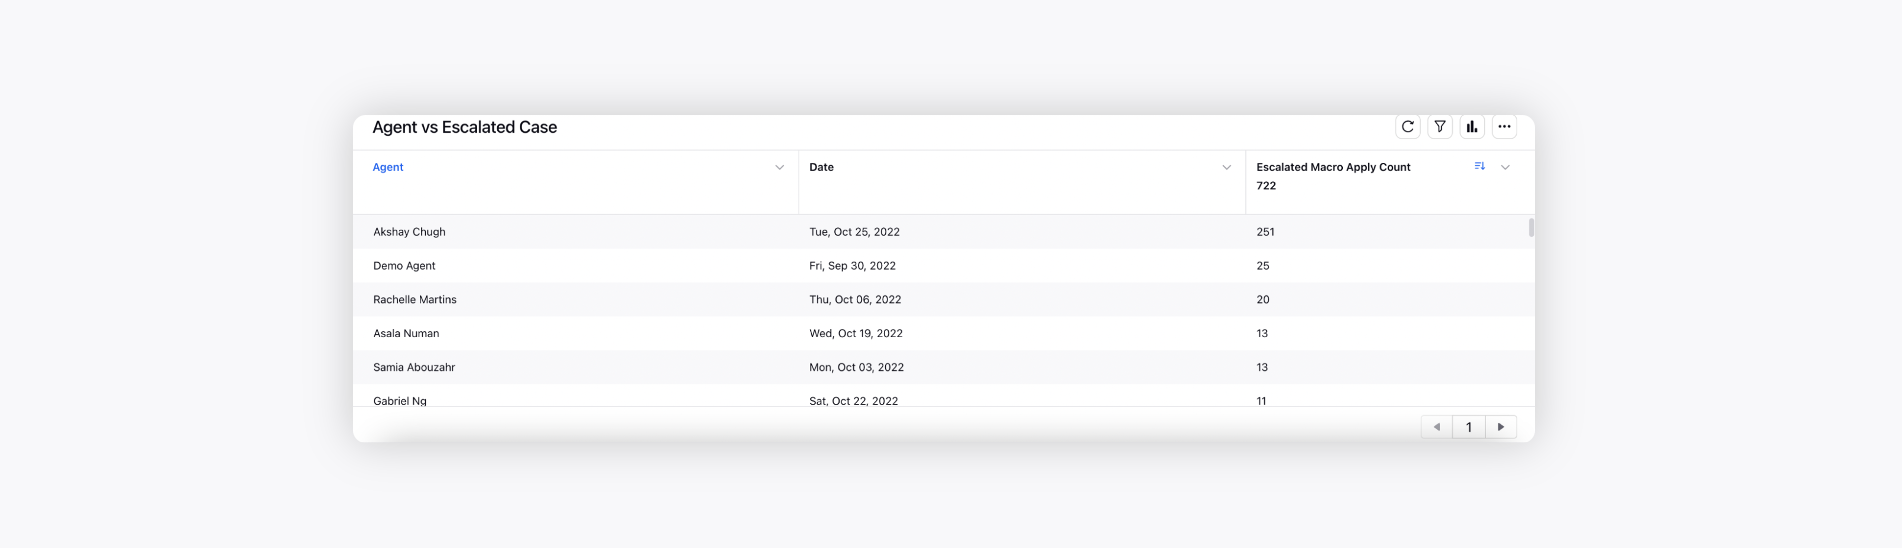
Agent VS Case Hold Up Time
Average Case Macro Apply Time from Assignment: This measures the time difference between the time when user/agent was assigned to the case and when the macro was applied on the case.
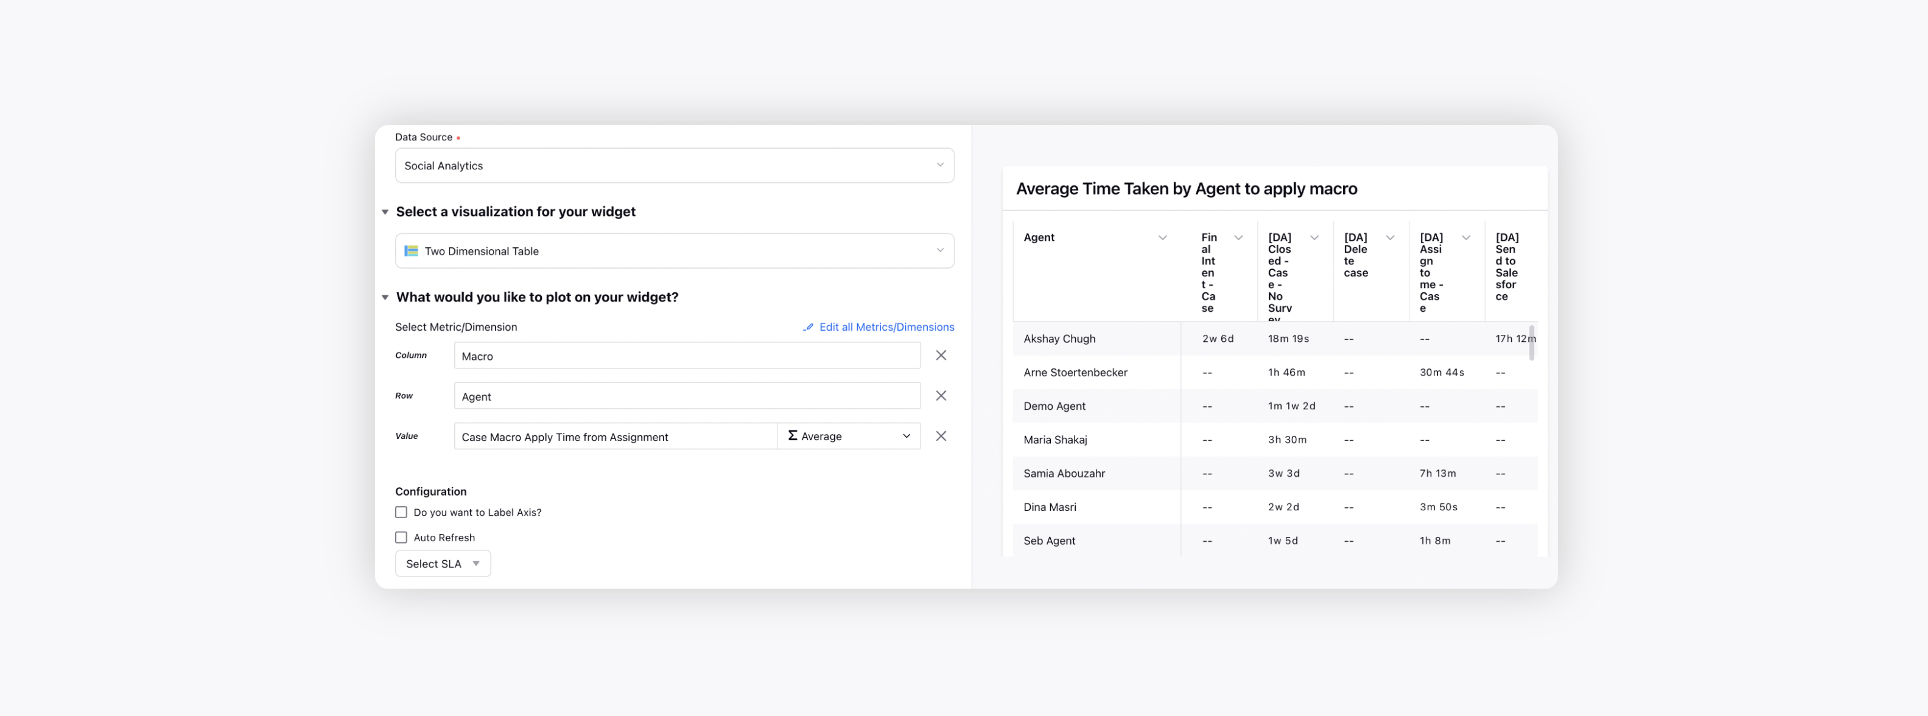
Average Time Taken by Agent to apply macro
This two dimensional table records the average time taken by each agent for all the macros applied by them.
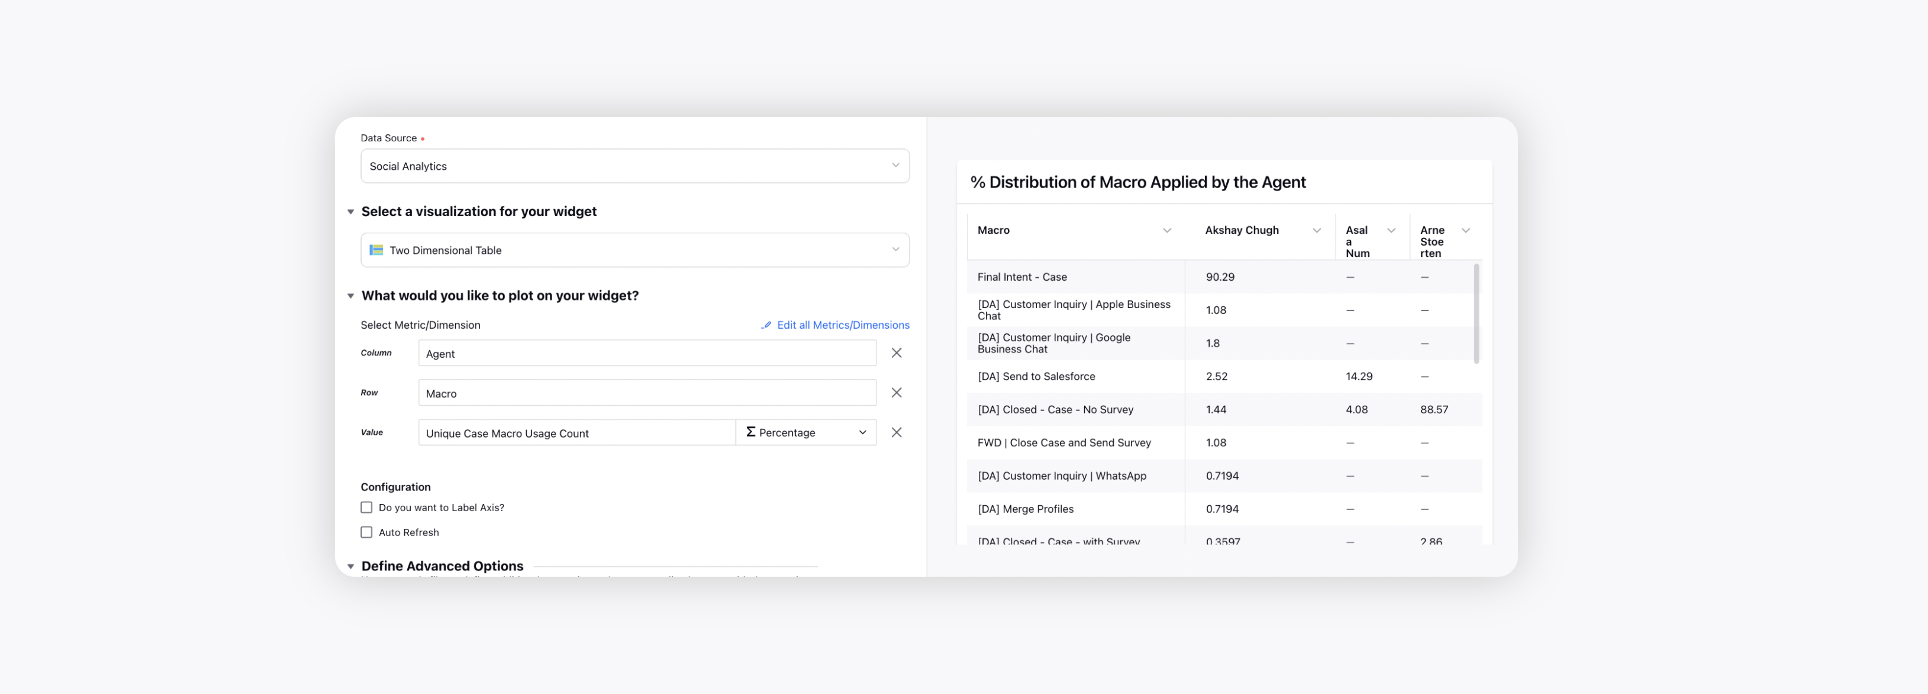
% Distribution of Macro Applied by the Agent
This two dimensional table records the % Macro usage of each macro per agent.
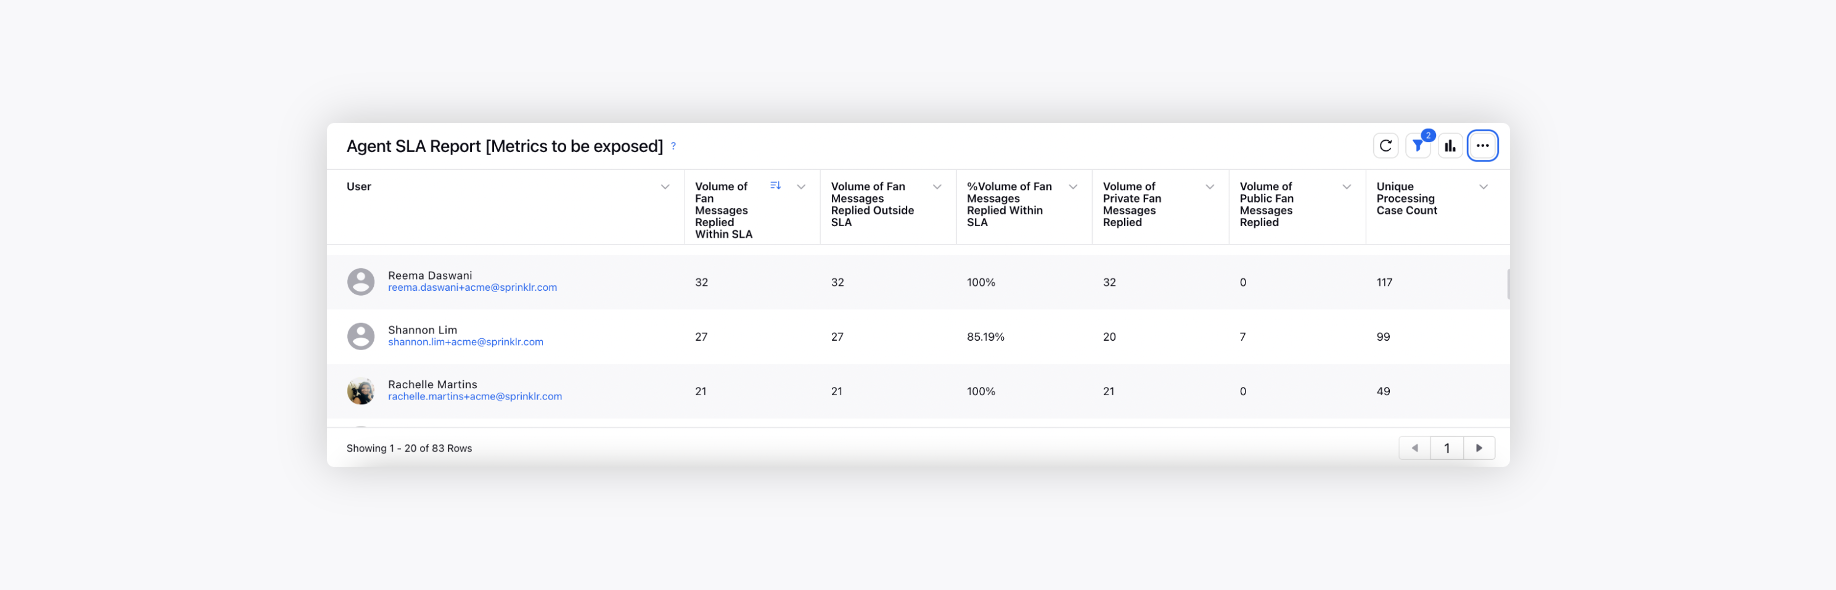
Agent SLA Report
Volume of fan message replied within SLA - Total number of fan message replied within configured SLA threshold.
Volume of fan message replied outside SLA - Total number of fan message replies outside configured SLA threshold.
% Volume of fan message replied within SLA - % of total fan message replied within configured SLA threshold.
Volume of private fan message replied - Total number of private fan message replied.
Volume of public fan message -Total number of public fan messages replied.
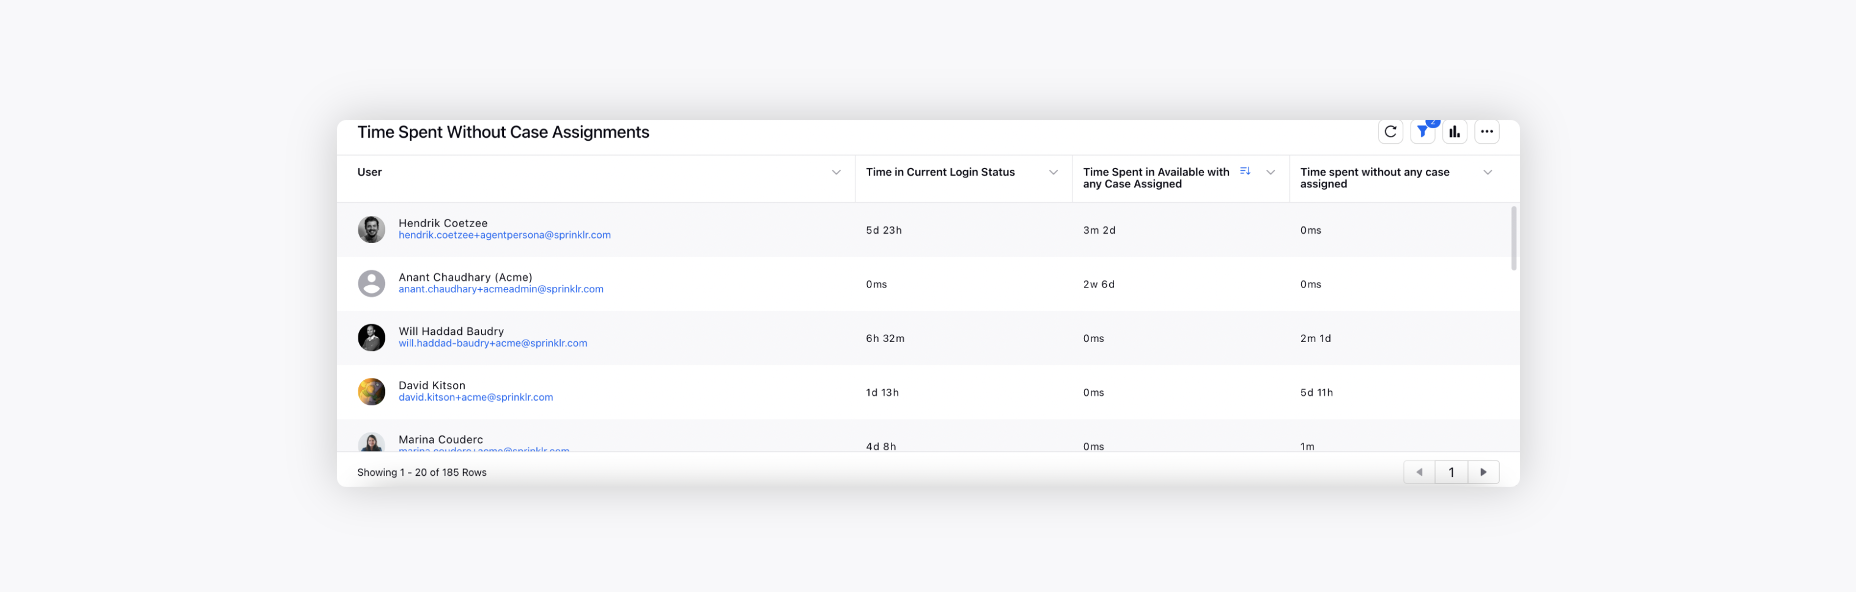
Time Spent Without Case Assignments
User: Name of the agent/ user.
Time in Current Login Status : Time spent in the current login status that is assigned to the user.
Time Spent in Available with any Case Assigned : Time spent in the available status with any case assigned.
Time spent without any case assigned: Time spent in the available status without any case being assigned.
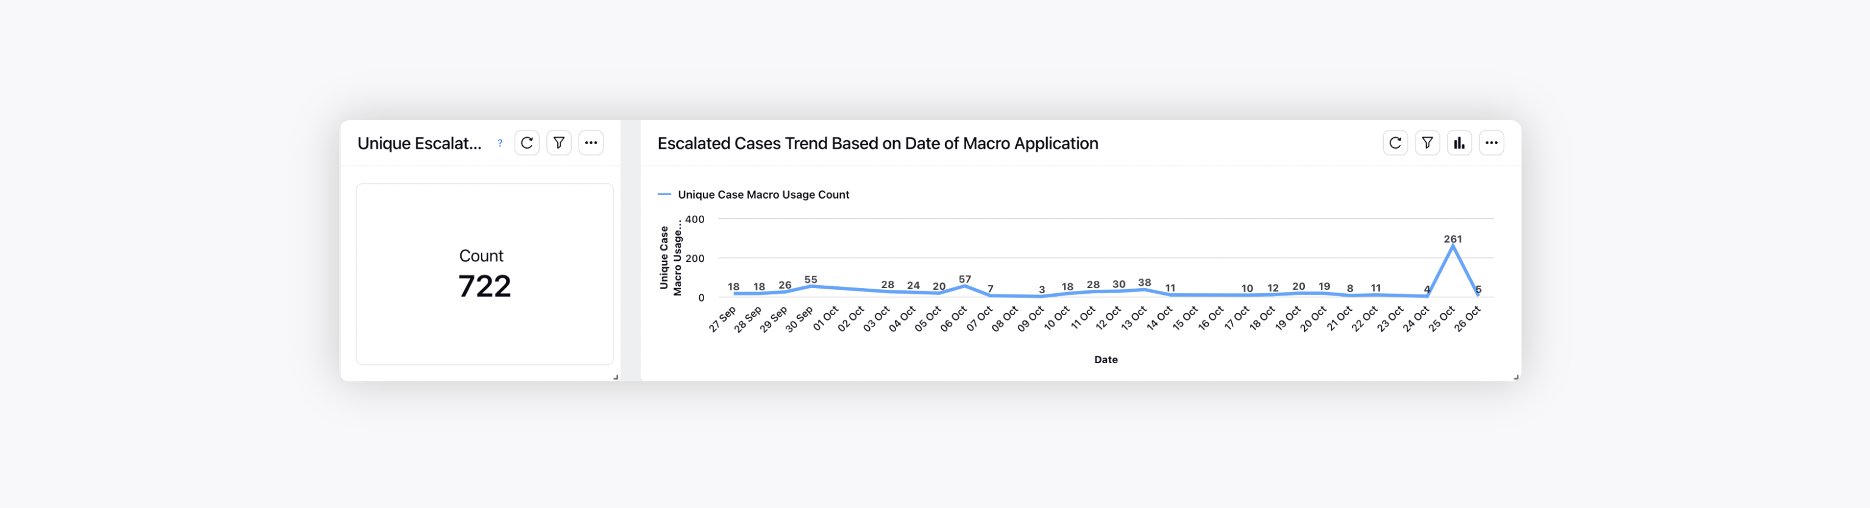
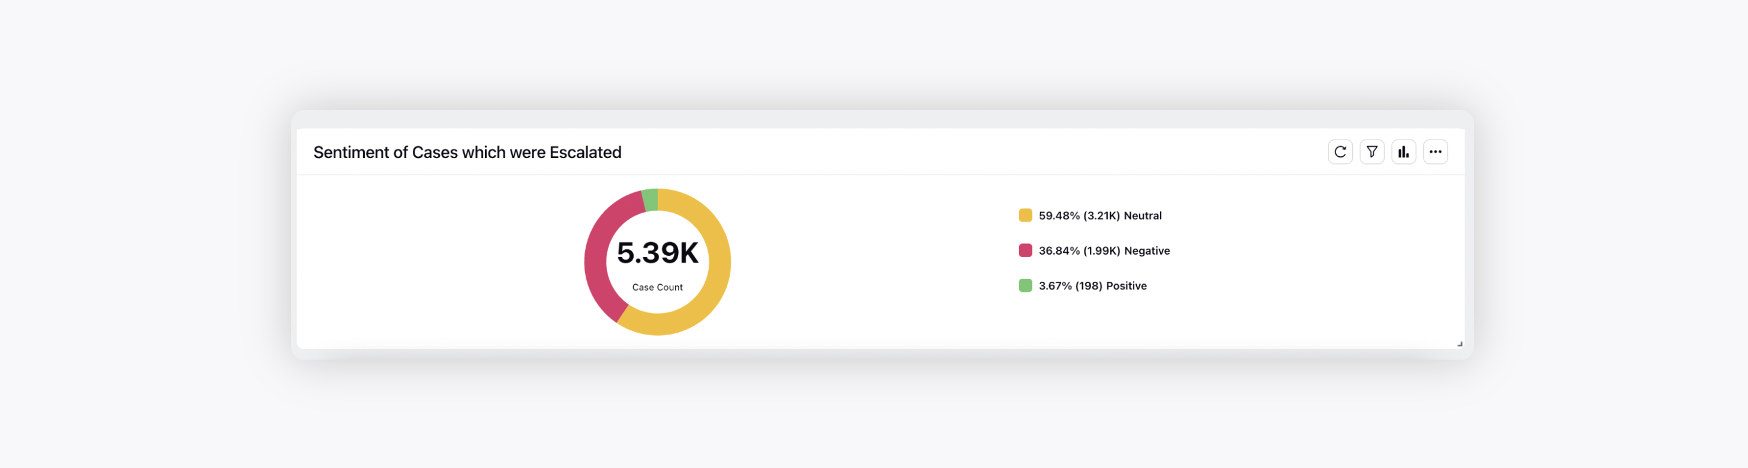
Escalation Statistics
This section summarizes all the cases that are marked as Escalated, its CSAT and the rate of escalated cases.
Unique Escalated Cases - Total number of unique cases on which escalated macro was applied within given time frame.
Escalated Case count - Total number of escalated cases that were created with given time frame.
Escalation Rate - Cases on which (Ops escalation or Escalation is applied at-least once)/ Cases Worked Upon.
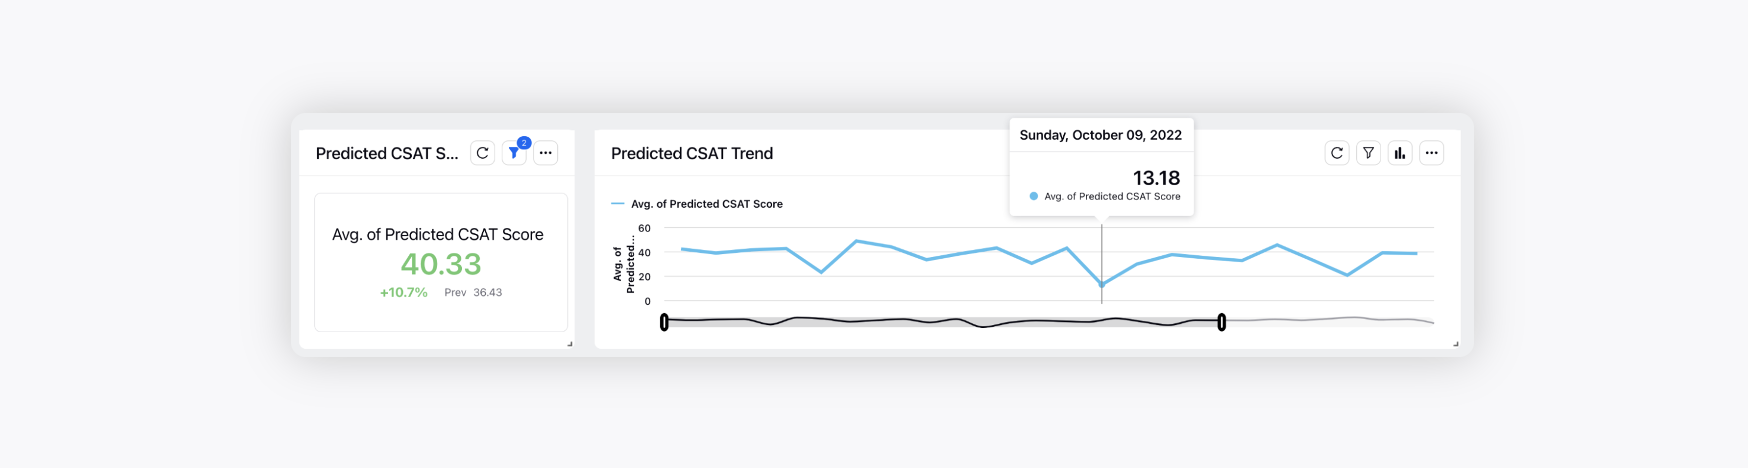
Predictive CSAT Score - Customer Satisfaction Score (CSAT) is a basic measurement of a customer’s satisfaction with a brand’s product and/or services.
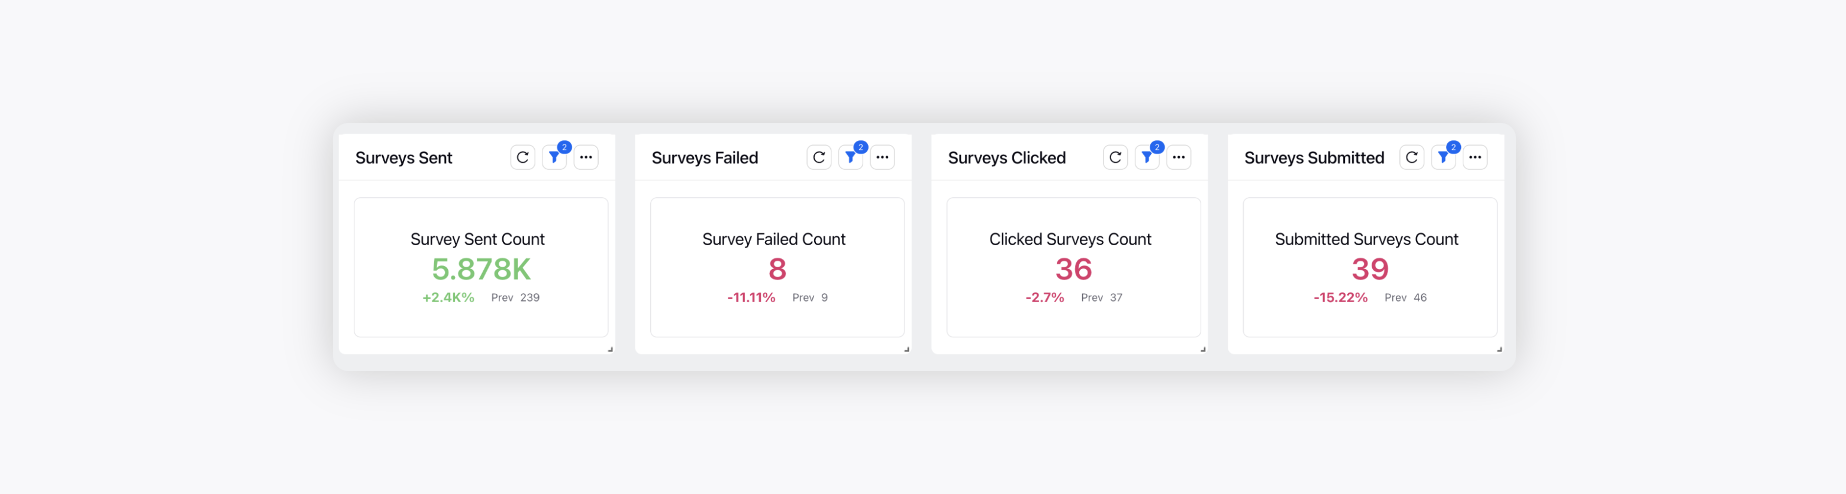
Survey Summary
This section details the overall survey transactions for all the cases handled.
Survey Sent Count: Number of surveys sent.
Survey Failed Count: Number of surveys which did not receive a response.
Surveys Clicked: Number of surveys clicked by the customer.
Surveys Submitted: Number of surveys responded/ submitted by customer.
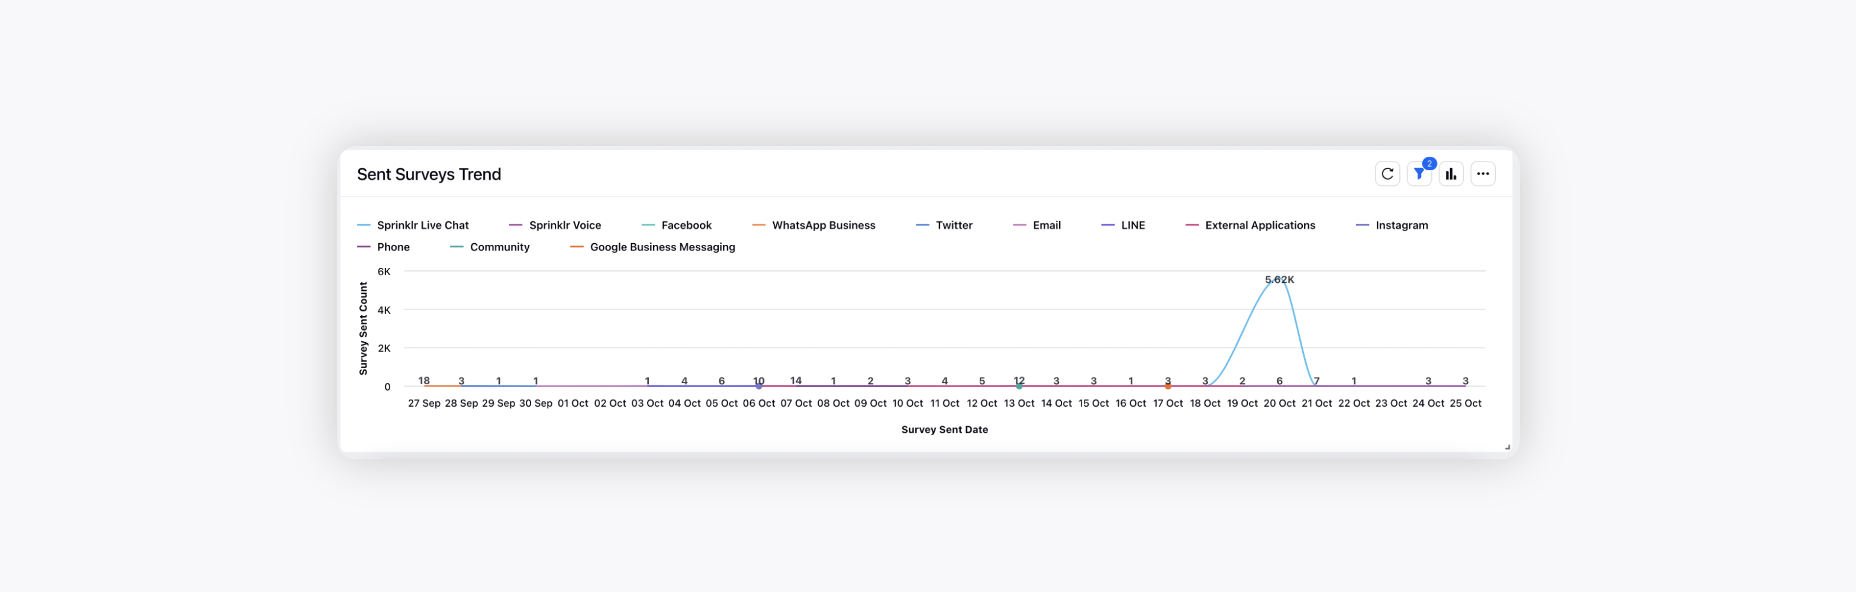
Sent Surveys Trend
Survey Sent Date: Date on which survey is sent by the agent.
Survey Sent Count: Number of surveys sent.
Survey Customer Channel: The customer channel through which the survey has been sent.
Overall - Case Volume Trends
This section details the Case Volume, its distribution across channels, responses and the split based on statuses of the case.
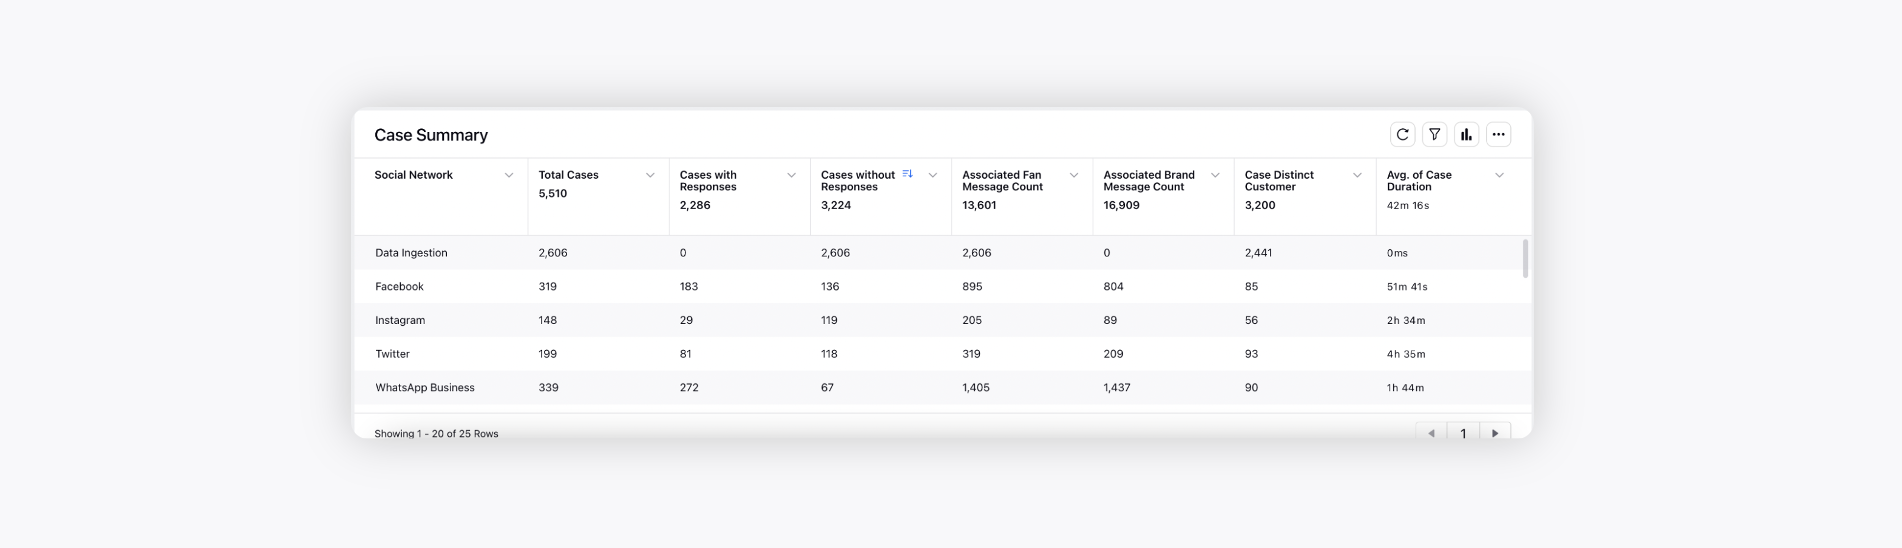
Case Summary
Social Network: The name of the social network.
Total Cases: Total number of cases in given time filter duration.
Cases with Responses: Number of cases with an user response.
Cases without Responses: Number of cases without a user response.
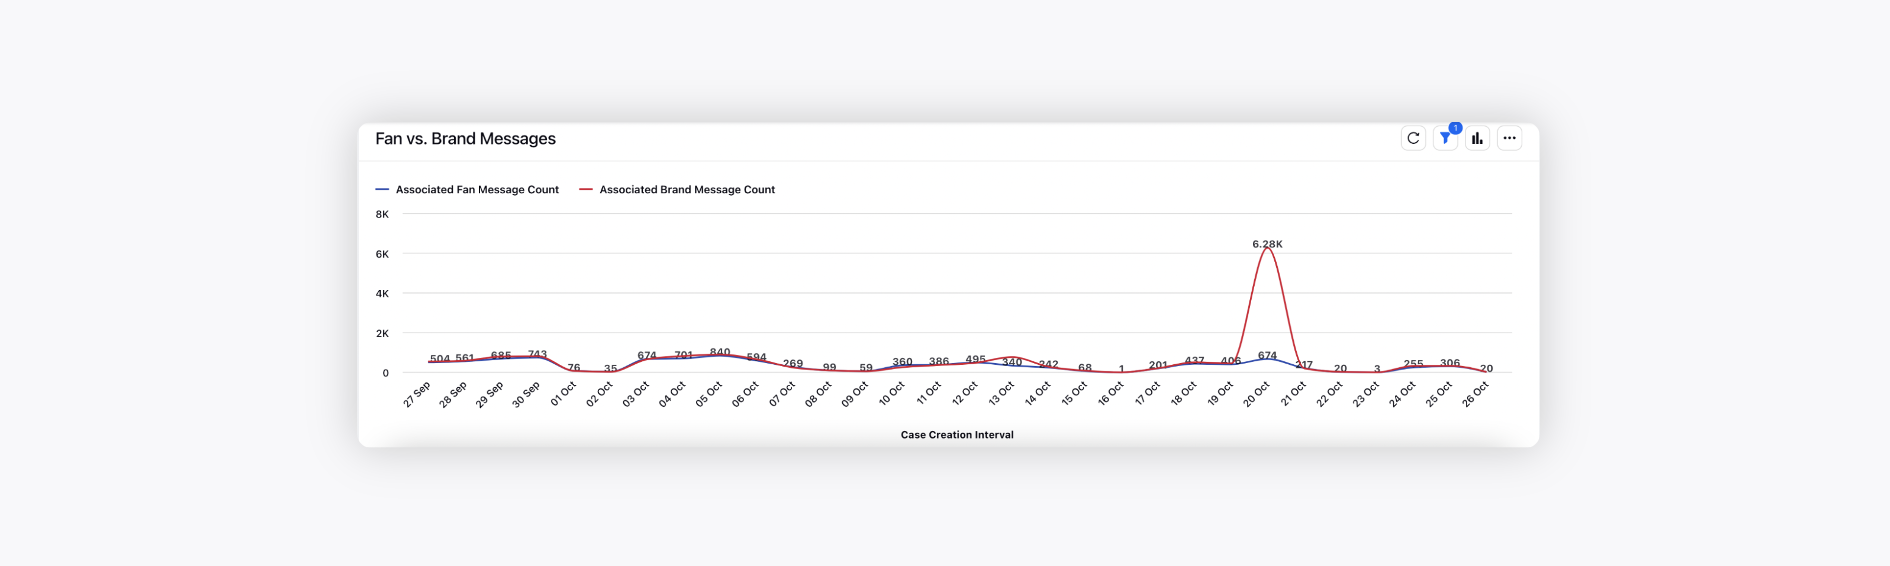
Associated Fan Message Count: The total number of fan messages on a case.
Associated Brand Message Count: The total number of brand messages on a case. This includes auto responses as well.
Case Distinct Customer: This is the distinct number of users (profiles) that have a case associated with them.
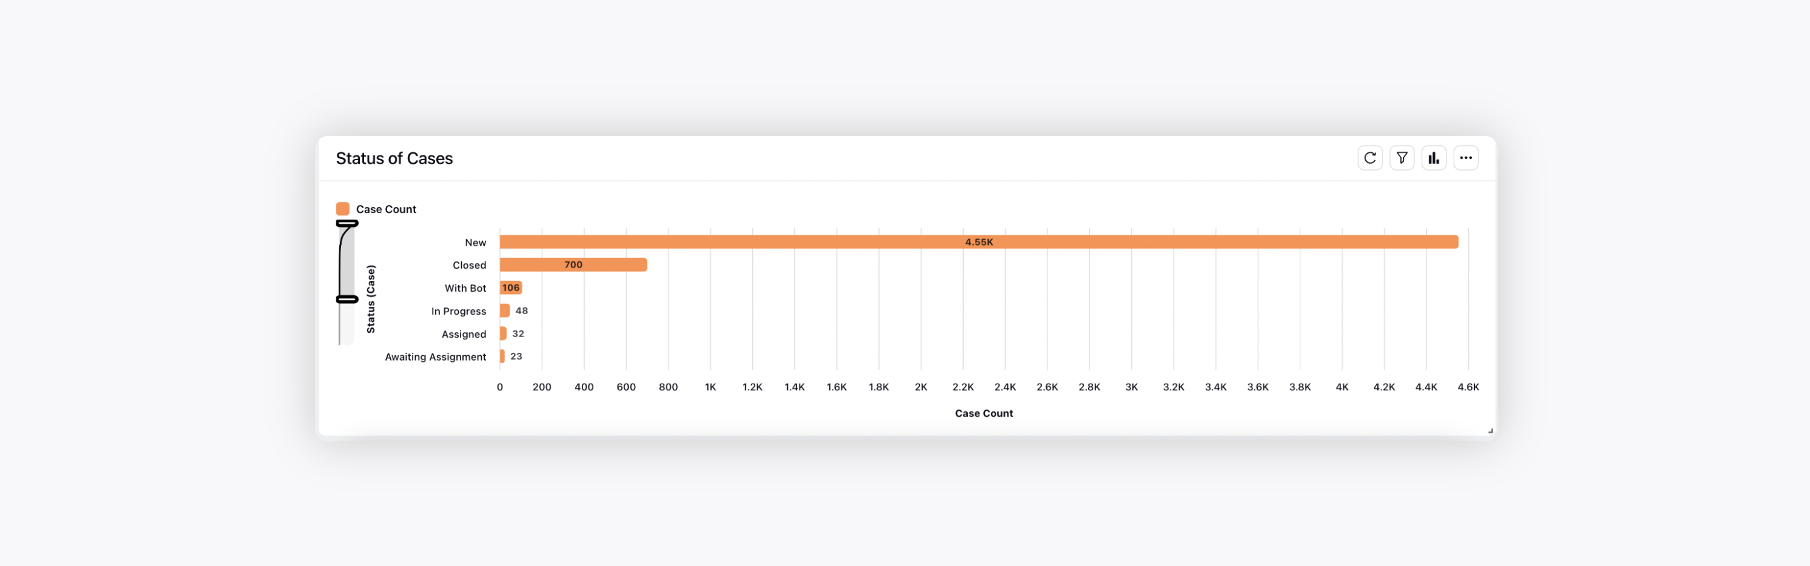
Status of Cases
Status (Case): The value in the Status field of each case. (States if a case is New, Closed, etc.)
Case Count: Total number of cases in given time filter duration.
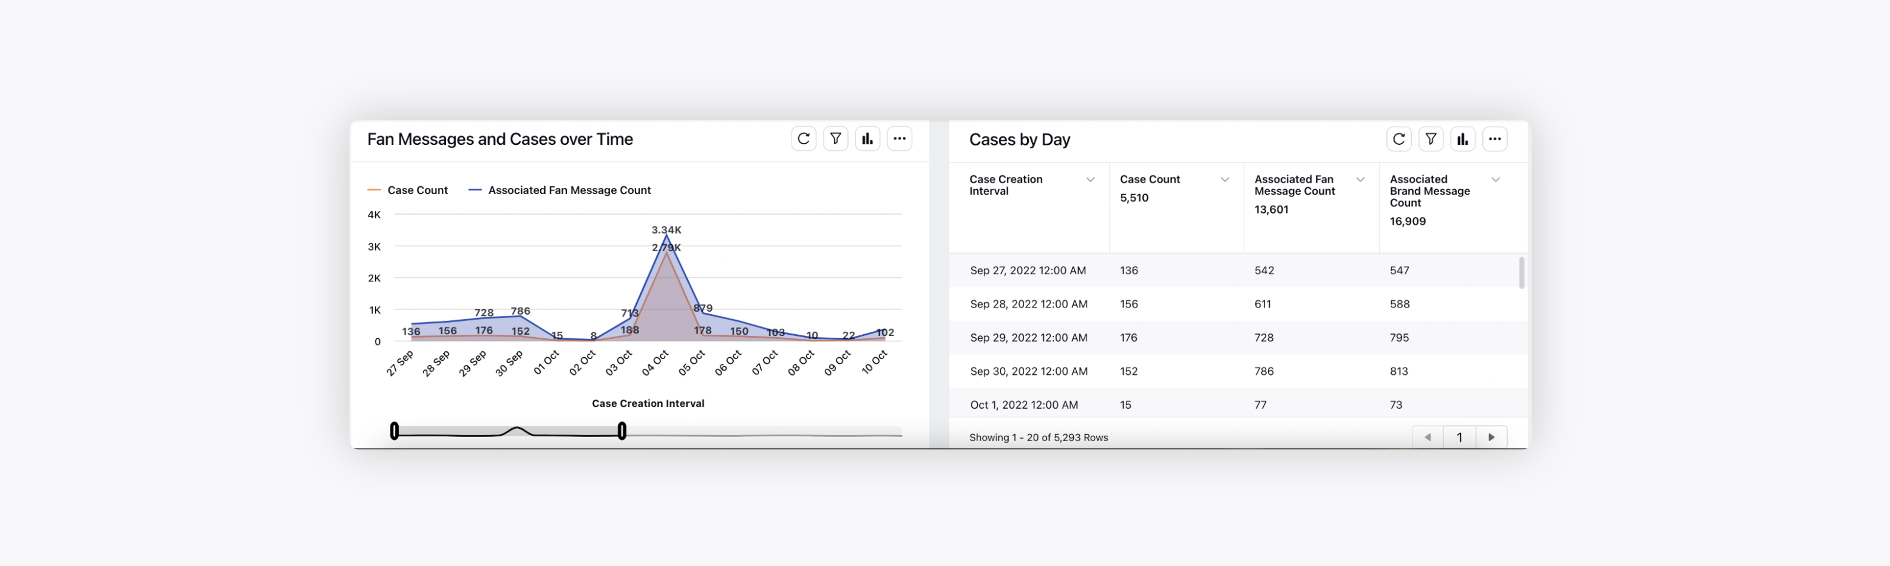
Fan Messages & Cases Over Time
Cases by Day
These widgets provide the Case Count and the Associated fan and brand message count for the selected time range segregated based on the Case Creation Intervals.
Fan VS Brand Messages
This widget explains the ratio of Fan and Brand messages shared for the selected time range.
Overall - Case Performance
This section details the Case performance or case handling time stats.
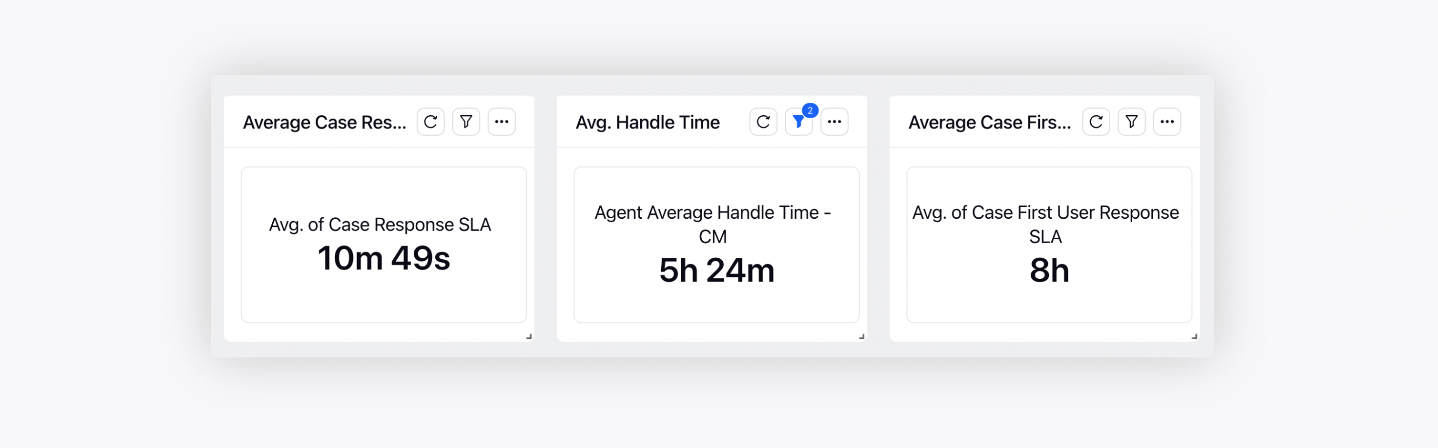
Case Response SLAs
Average Case Response SLA: Average of the time difference between the first un-responded message of a fan added to a case and when the Brand responded (of all the cases with a response).
Average Handle Time: Case Processing SLA / Unique Processing Case Count.
Average Case First User Response SLA: Average of the time difference between the first fan message and the first agent response. Brand messages include only agent responses.
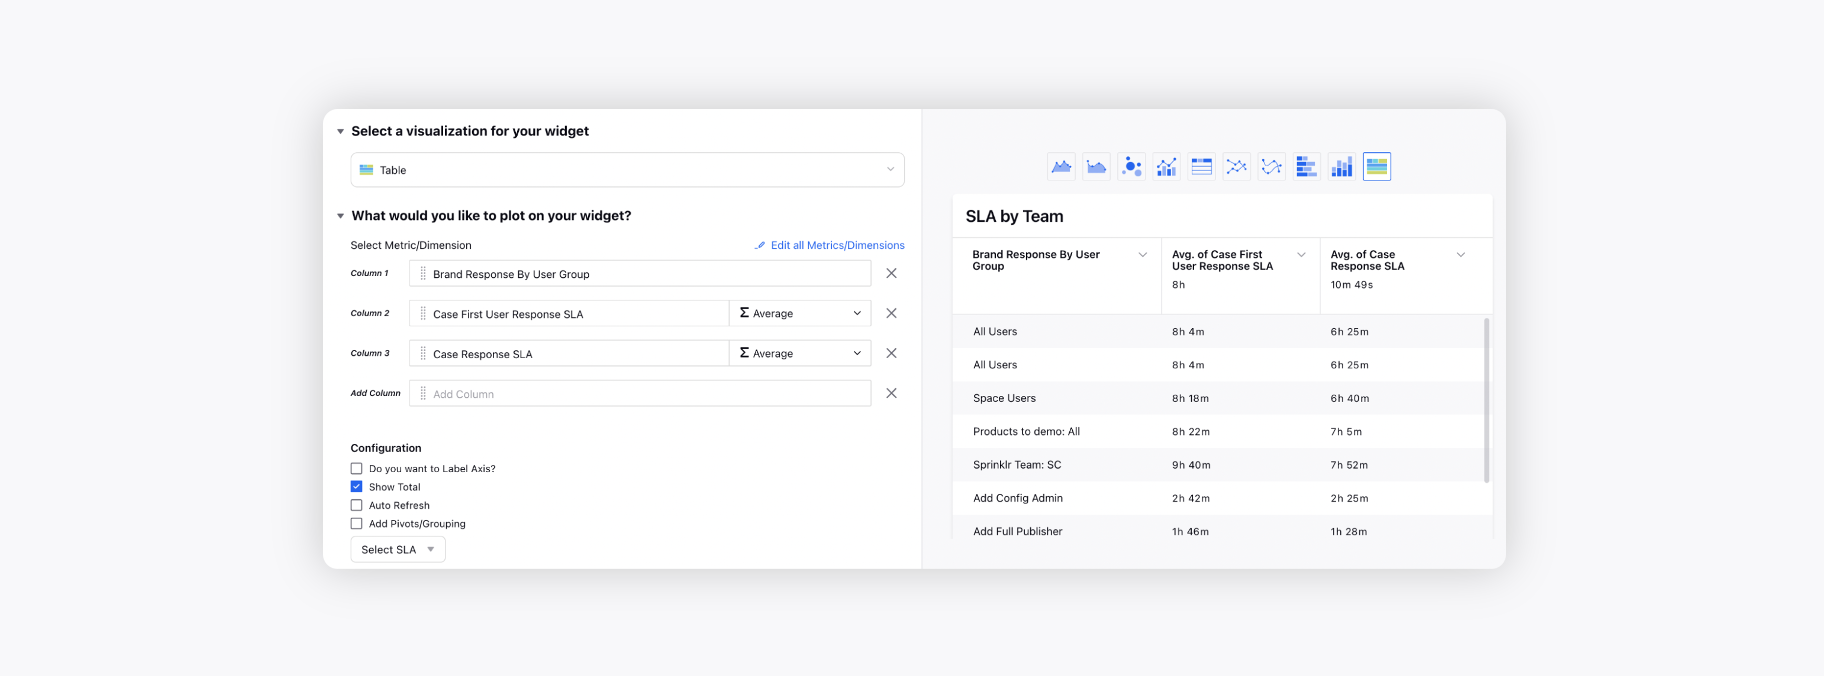
SLA by Team
Brand Response By User Group: The name of user group who responded to the case.
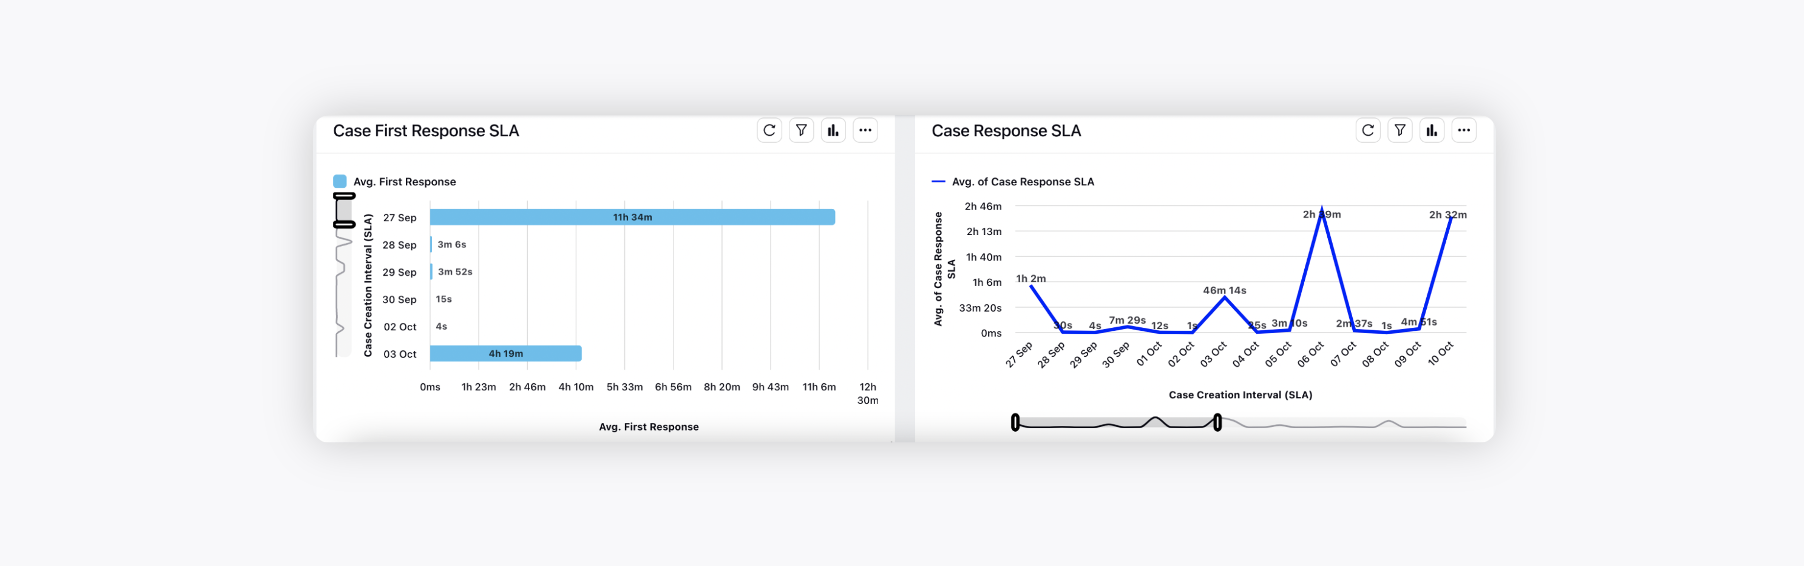
Response SLAs Over Time
These widgets provide the Average First User Response SLA and Average Response SLA for all the cases actioned during the selected time range.
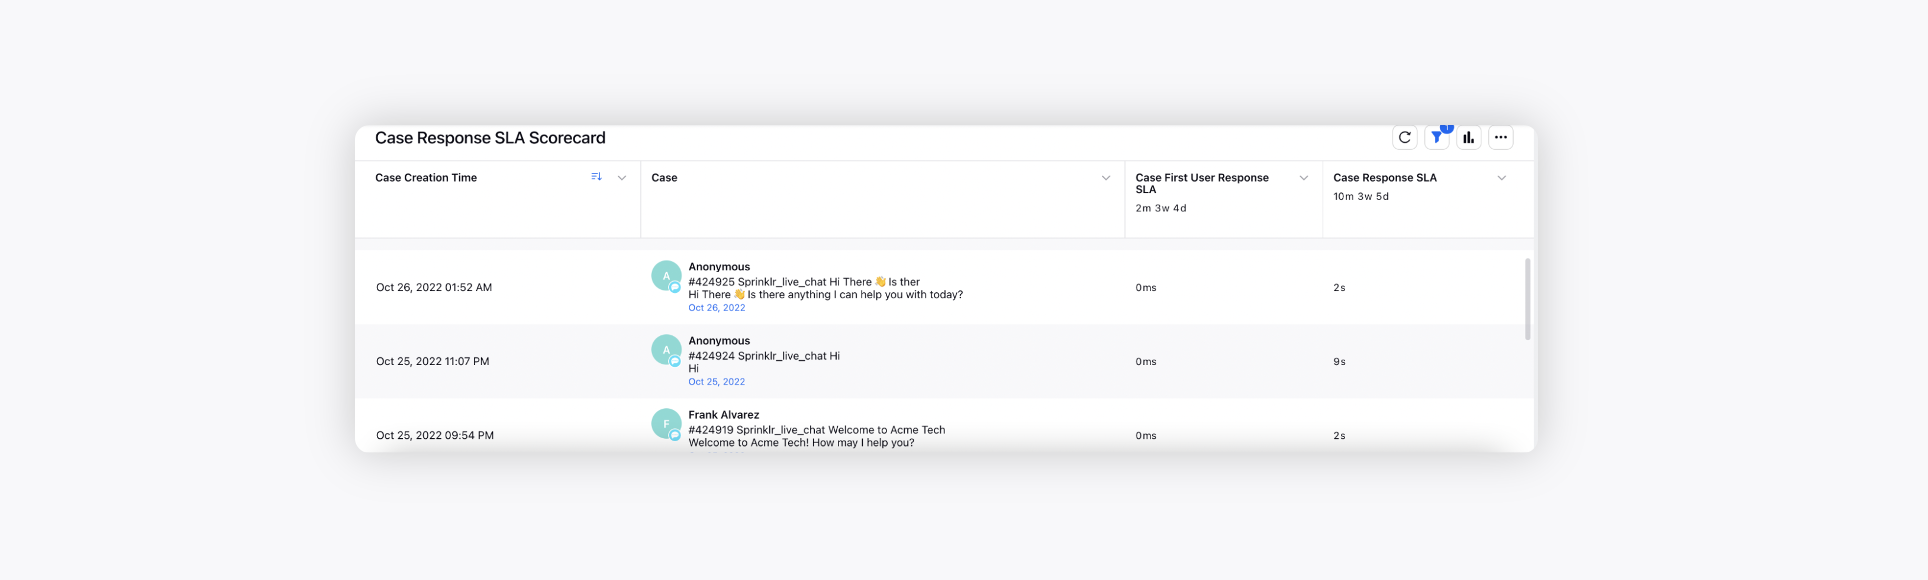
Case Response SLA Scorecard
This widget provides the First user response SLA and Case Response SLA for each case.
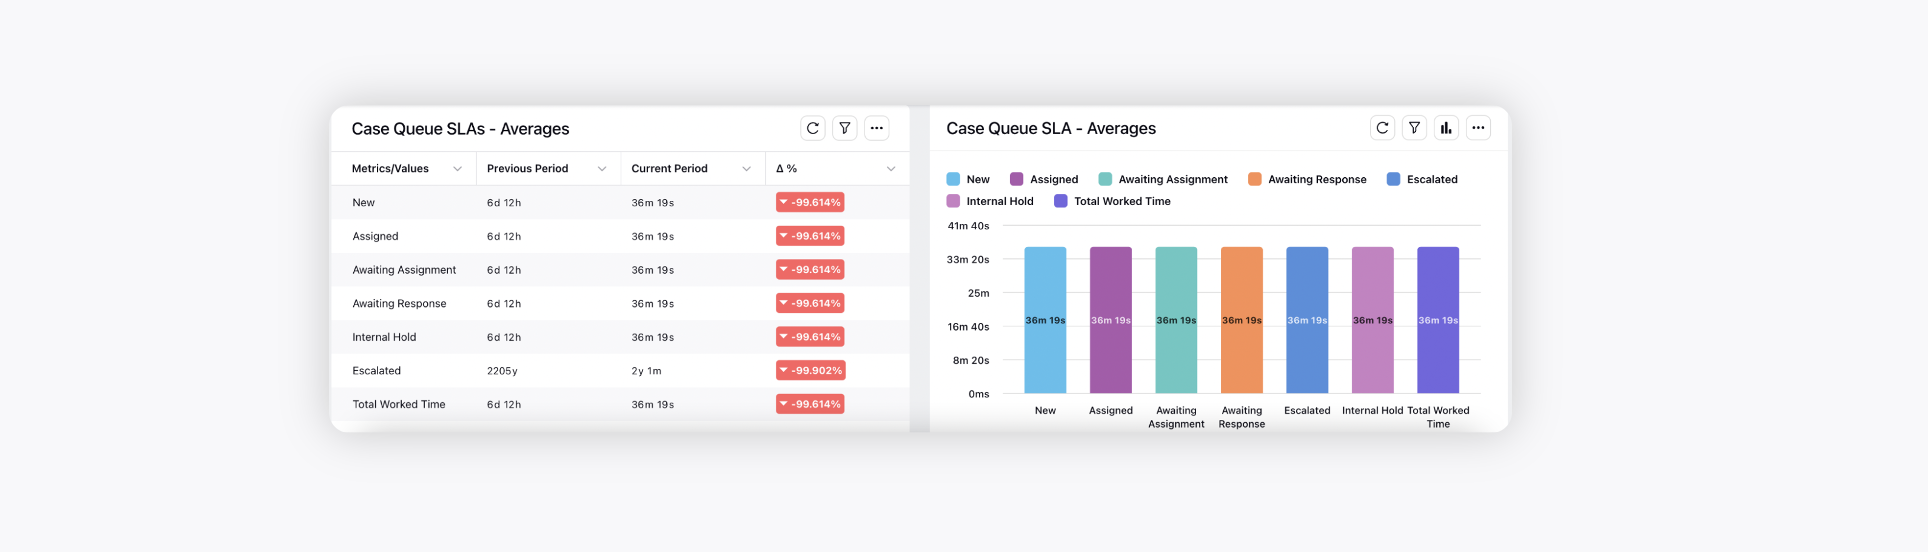
Case Queue SLA
Case Queue SLA measures the time difference between when a case was assigned to a queue and when a user took action on the case. (New, Assigned, Awaiting Assignment,etc. Are the various work queues ) This section provides the overall queue time of all the cases.
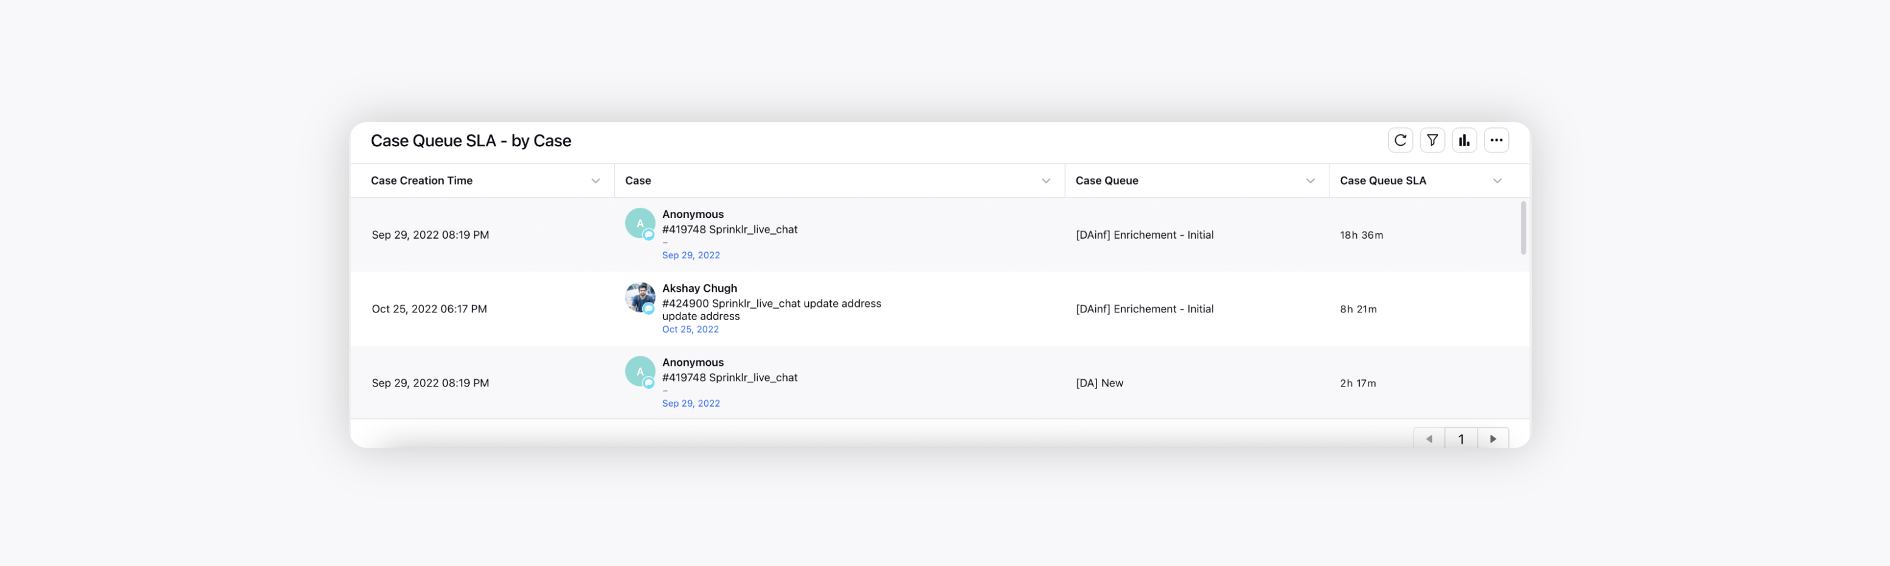
Case Queue SLA - by Case
This widget provides the Queue SLA of each case.
Case Creation Time: The time at which the case was created. Note that this metric will not aggregate data of cases based on time interval.
Case Queue: The name of the queue in which the case is present at that time.
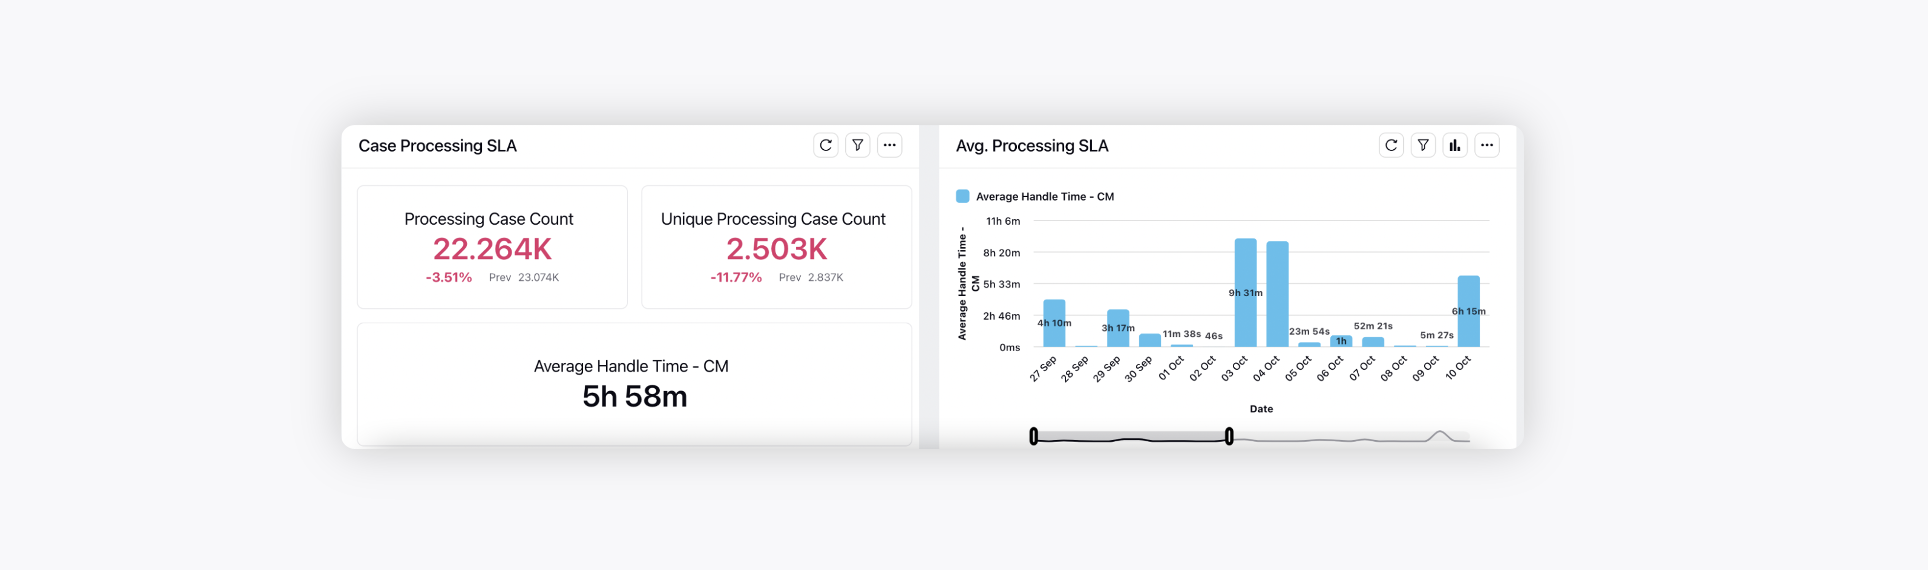
Case Processing SLA
Processing Case Count: Number of times processing clock was opened in the third pane by the agent/user.
Unique Processing Case Count: Unique number of times a processing clock was opened in third pane (counts as 1 for 1 unique case irrespective of processing clock being opened multiple times).
Case Processing SLA: Time for which the processing clock was opened in the third pane for the case.
Average Handle time: Case Processing SLA/ Unique Processing Case Count.
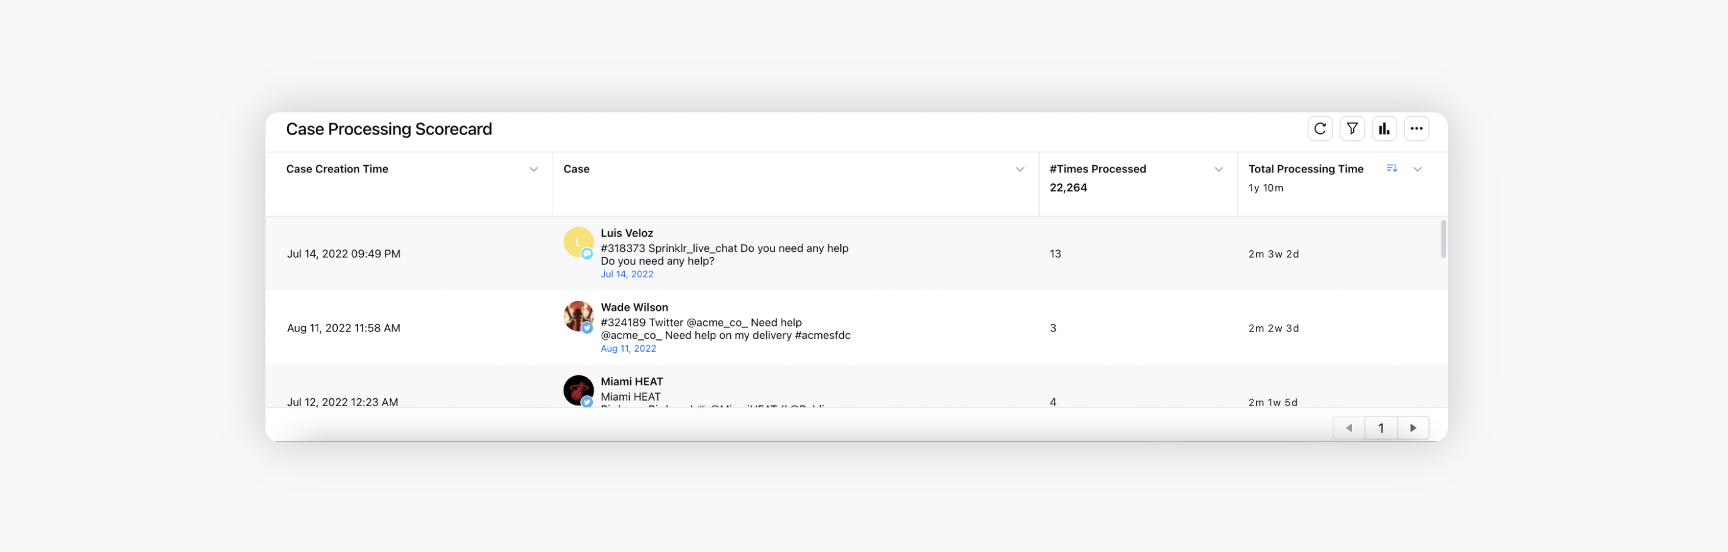
Case Processing Scorecard
This widget provides the Case Processing SLA for each case and Number of times the case has been processed.
Macro Usage
These widgets provide the Number of times each macro has been applied on cases during the selected time range.