Twitter as a Benchmarking source
Updated
When it comes to brands, influencers, and their audience connecting and engaging online, there's one social channel that's head and shoulders above the rest: Twitter. This platform is the ultimate hotspot for sparking conversations, building relationships, and creating buzz.
Sprinklr has access to the entire Twitter Firehose, i.e. every tweet, reply, favorite, or retweet is captured in Sprinklr in real-time.
Overview of Twitter as a source
Source: Twitter
Source of data: Official API (Firehose)
Post latency: Real-time data for the lifetime
Historical data
Auto backfill: 2 years
Manual backfill: 3 years
Engagement Stats Monitoring: In real-time for a lifetime
Fan Messages supported: Yes
Major Twitter-supported metrics
Metric | Type | Definition |
% Paid Posts | Metric | Ratio of Paid posts (as predicted by AI) to overall posts from Brand pages |
Account Count (Active + Inactive) | Metric | The total number of accounts originally added to the brand. Includes both active & inactive accounts |
Account Daily Unique Participation | Metric | The number of unique users engaging with the account per day (likes, comments, shares). Note: This metric does not account for Twitter favorites, since we cannot access the unique users who have favorited tweets. |
Account Earned Impressions | Metric | The number of social accounts that could potentially see a company or brand's communications from shared posts such as re-posts and retweets. This number is multiplied by a factor of (1.0 + 0.013 * (1.0 / 3.0)) which represents a generally accepted virality score to account for other users that might have also seen the message. |
Account Followers | Metric | This is a Sprinklr common metric to total all of the various types of "followers" across social networks. It pinpoints the number of followers at the time of your post. For Facebook Global Pages we subtract the follower count of child pages to show only the followers of the global page. As a result, the follower count may not exactly match a follower number that appears natively. |
Account Owned Impressions | Metric | The number of social accounts that could potentially see a company or brand's communications from its followers. |
Account Total Engagements | Metric | Account Total Engagement is the sum of engagements for an account per day. This will also include engagements on posts published outside the selected time range |
Account Total Impressions | Metric | The total number of social accounts that could potentially see a company or brand's communications either directly or through messages such as re-posts and re-tweets. This combines Owned and Earned Impressions. |
Brand Messages Count | Metric | The number of outbound messages that have been published by the brand page. This metric can be used with dimensions like Message Subtype |
Estimated Post Reach | Metric | This is a Sprinklr common metric that is the estimated number of users that have seen a post over the lifetime of the post. |
Fan Messages | Metric | Fan Messages include all comments, replies and mentions made by a fan on the brand's account page. |
Message Count | Metric | The total number of messages for an account including inbound and outbound messages. |
Post Comments | Metric | This is a common metric that calculates the sum of various "comments" across social networks. These include Facebook Post Stream Comments, Twitter replies, G+ Post Comments, YouTube video comments, and Instagram post comments. |
Post Likes & Reactions | Metric | This is a Sprinklr common metric that totals "likes" across various social networks. It includes Facebook Post Stream Likes, G+ Post +1s, and YouTube video likes. *Note: This differs from Reporting Insights because Twitter favorites are not included. |
Post Shares | Metric | This is a Sprinklr common metric that totals the various types of "shares" across social networks. It includes Twitter Post Retweets and Facebook Post Stream Shares. |
The Volume of Published Messages | Metric | The number of outbound messages that have been published. |
How to add a Twitter account to a Brand?
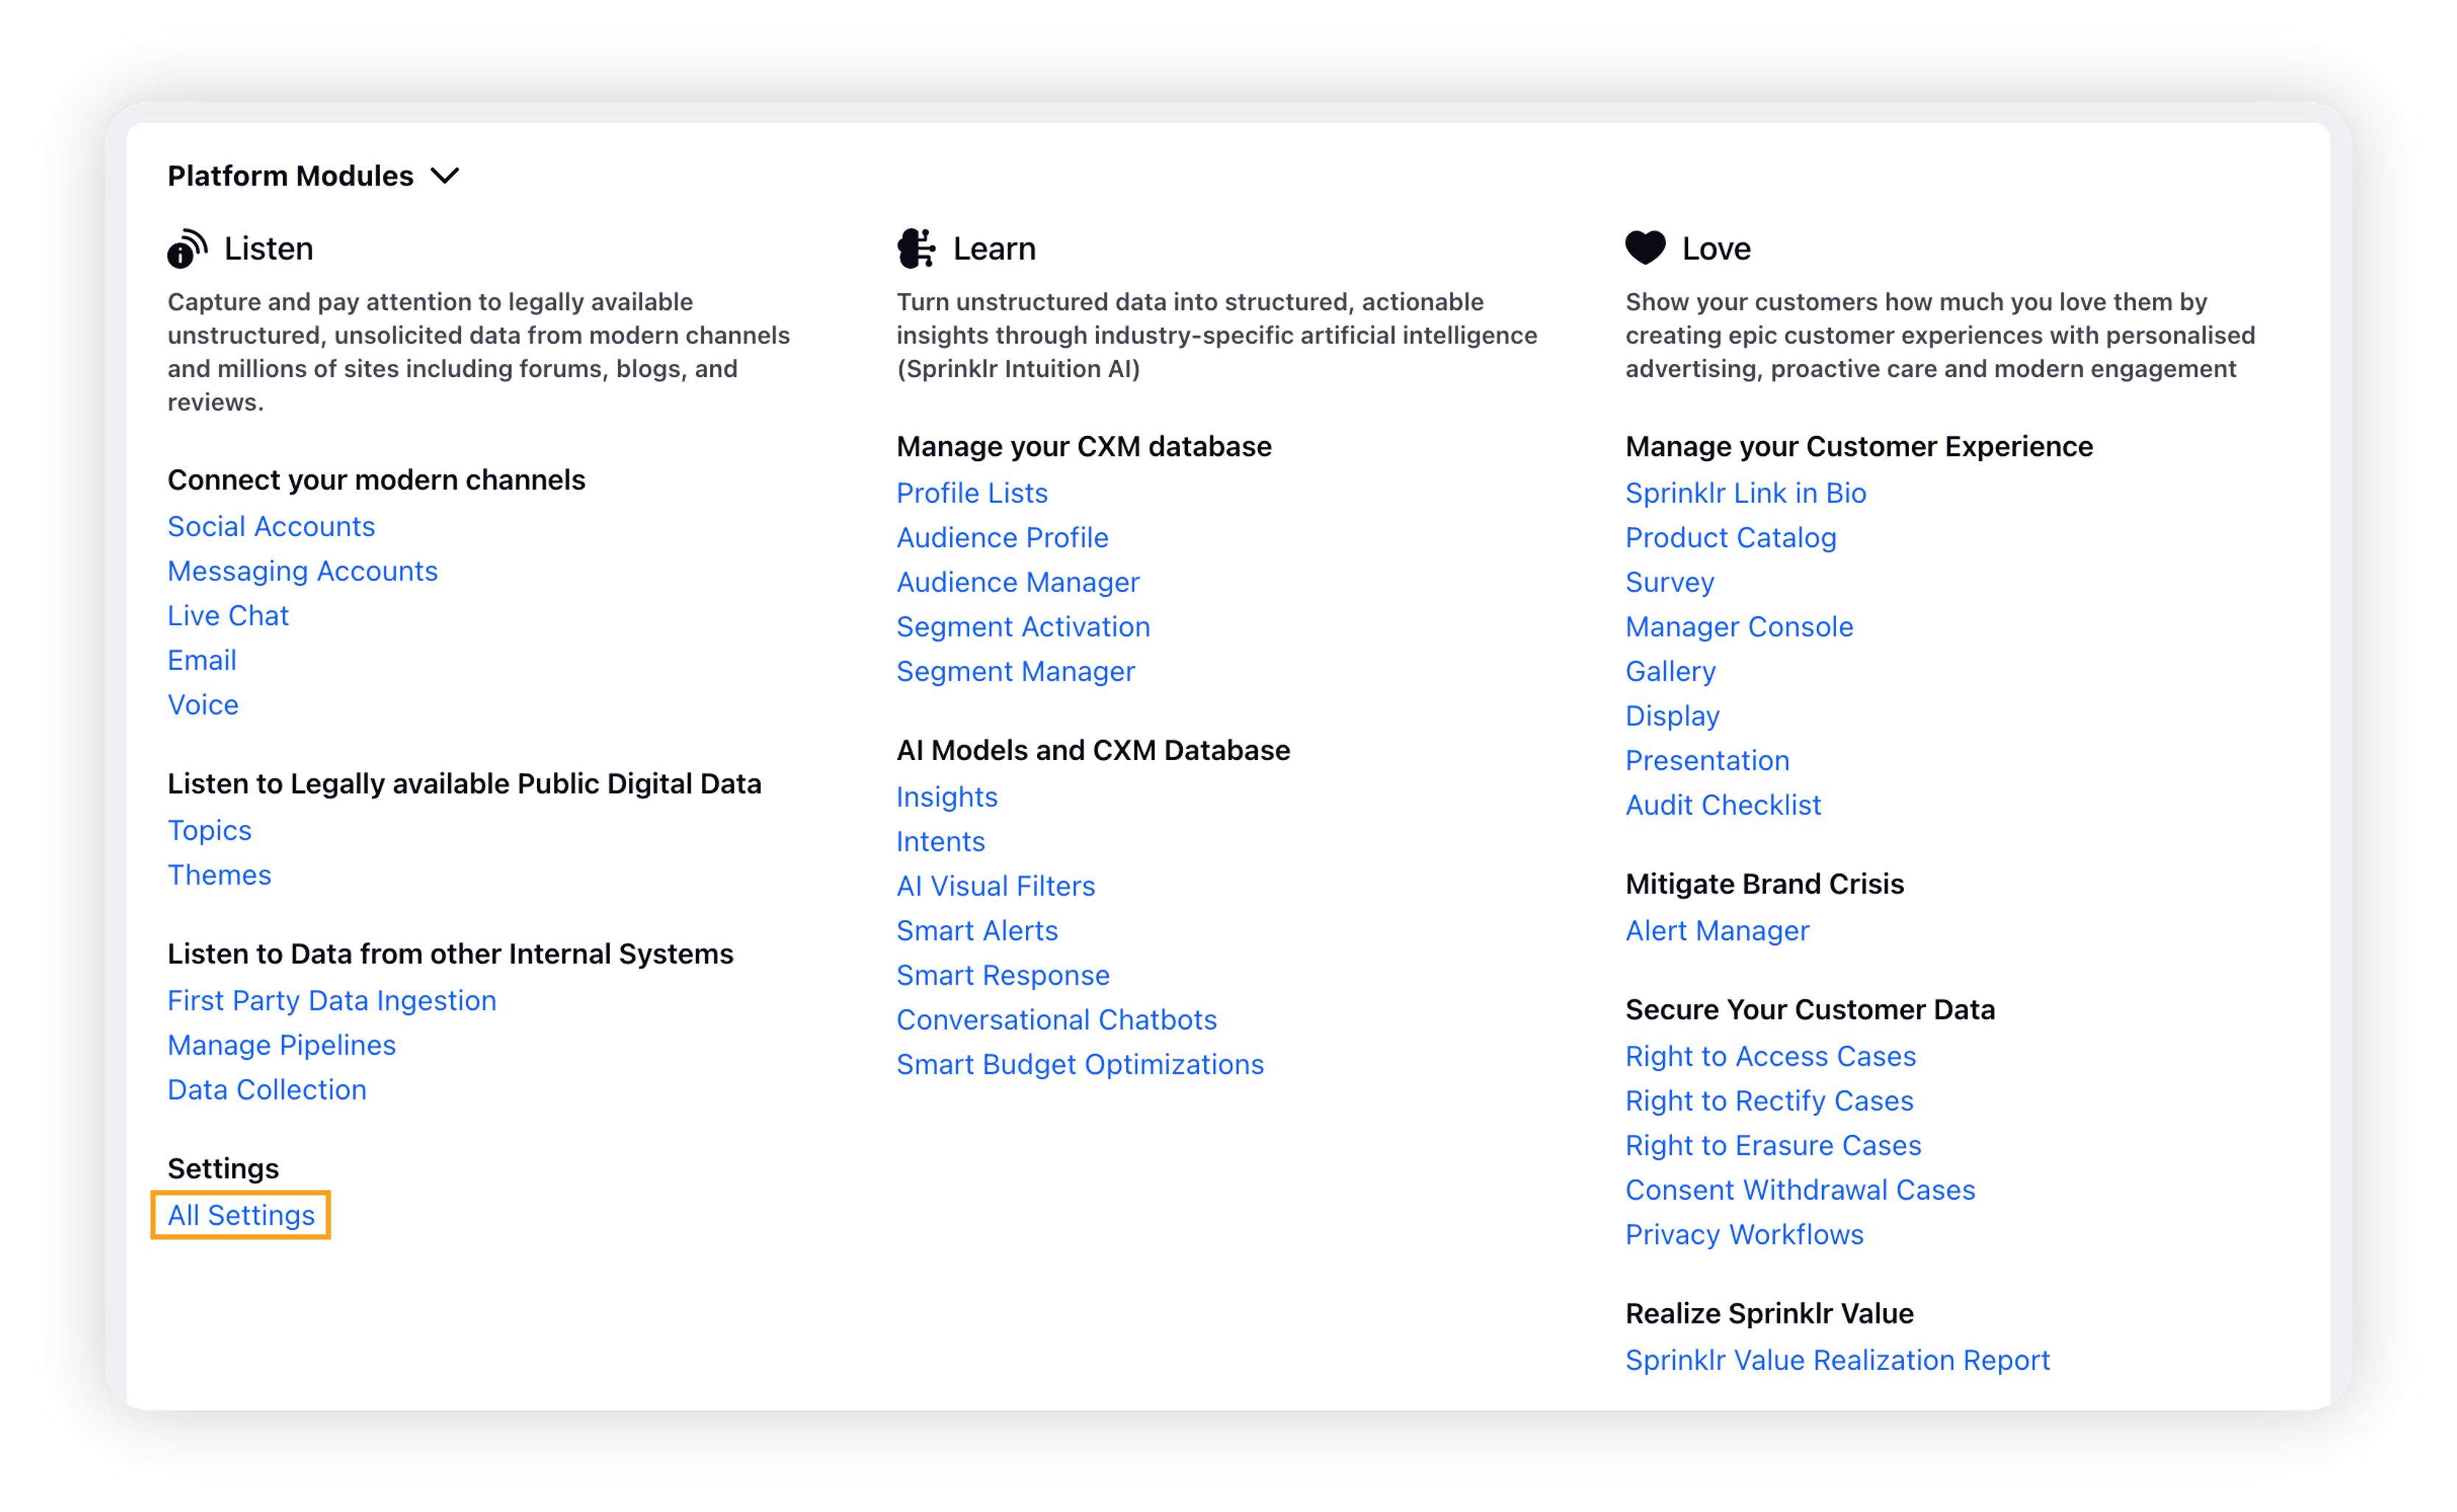
Click the New Tab icon. Under Platform Modules, click All Settings within Listen.

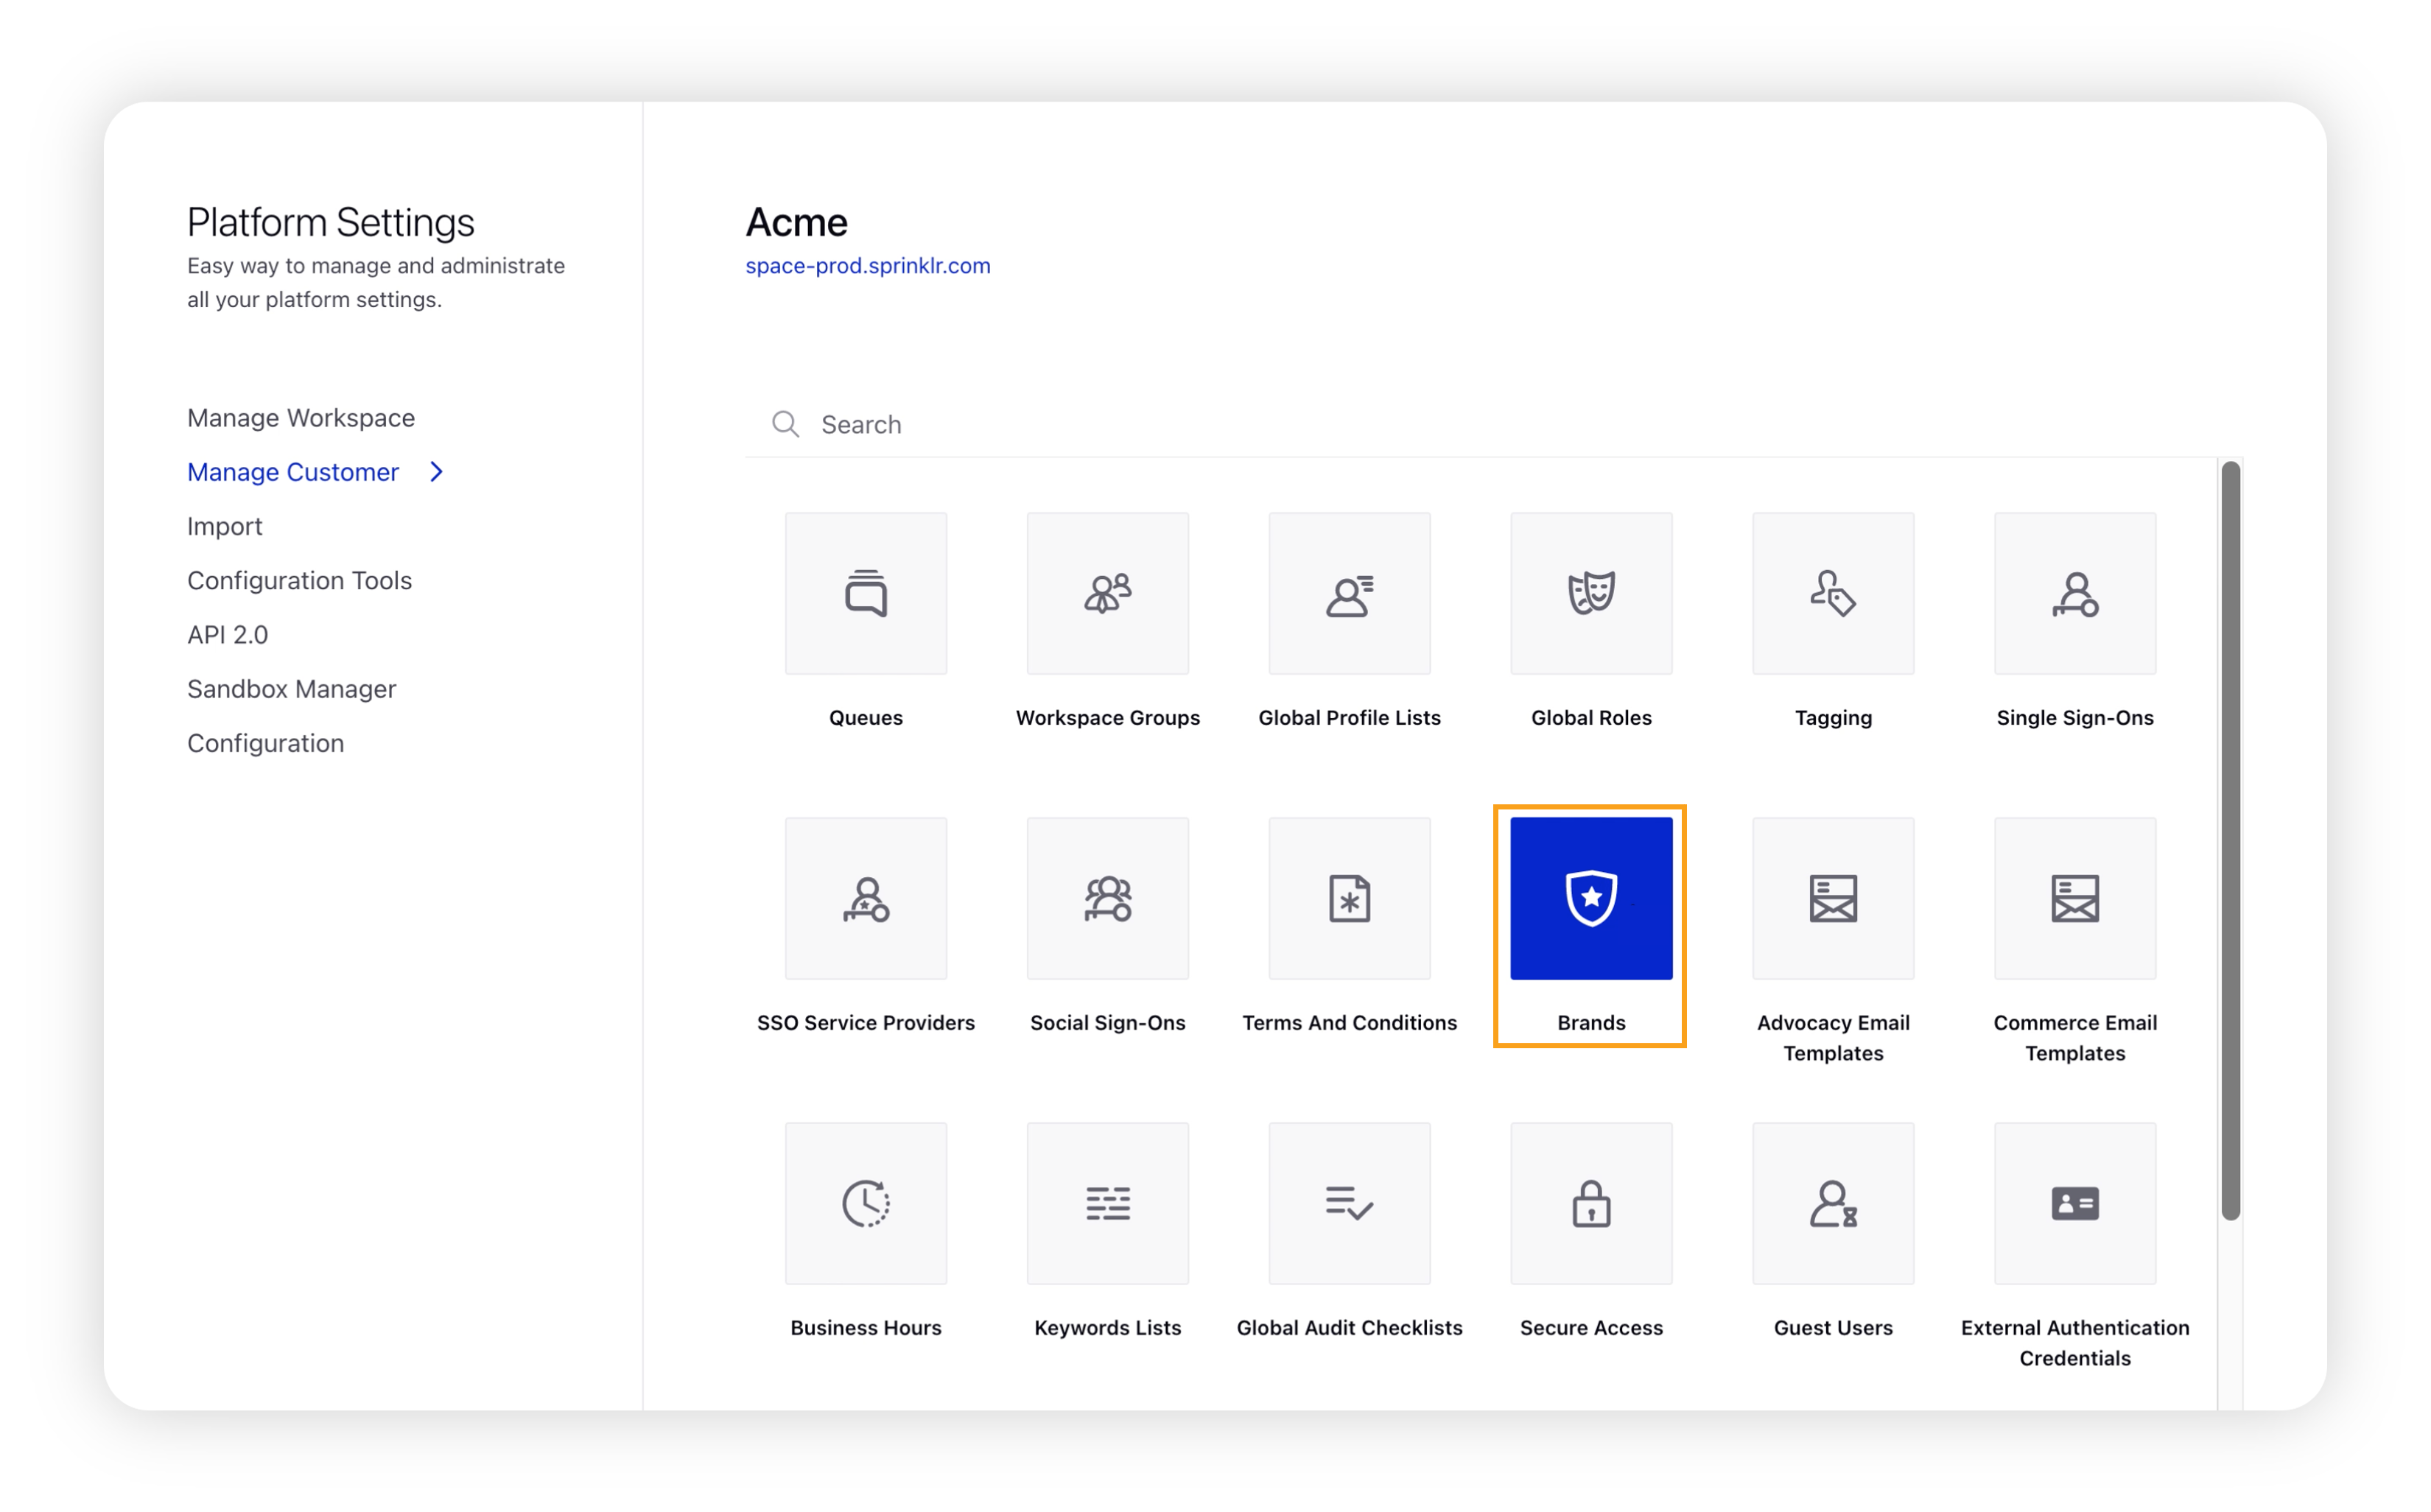
On the Platform Settings window, search and select Brands within Manage Customer.

Click Add Brand in the top right corner of the Brands window.
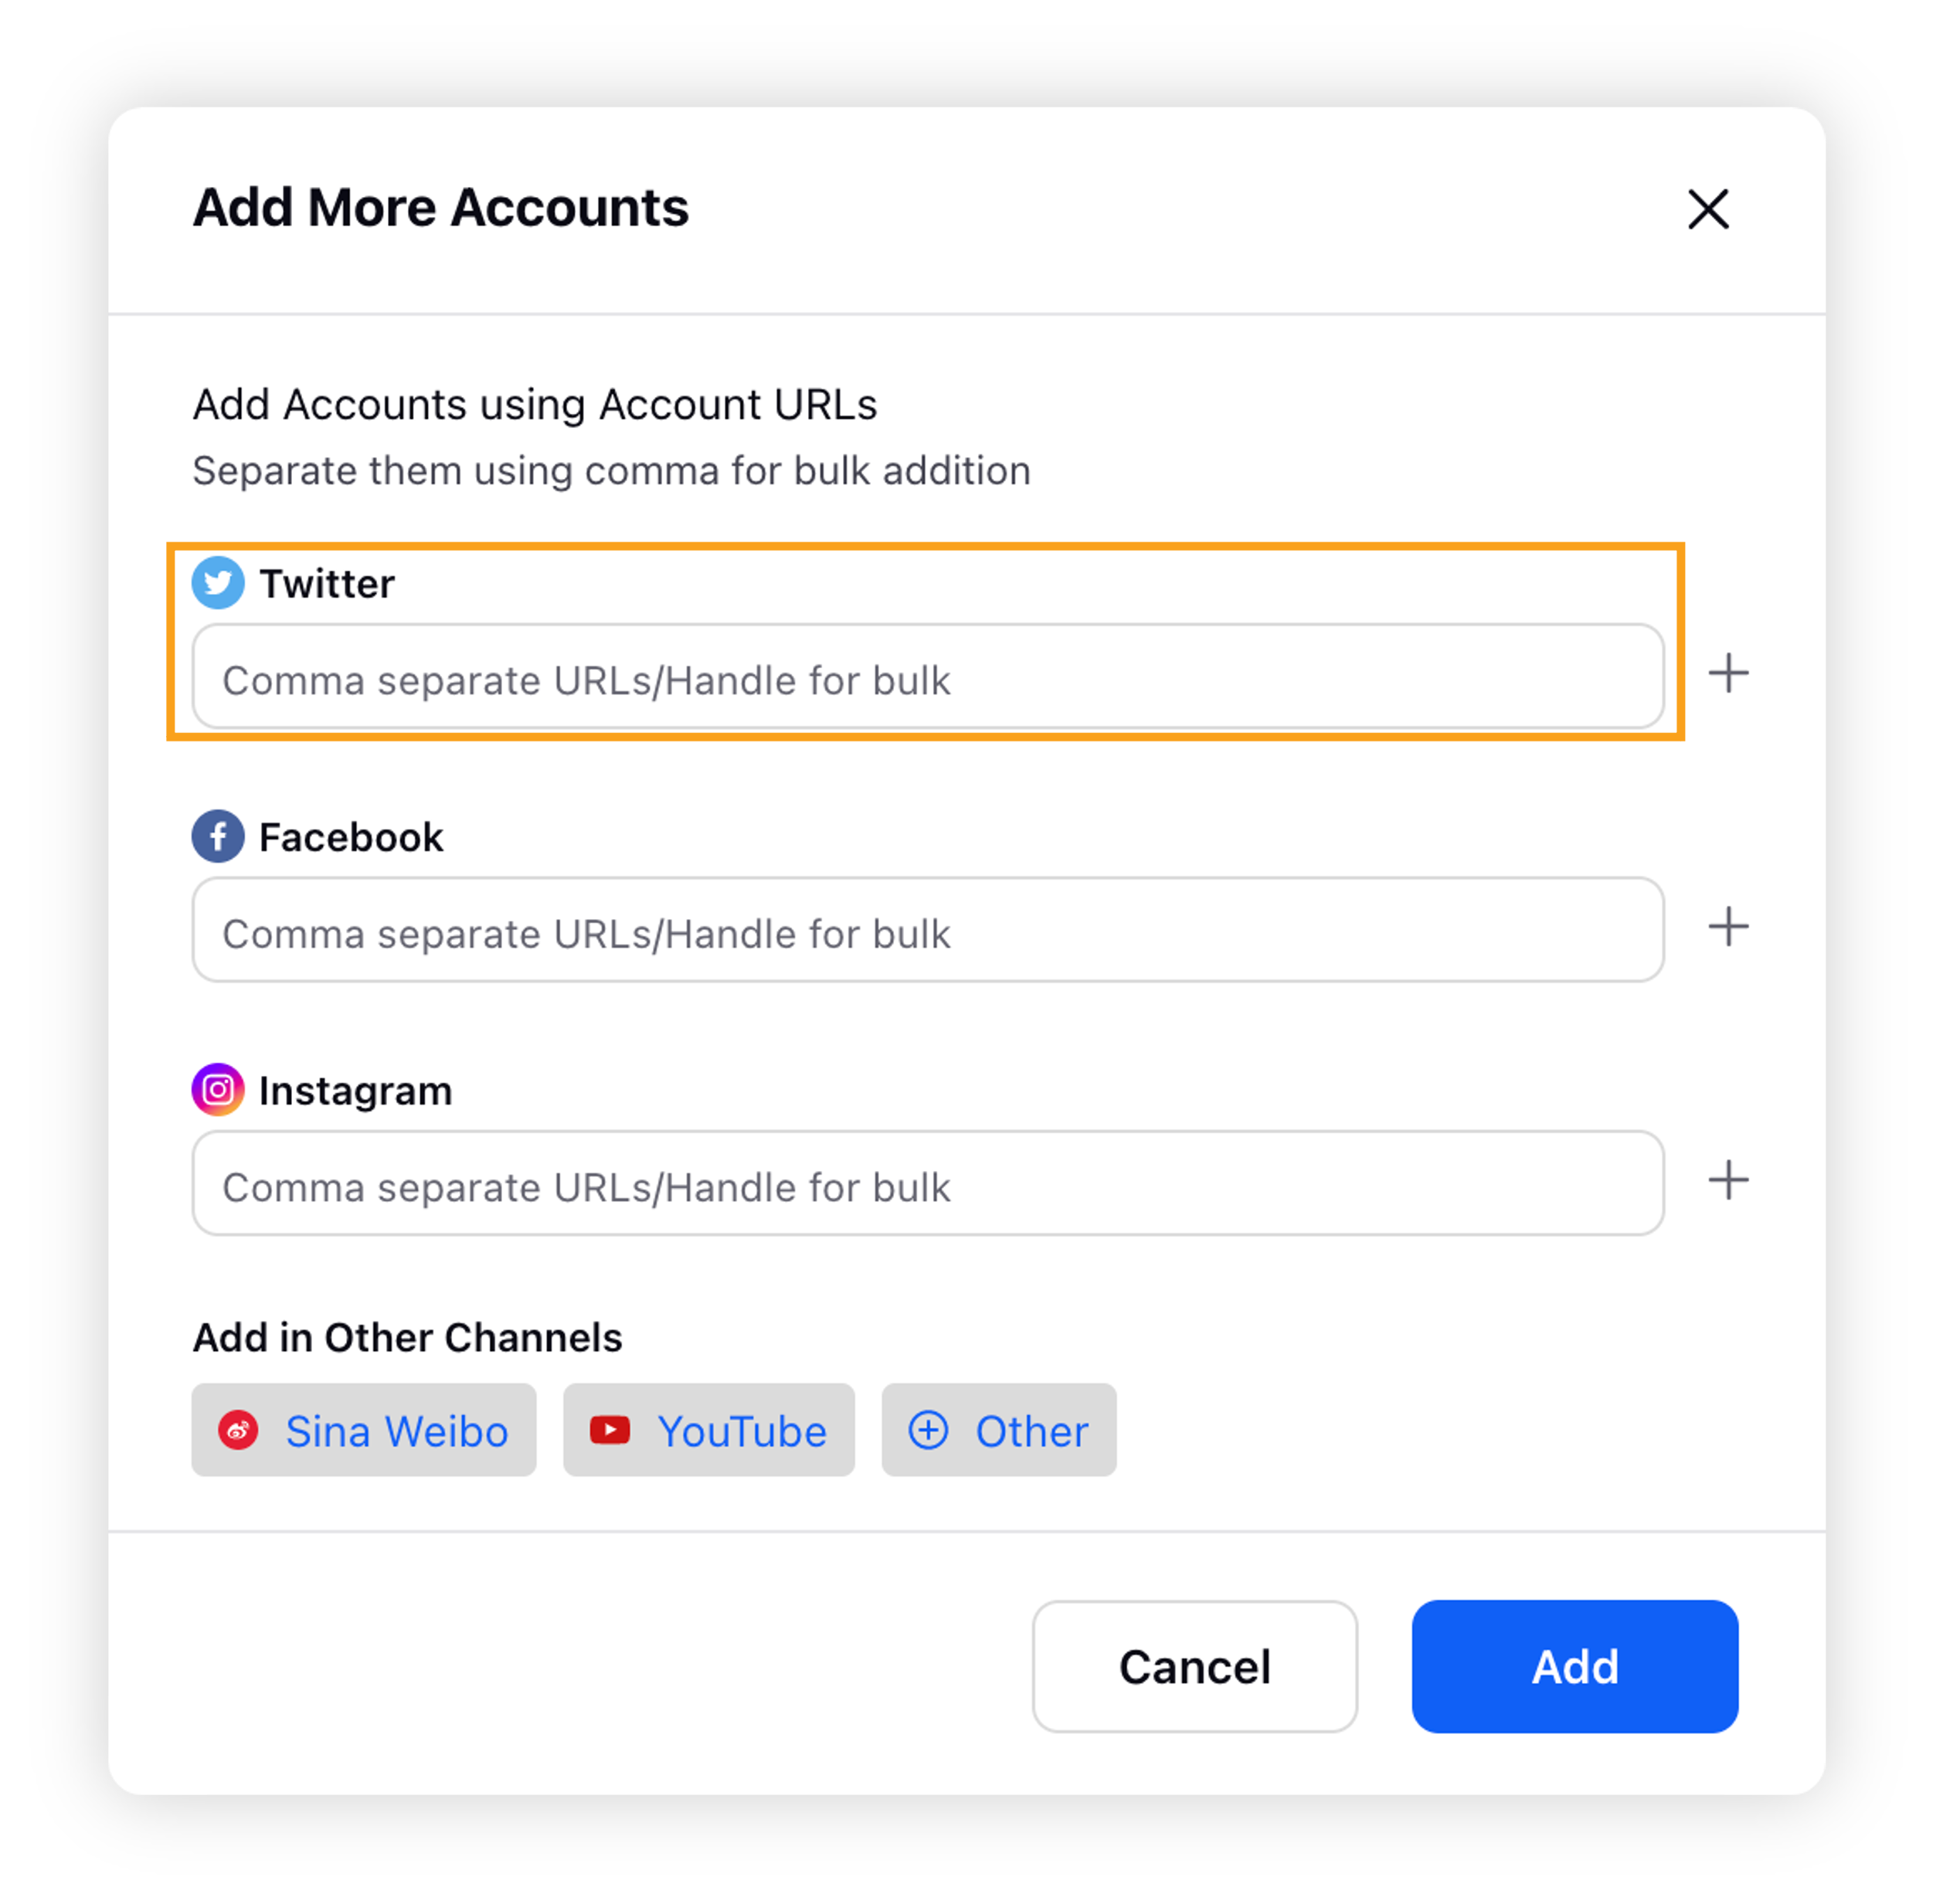
Under the Account section, click Add More Accounts to add a new account.
On the Add More Accounts popup window, enter single or multiple URLs of the Twitter accounts to be added.

Click Add. For successful addition, a success message will be displayed saying "URLs have been successfully added to our database". On failure, an error message will be displayed as "Please correct the errors and resubmit".
Click Save.
Limitations
It might take between 2 to 24 hours for data to populate on the Benchmarking dashboards. There is no fixed time frame.
While adding account URLs, make sure you keep your account URLs fixed to the domain name, excluding the remaining path in the Add Account URL fields. For example –
Incorrect way – http://abc123.com/solutions/example=...test2#section3 (will not fetch results for that account)
Correct way – http://abc123.com/solutions
A maximum of 10 accounts can be added at a time in the Add URL section with comma(,) separated.
Only public Twitter accounts can be added to Benchmarking.