Chord Chart widget
Updated
The Chord Chart widget is a visualization that can help users analyze the relationship between two categories. It displays a circular diagram where an arc represents each category, and the chords connecting them represent the strength and direction of the relationship between the categories.
Thicker chords on the Chord chart represent stronger relationships, while the sentiment associated with each relationship is color-coded, with positive sentiment displayed in green and negative sentiment displayed in red.

Key use cases
Chord Charts are helpful in analyzing complex data sets with numerous variables and relationships by identifying patterns and connections not easily noticeable in raw data, leading to insights and data-driven decisions.
Chord charts aid social media analysts in identifying brand mentions' most common phrases and their correlation with other topics discussed in the same context.
By displaying the connections between a social media campaign and other related topics or hashtags mentioned, chord charts facilitate tracking the campaign's success.
Chord charts help analyze influencers' relationships with their followers or other influencers, thus understanding their potential impact and interaction with others in the same category.
To create a Chord Chart widget
To plot the Chord Chart widget, you can use any existing editable dashboard or create a new one. Refer to this article to learn how to set up a custom dashboard.
Once you have the dashboard where you want to add the visualization widget, follow the steps below –
On the custom dashboard, click Add Widget in the top right corner.

On the widget builder, enter the widget's name and select Listening as Data Source.
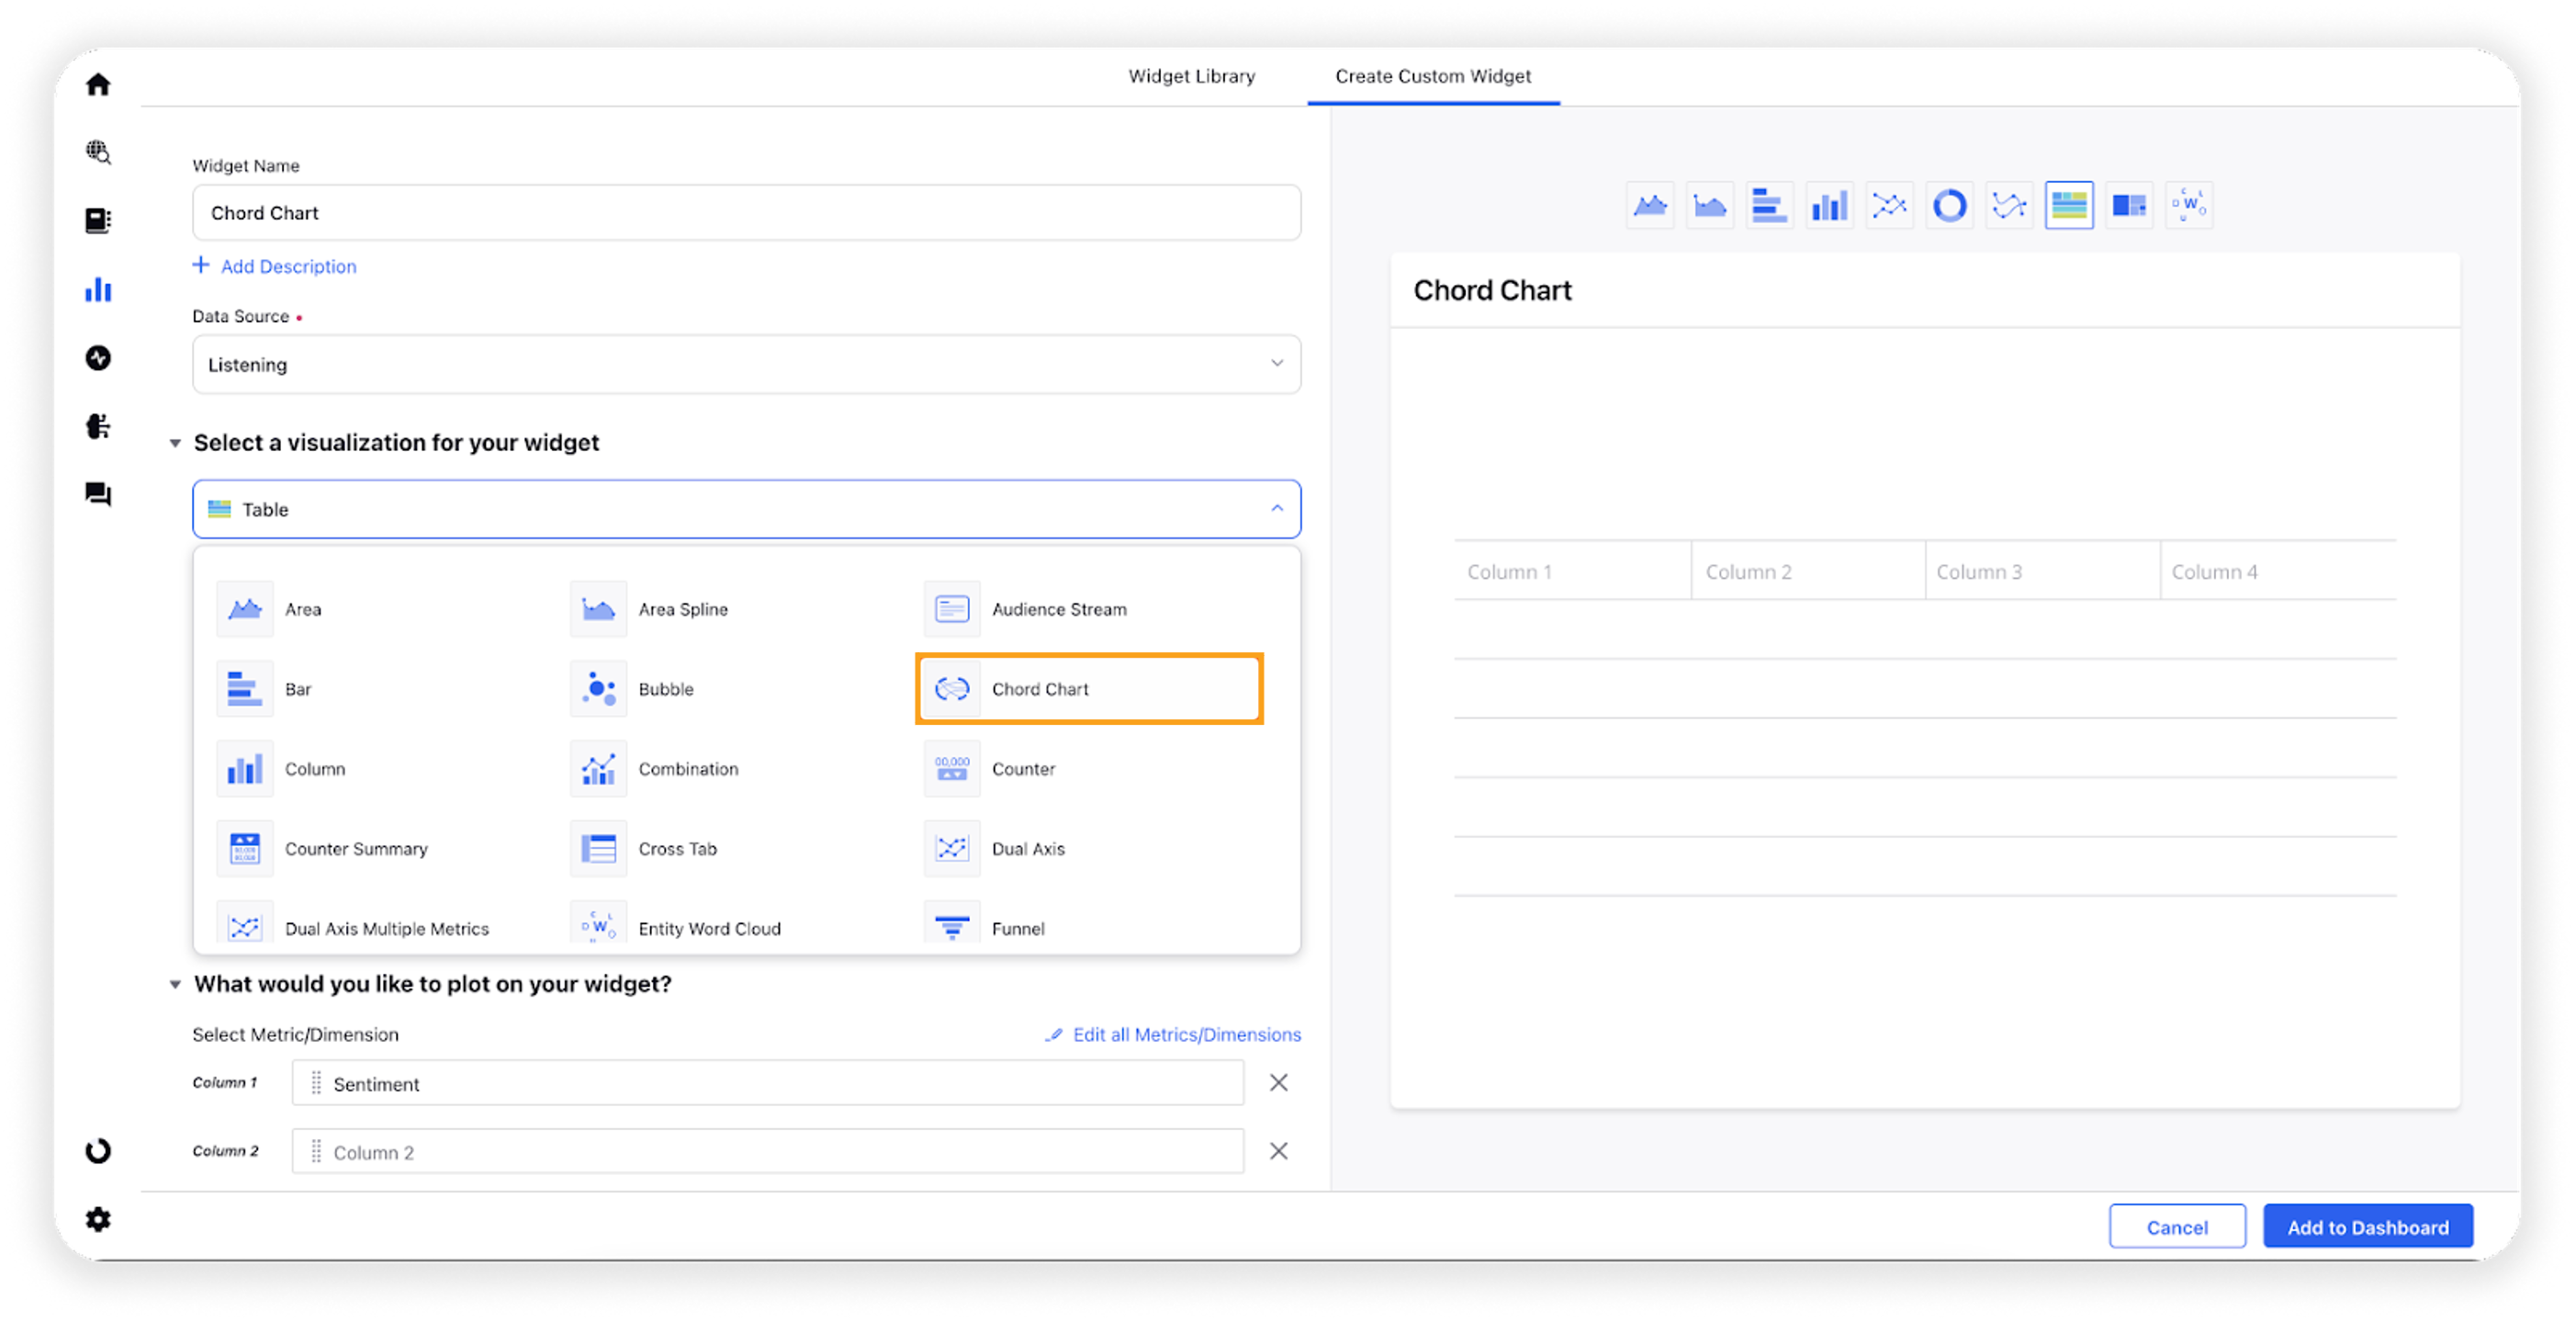
Select Chord Chart as a visualization type for your Listening widget.
Under the What would you like to plot on your widget section, you choose any two desired dimensions in Value 1 and Value 2 between whom you want to plot the relationship and choose a metric to plot it in Series.
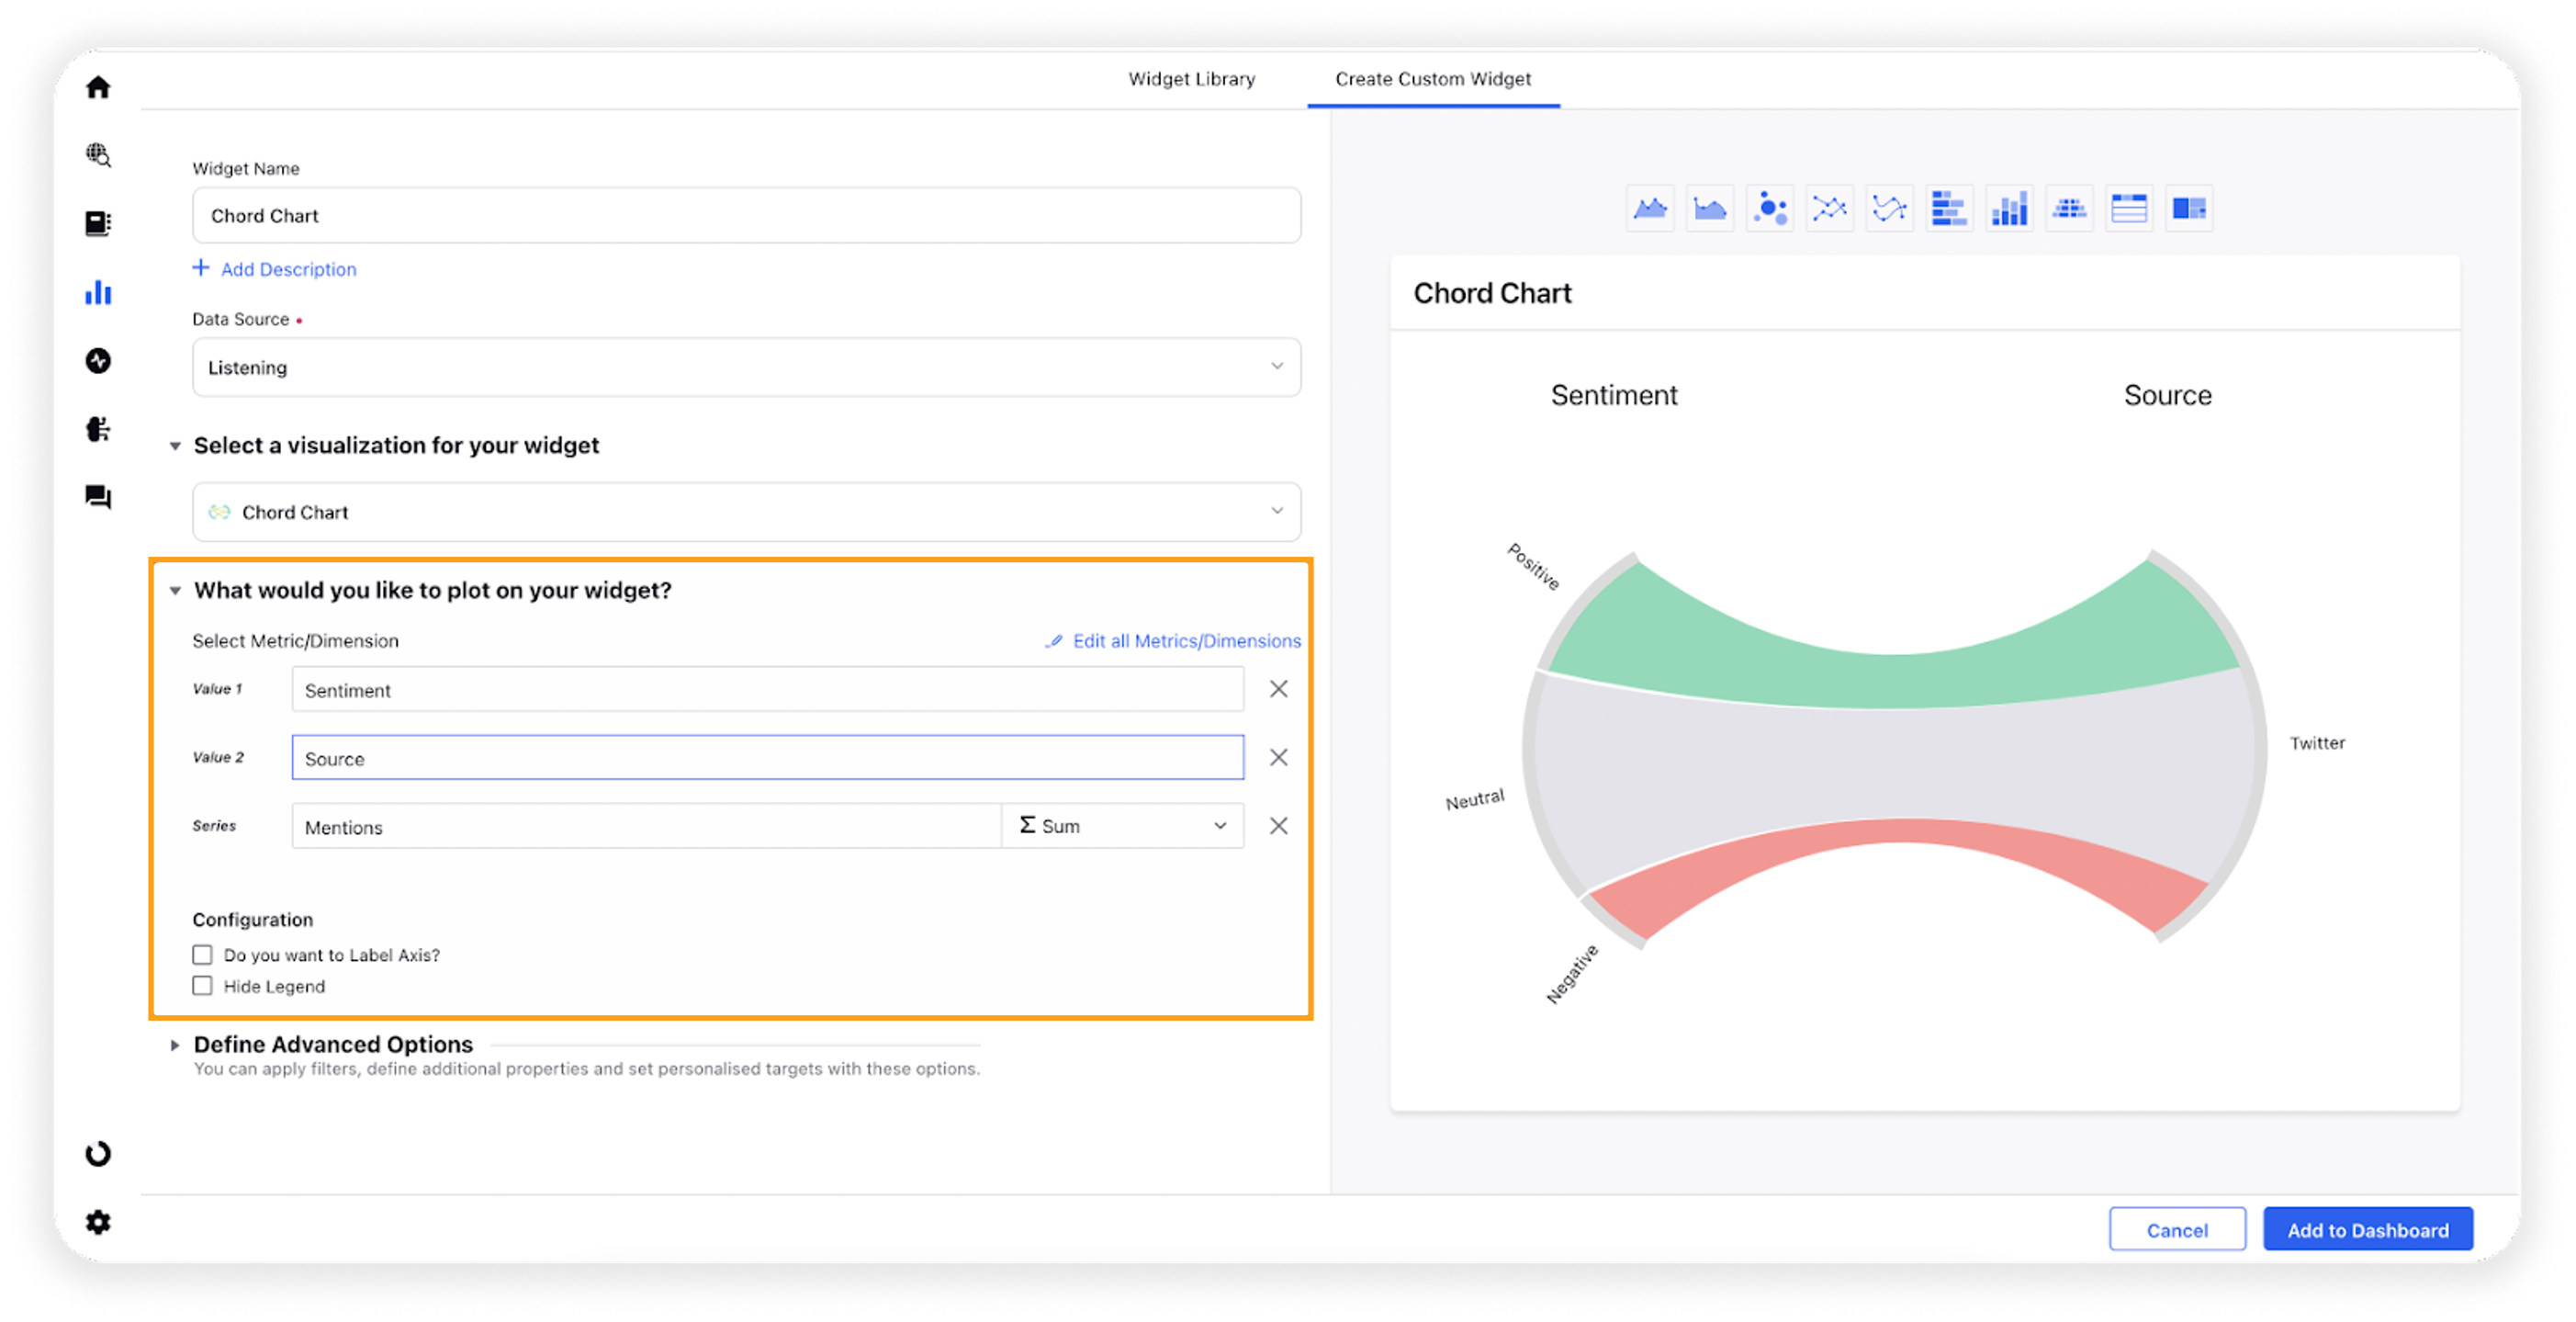
Select the configuration options as desired –
Configuration Option
Action
Do you want to Label Axis?
If you want to add names for your Axis, you can select this configuration option, and then you can enter the desired names as labels.
Show Total
Selecting this option will show the sum total of the metric for each column.
Under the Defined Advanced Options section, you can apply filters, define additional properties and set personalized targets with these options.
Click Add to Dashboard on the bottom right corner to create your new widget.