Funnel widget
Updated
A Funnel chart is a type of widget used to represent the stages in a process, often used to visualize a sales process. It is called a funnel chart because it looks like a funnel, with a wide opening at the top and a narrow opening at the bottom. The width of each section of the funnel represents the amount of data that passes through that particular stage of the process.
The stages in a funnel chart are typically ordered from the largest amount of potential revenue at the top to the smallest at the bottom. This allows for a visual representation of the sales process, highlighting areas where the most significant revenue potential exists and where there may be drop-offs or bottlenecks.
Key use cases
eCommerce: The Funnel widget can be used by an eCommerce business to track the purchasing behavior of different buyer personas, identifying at which stage they drop off and optimizing the user experience to increase conversions.
Campaign Monitoring: The Funnel widget can help track the campaign success process for different attendee personas, identifying which groups are more likely to convert and where they may be losing potential leads.
Funnel charts can be used to track the progress of sales and marketing efforts, from initial lead generation to closing deals, and can help identify areas of the process that need improvement. They can also be used to track the progress of other types of processes, such as customer acquisition or recruitment.
To add a Funnel widget
To plot the Funnel widget, you can use any existing editable dashboard or create a new one. Refer to this article to learn how to set up a custom dashboard.
Once you have the dashboard where you want to add the visualization widget, follow the steps below –
On the custom dashboard, click Add Widget in the top right corner.
On the widget builder, enter the widget's name.
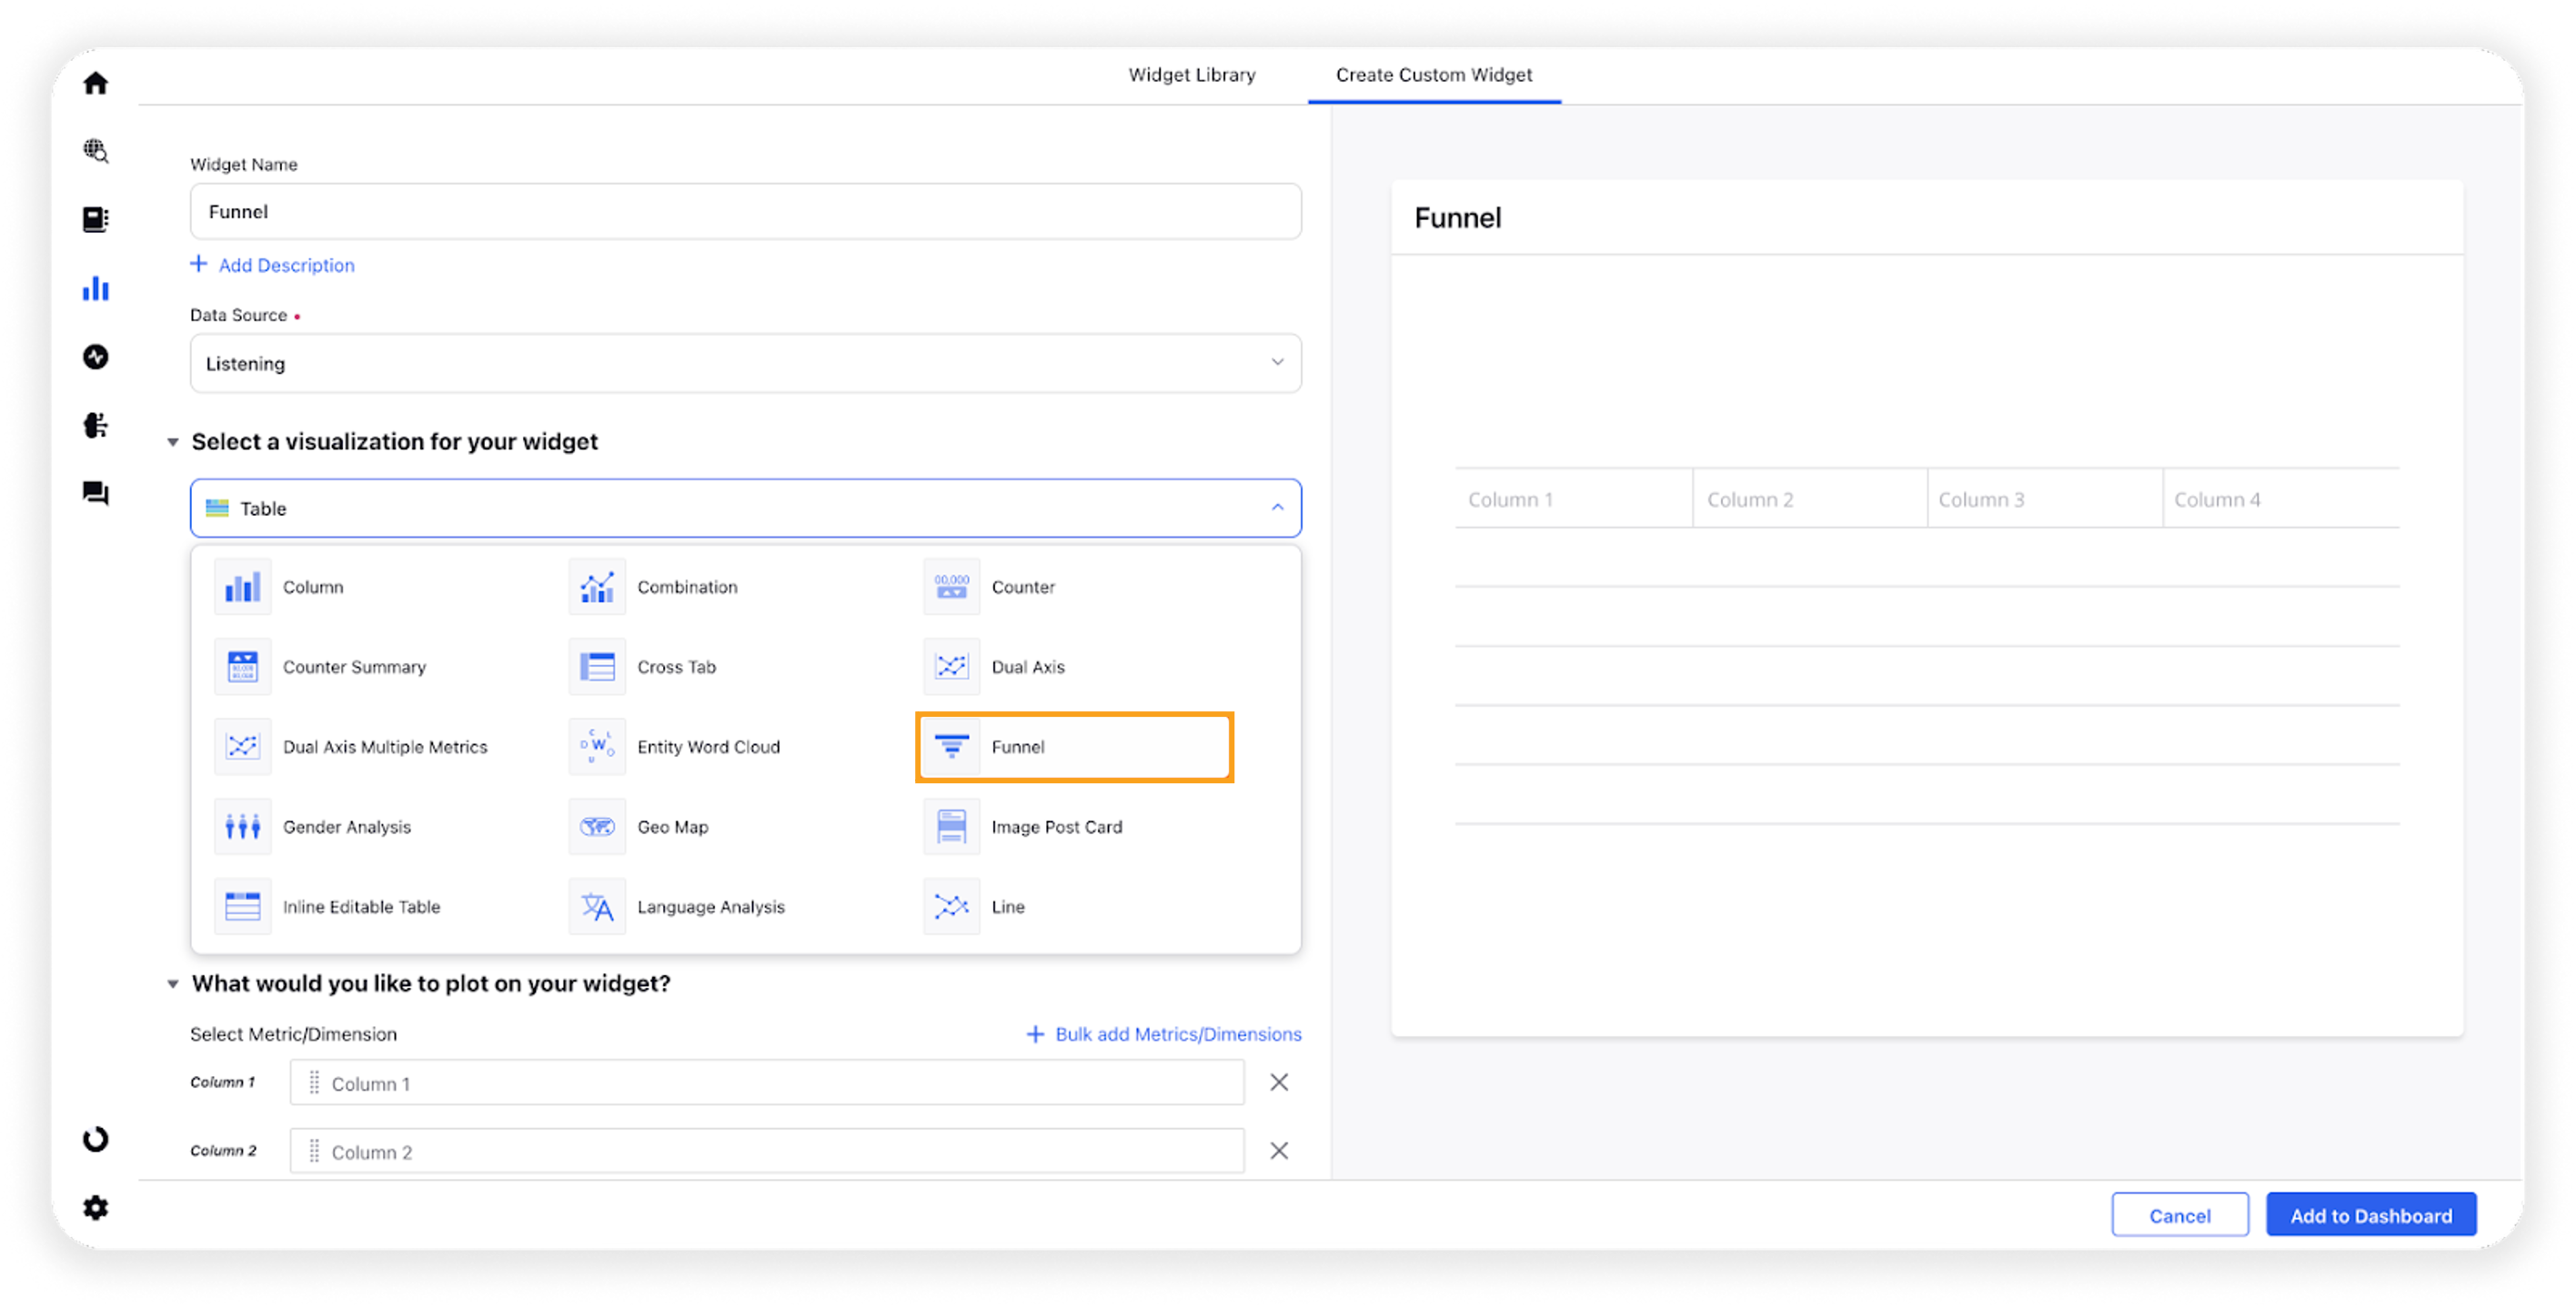
Select Funnel as a visualization type for your widget.

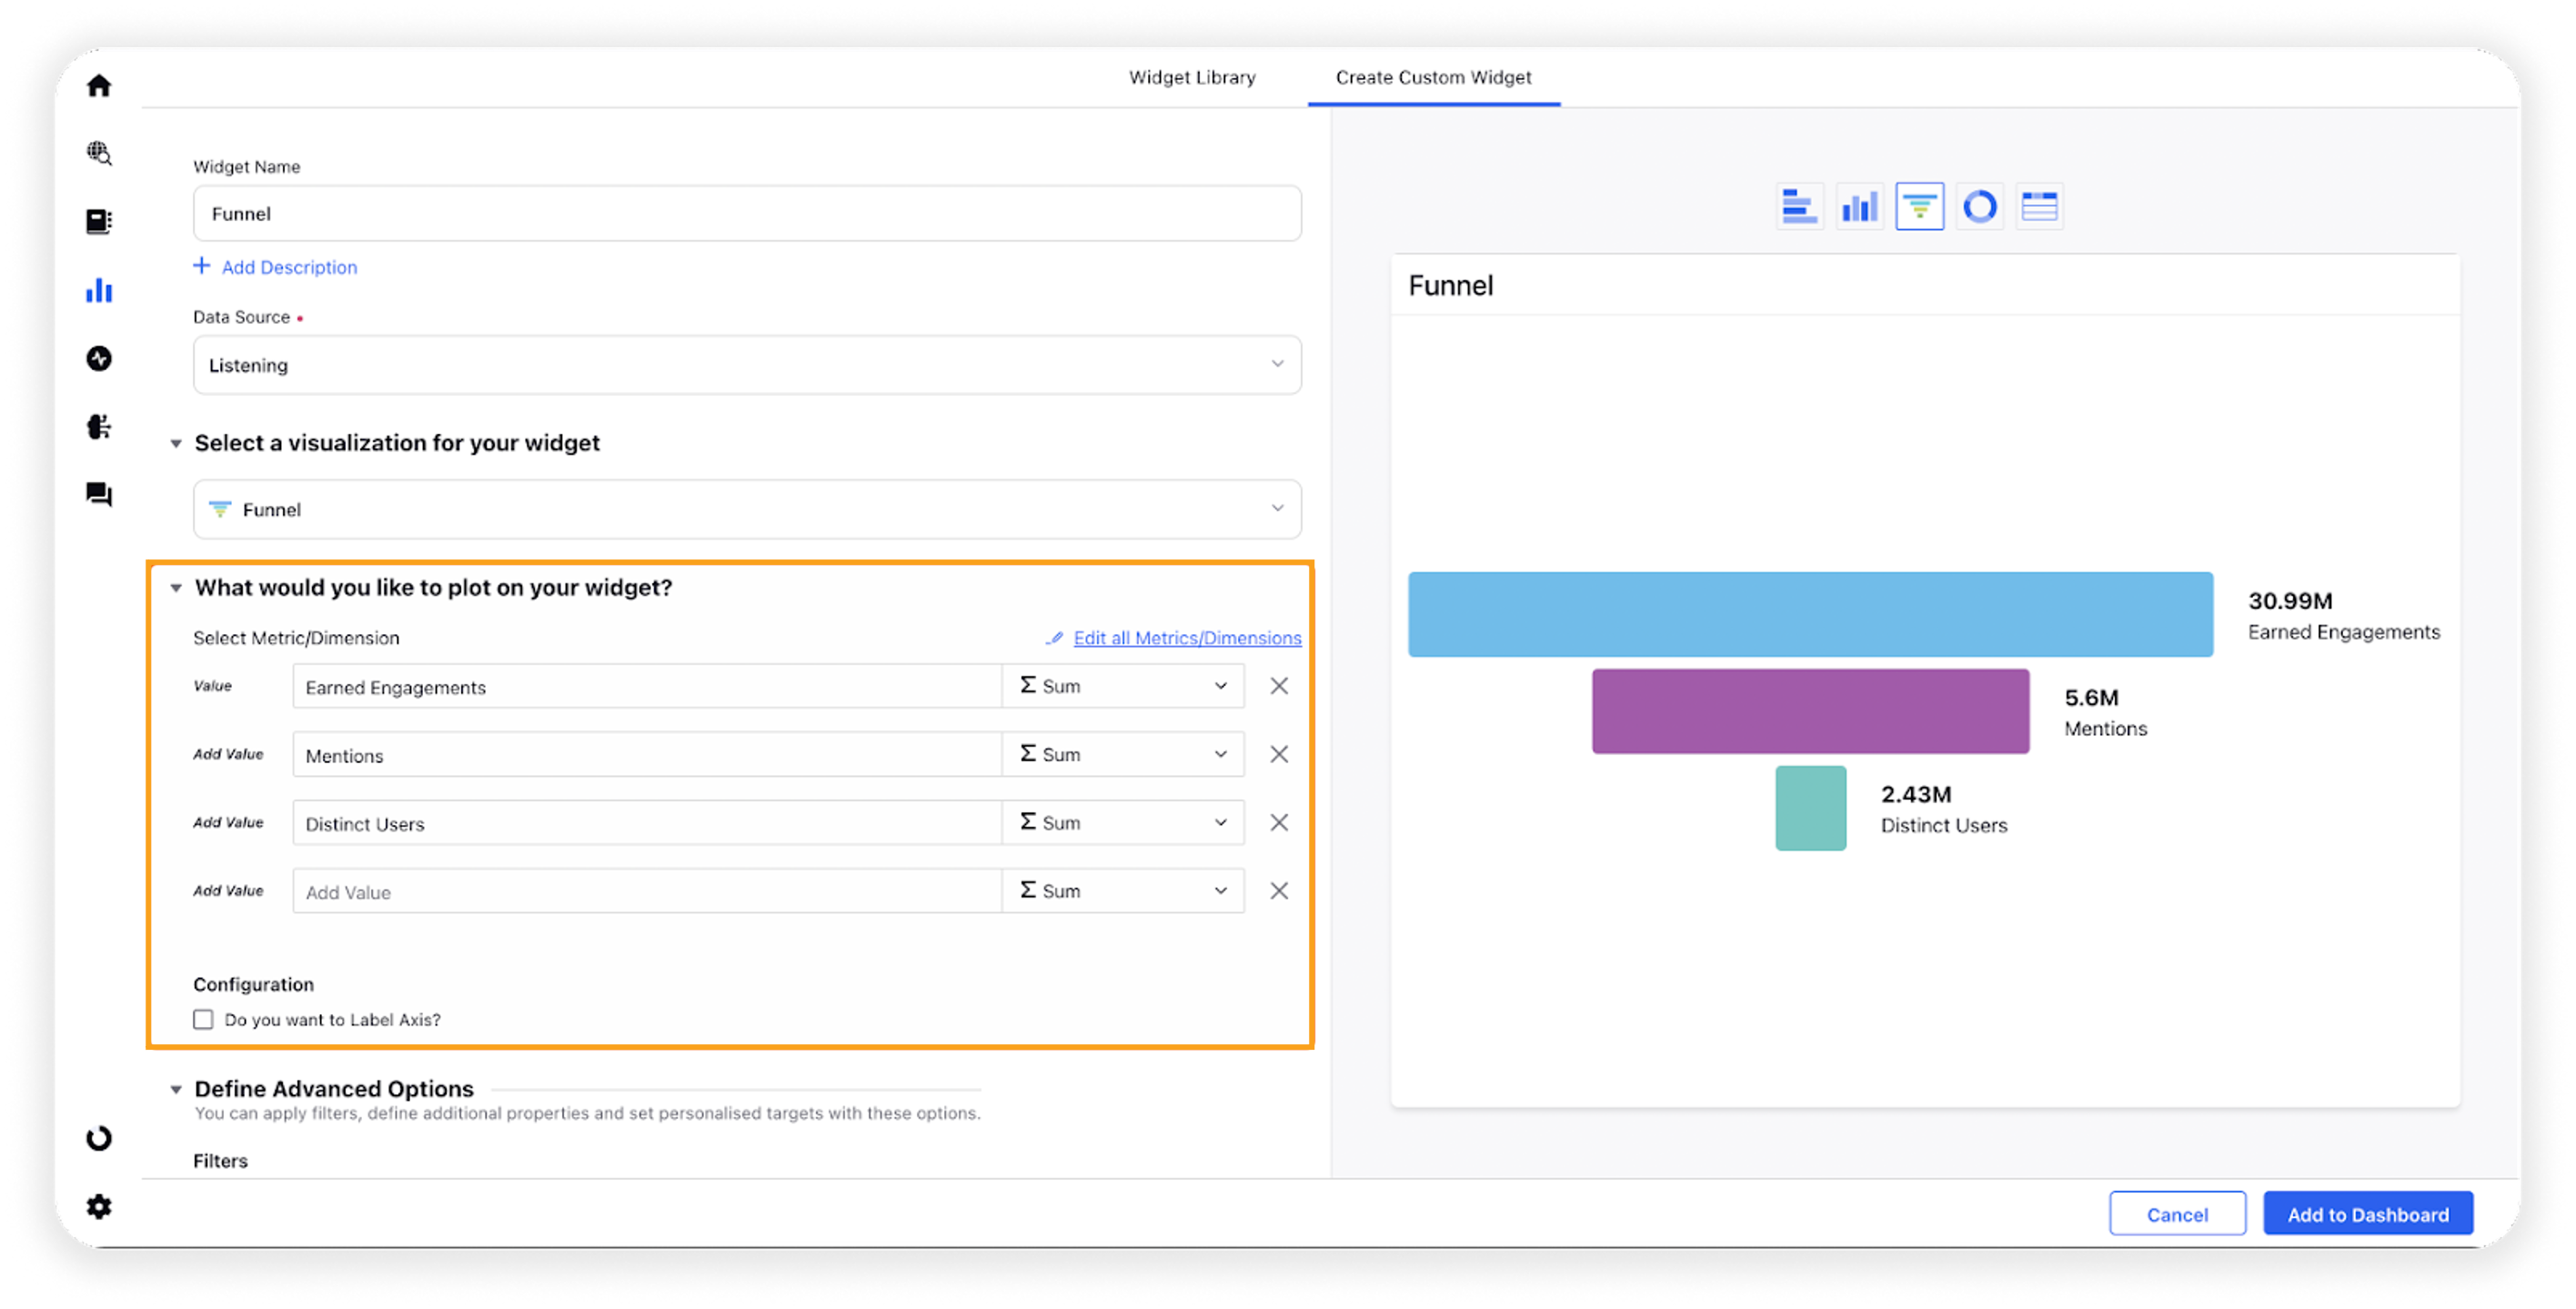
Under the What would you like to plot on your widget section, you can choose your desired metrics and dimensions to plot. You will also have the option of Bulk Add Metrics/Dimensions where you can select all the metrics/dimensions in one go which will be adjusted in the funnel.

Select the configuration options as desired –
Configuration Option
Action
Do you want to Label Axis?
If you want to add names for your Axis, you can select this configuration option, and then you can enter the desired names as labels.
Under the Defined Advanced Options section, you can apply filters, define additional properties and set personalized targets with these options.
Click Add to Dashboard on the bottom right corner to create your new widget.