Geo Map Widget
Updated
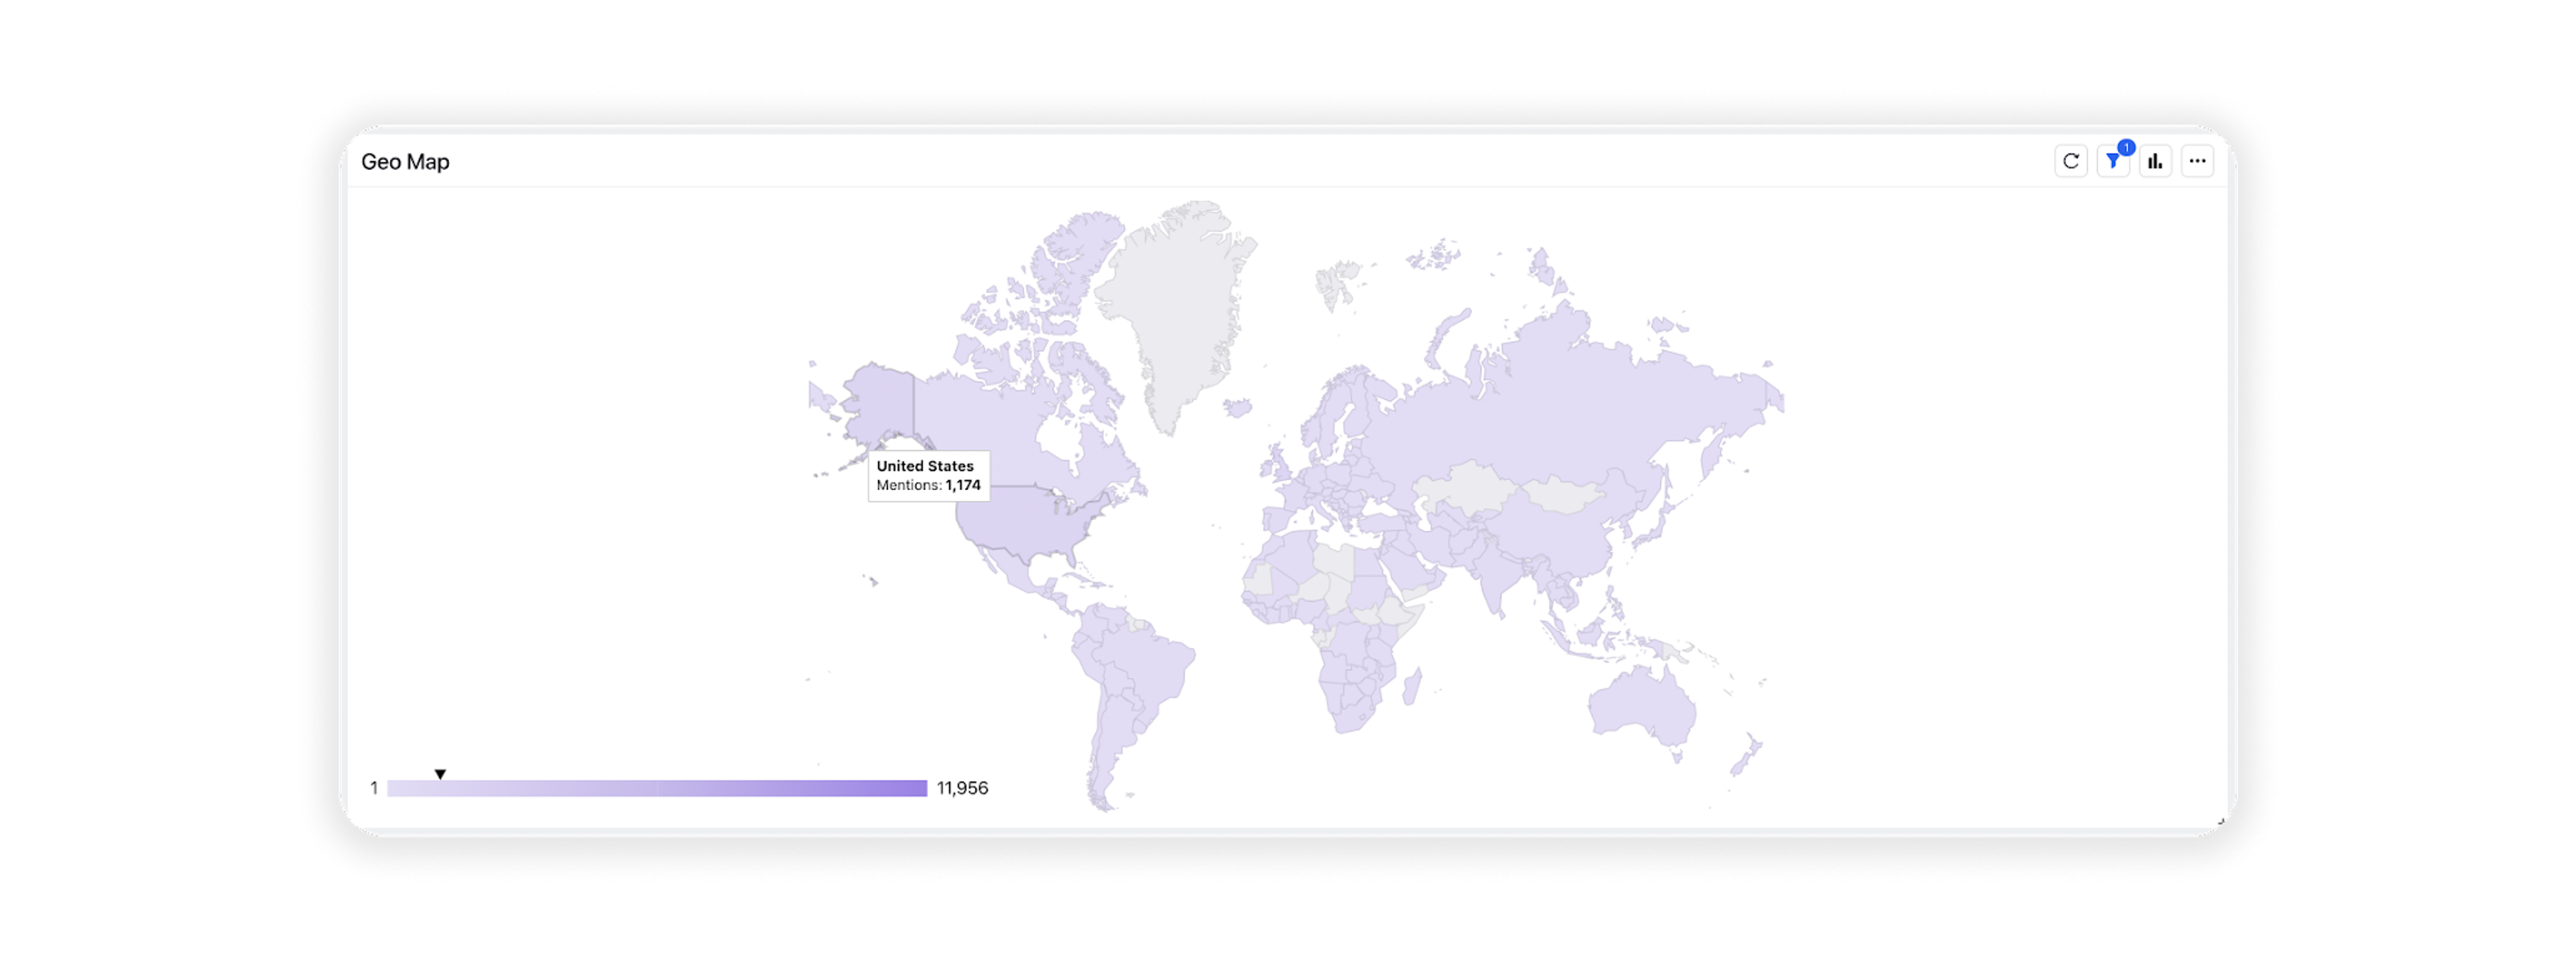
A Geo Map widget provides an easy-to-understand visual representation of data across different geographic regions. Each country is represented by a shade to reflect the value of the data being displayed.

To add a Geo Map widget
Note: The Geo Map widget can be added to any custom Listening dashboard if you have permission to edit it. You can use any editable dashboard or create a new one to get started.
Once you have the dashboard where you want to perform a comparative study, follow the steps shown below –
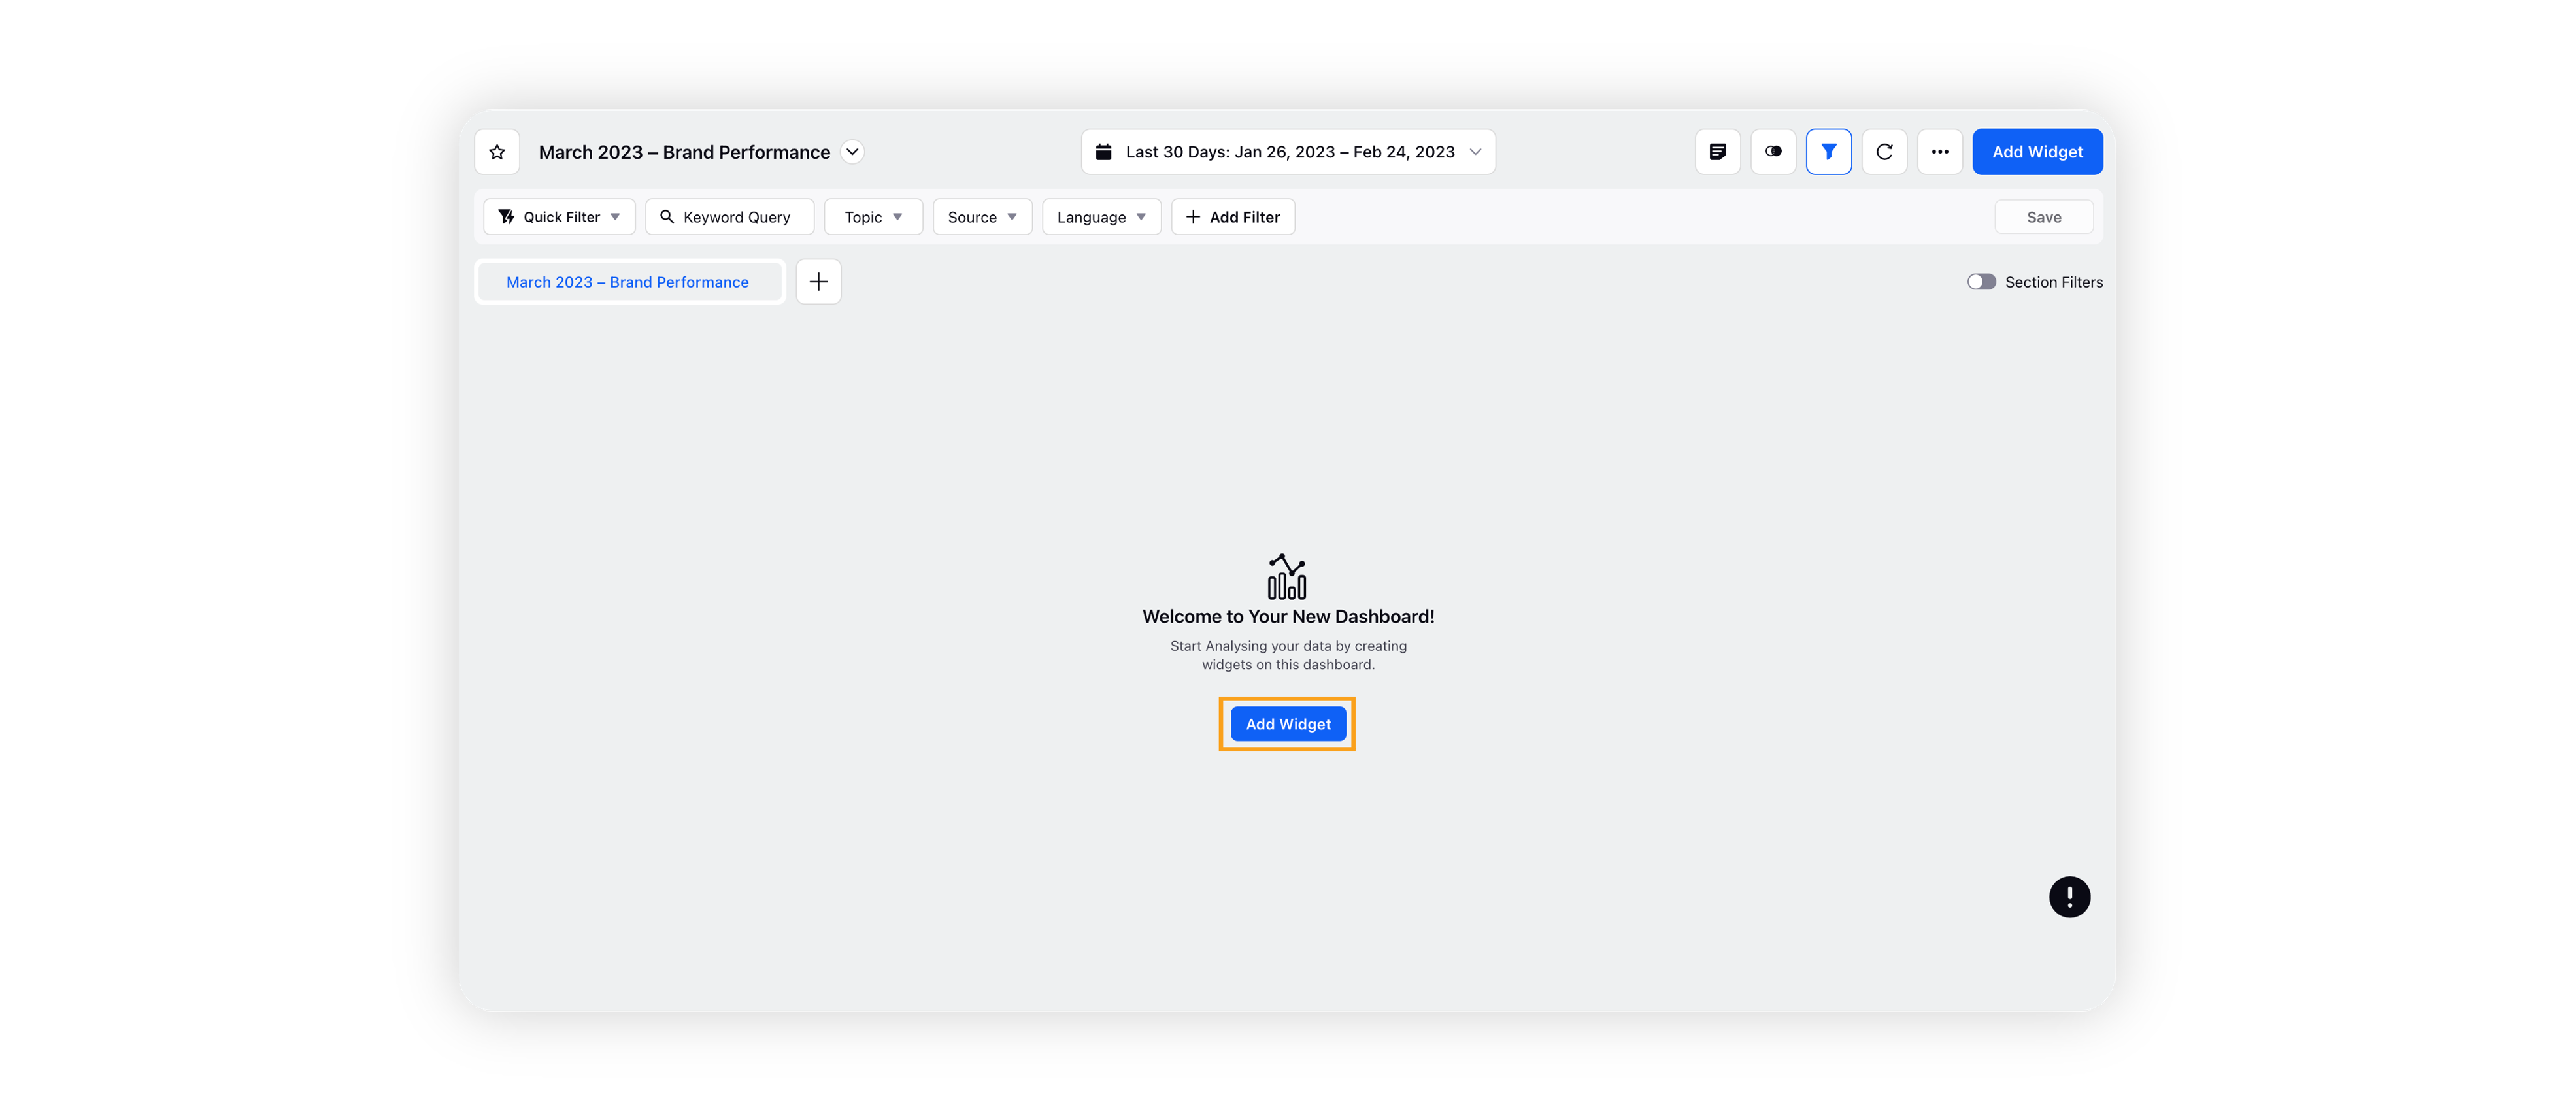
On the custom dashboard, click Add Widget in the top right corner.

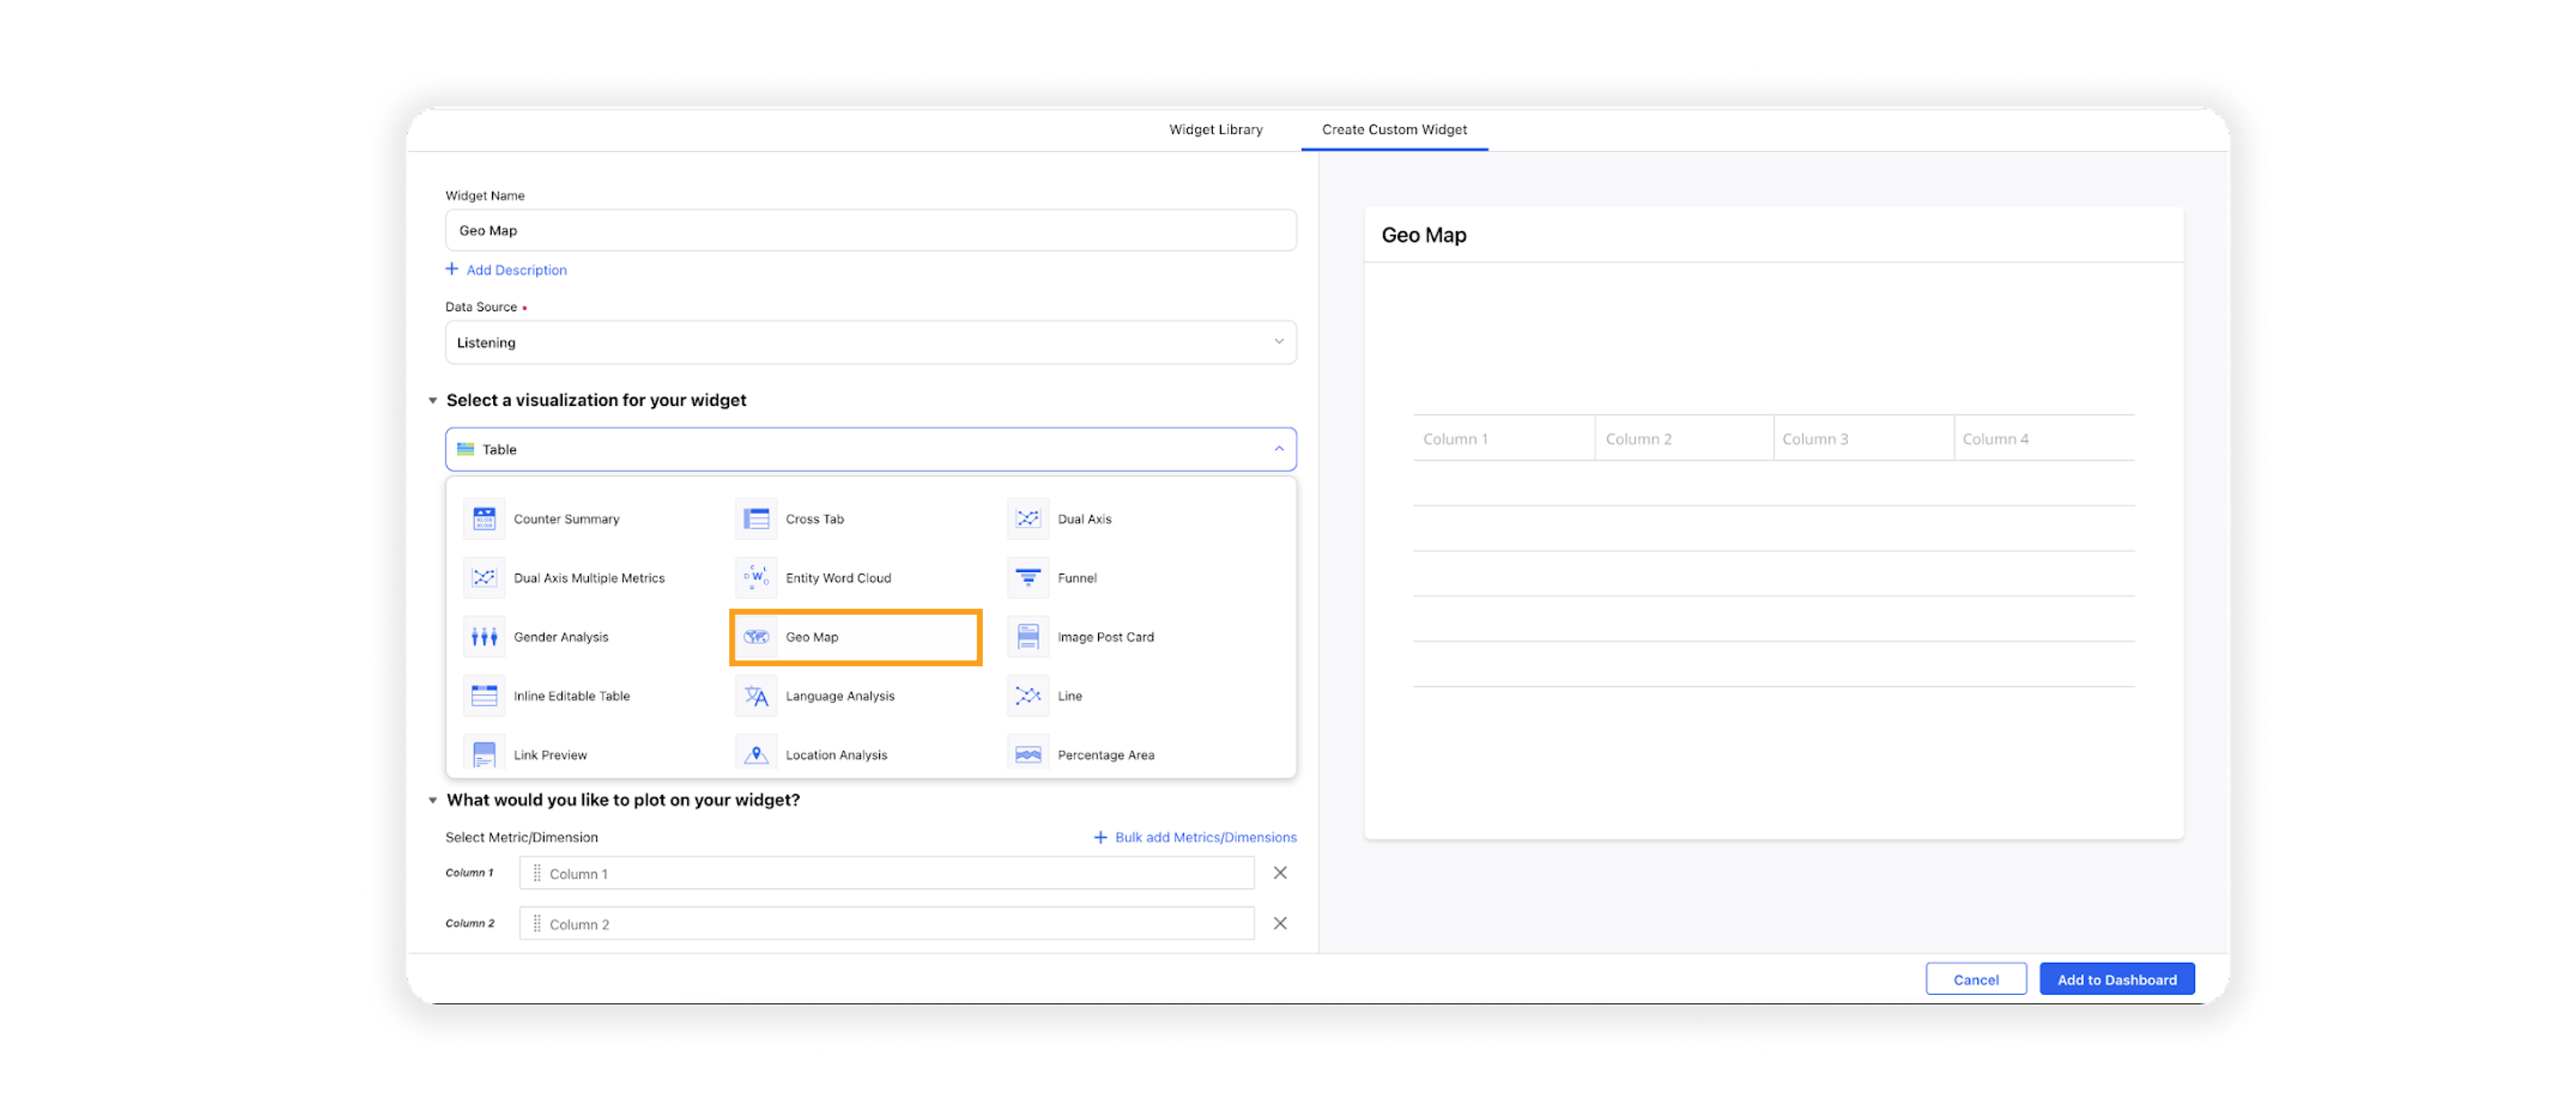
On the widget builder, enter the widget's name, and select Listening as Data Source.
Select Geo Map as a visualization type for your Listening widget.

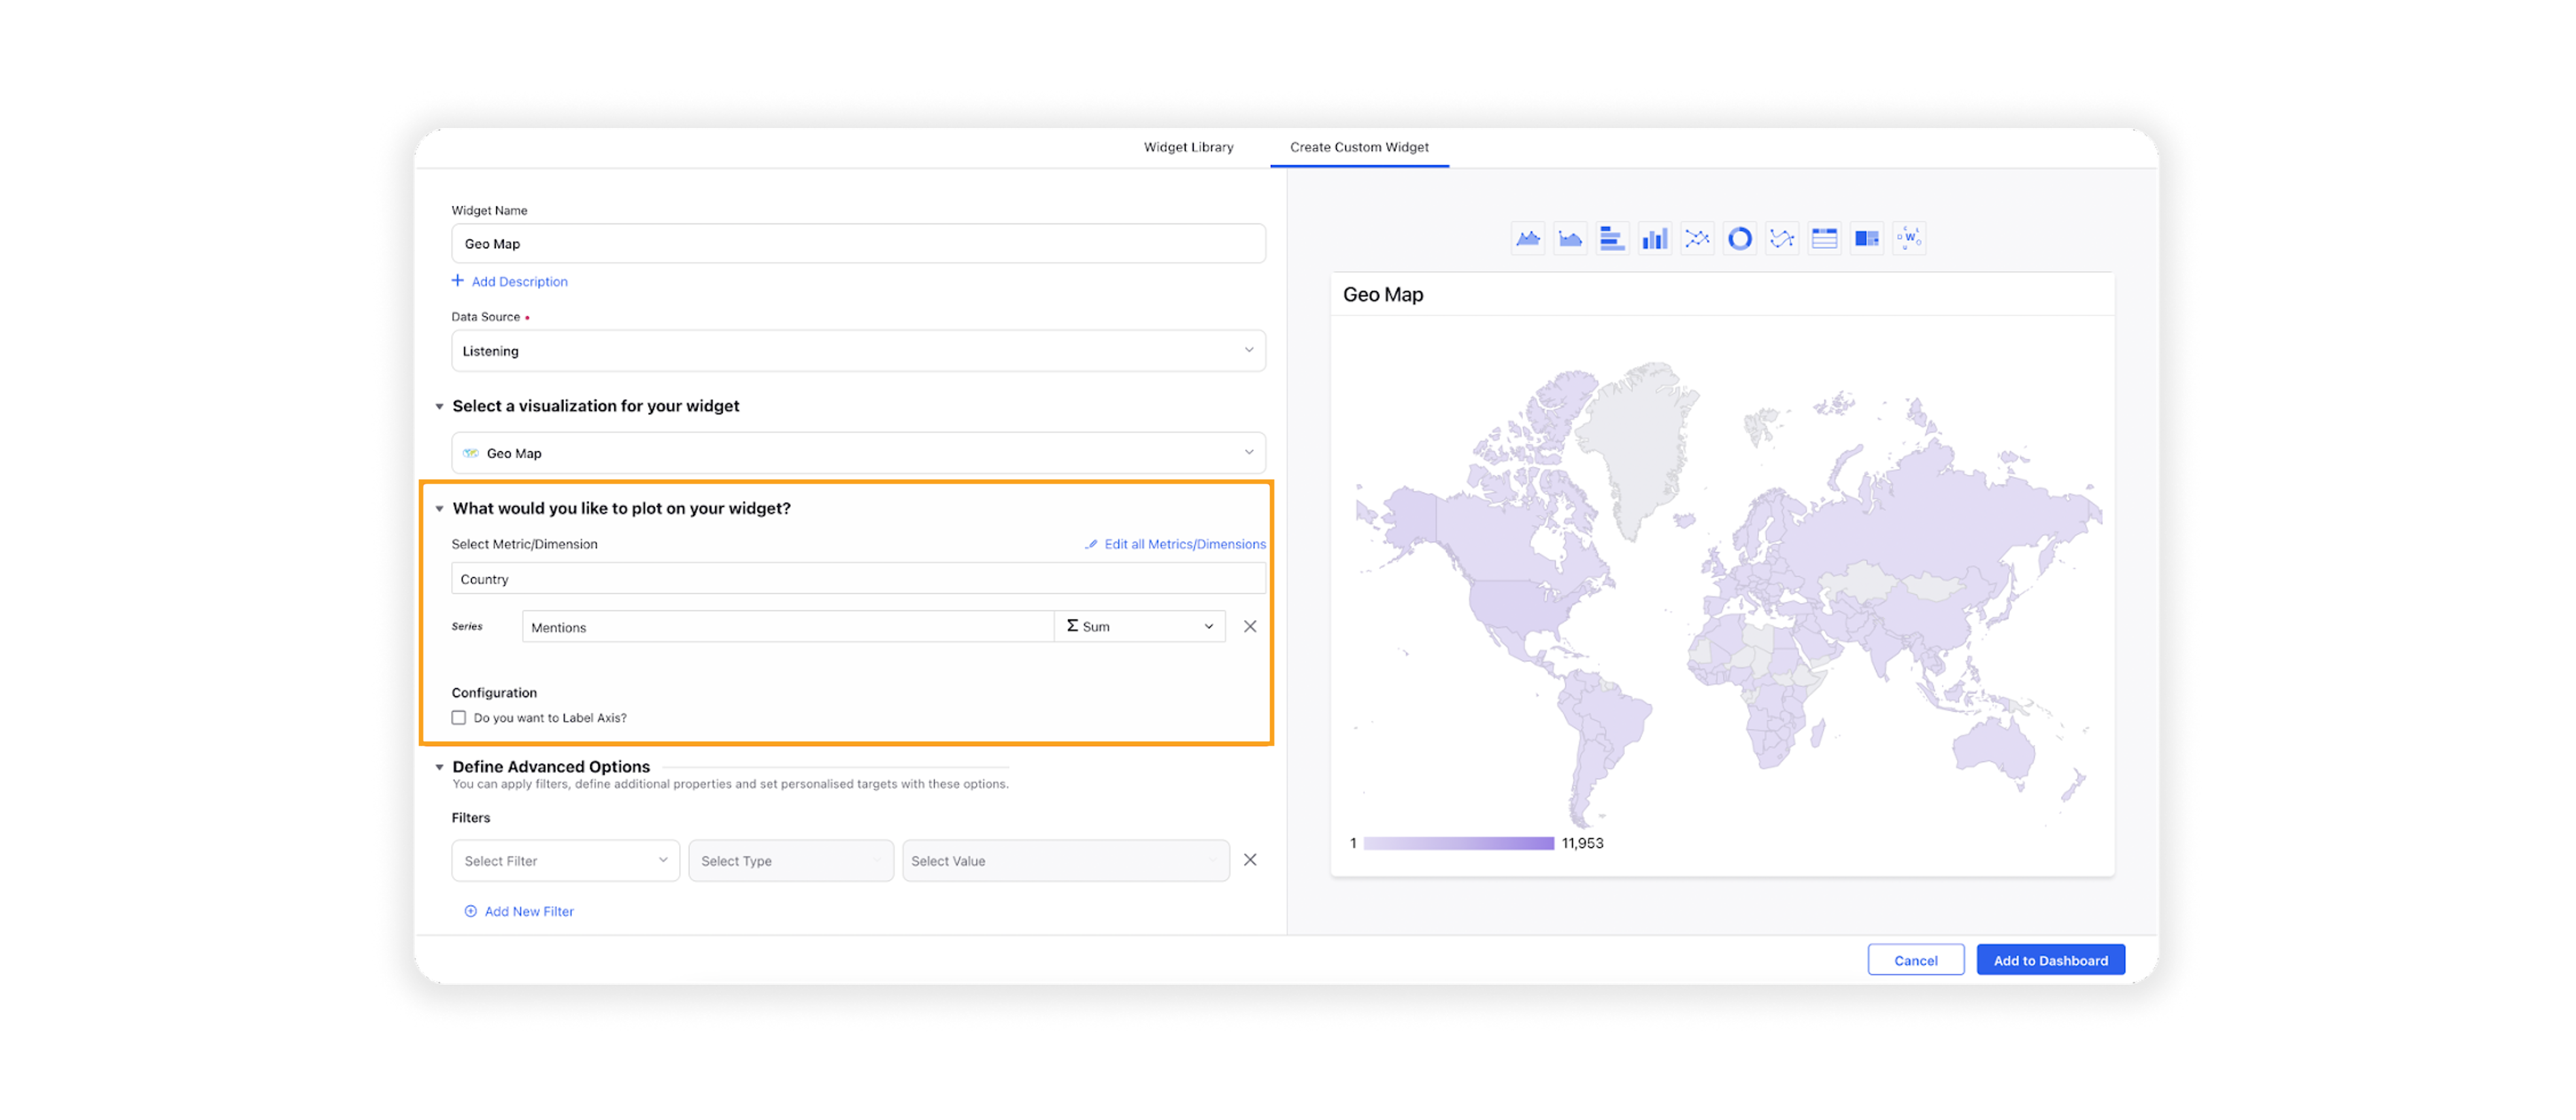
Upon selecting the Geo Map widget, the dimension Country and the metric Mentions will be prefilled.

Note: The dimension field will be uneditable, whereas you can change the pre-added metric (Series) as per your use case.
Under the Defined Advanced Options section, you can apply filters, define additional properties and set personalized targets with these options.
Click Add to Dashboard in the bottom right corner to create your new widget.