Stacked Twin Axis widget
Updated
The Stacked Twin Axis widget is a type of data visualization that combines two different types of charts in one plot to show multiple variables at once. The plot has two Y-Axis that shares the same X-Axis and displays different types of data.
In the given example, the X-Axis displays positive and negative mentions on either side of the axis respectively, while the Y-Axis displays the Created Time. The user can observe both the sentiment distribution, the trend, and total mentions on the same plot.
To create a Stacked Twin Axis widget
To plot the Stacked Twin Axis Widget, you can use any existing editable dashboard or create a new one. Refer to this article to learn how to set up a custom dashboard.
Once you have the dashboard where you want to add the visualization widget, follow the steps below –
On the custom dashboard, click Add Widget in the top right corner.

On the widget builder, enter the widget's name.
Select Stacked Twin Axis as a visualization type for your widget.
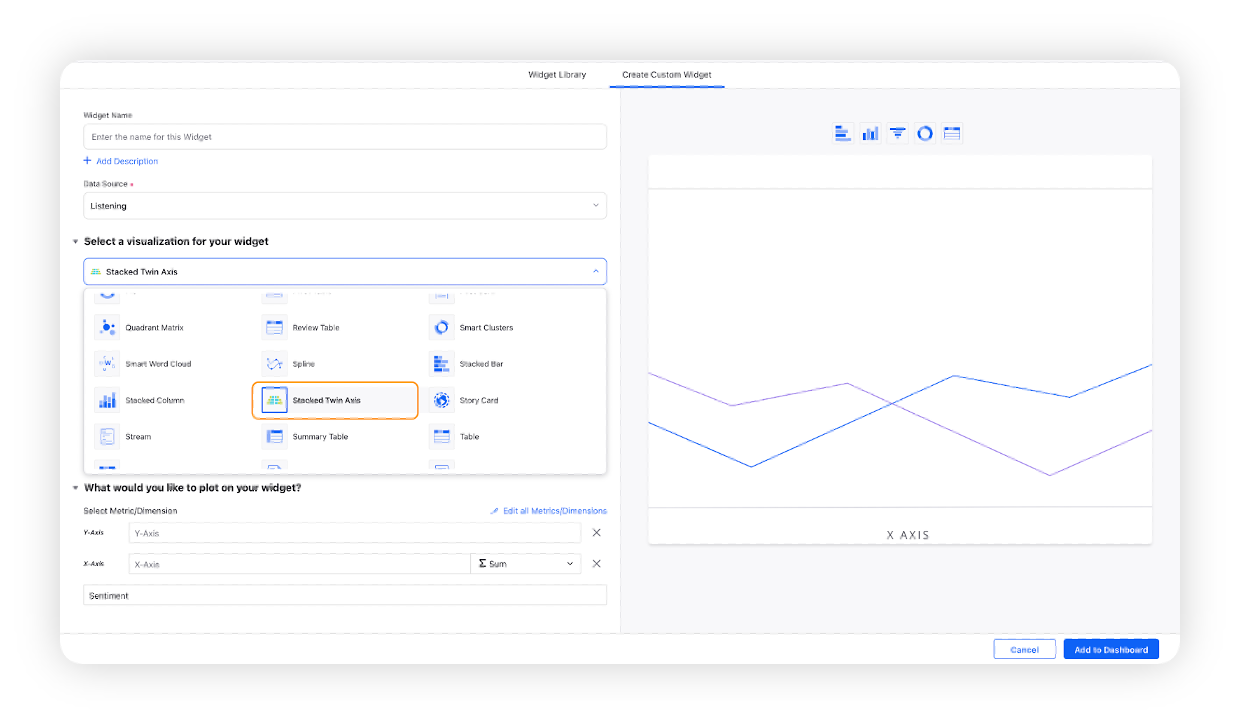
Under the What would you like to plot on your widget section, you will be given below fields –
Y-Axis: Select the required dimension. Here Created Time will be selected by default, which will be editable.
X-Axis: Select any metric/custom metric to be plotted on Y-Axis, e.g. Mentions
Sentiment will be selected by default based on which the X-Axis metric would be stacked
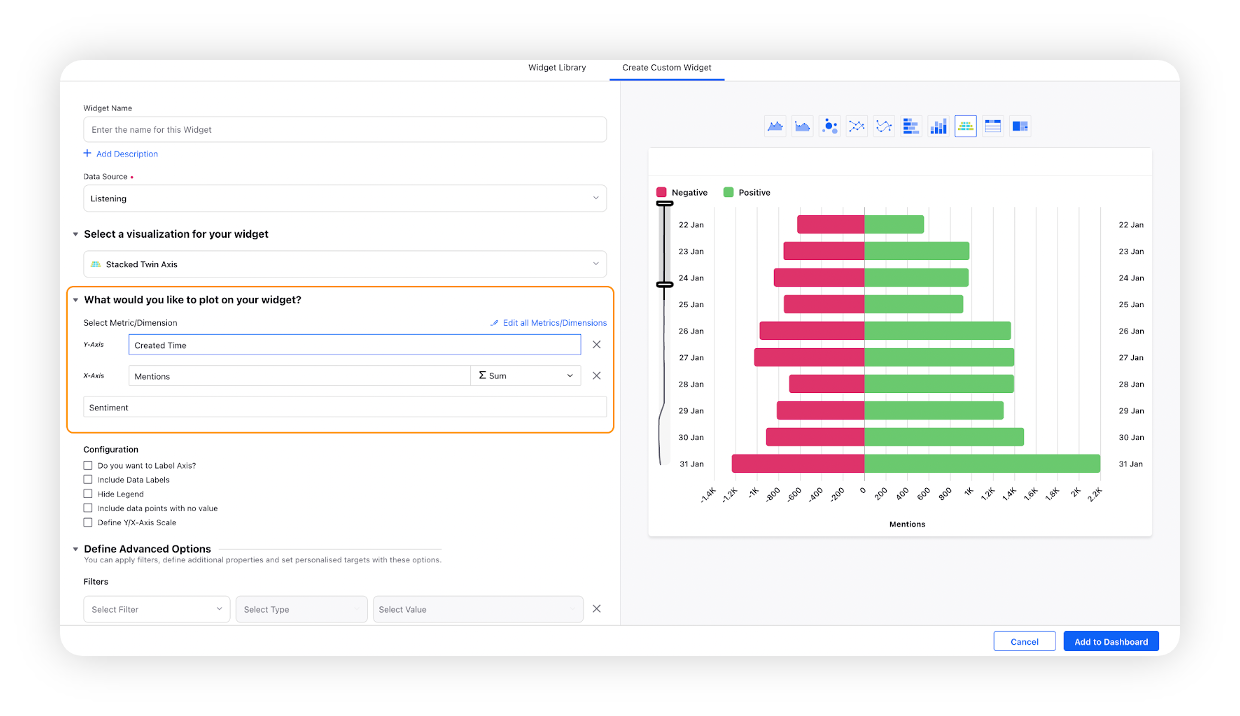
Select the configuration options as desired. For more information, refer to the Configuration Options section below.
Under the Defined Advanced Options section, you can apply filters, define additional properties and set personalized targets with these options.
Click Add to Dashboard on the bottom right corner to create your new widget.
Configuration options
The configuration options available for the Stacked Twin Axis widget will work as follows –
Configuration Option | Action |
Do you want to Label Axis? | If you want to add names for your Axis, you can select this configuration option, and then you can enter the desired names as labels. |
Include Data Labels | Selecting this option will include the data labels on the Stacked Twin Axis Widget. |
Hide Legend | Selecting this option will hide all the legends on the widget. |
Include Data points with no value | Selecting this option will include the data points that do not have any value. |
Define Y/X-Axis Scale | You can define the Min & Max of X-Axis and Y-Axis bounds. Also, you can adjust the step size of the X-Axis and Y-Axis to get the best-optimized visualization. For more information, refer to Define Y-axis scale in Widgets. |