Table Widget
Updated
The Table widget is a visualization widget that displays data in tabular form, with rows and columns. In a dashboard context, a table widget is often used to display key metrics and data points in a visually organized and easily digestible format.
The widget also provides the functionality to sort data in Ascending or Descending Order.
To create a Table Widget
To plot the Table widget, you can use any existing editable dashboard or create a new one. Refer to this article to learn how to set up a Custom Dashboard.
Once you have the dashboard where you want to add the visualization widget, follow the steps below –
On the custom dashboard, click Add Widget in the top right corner.
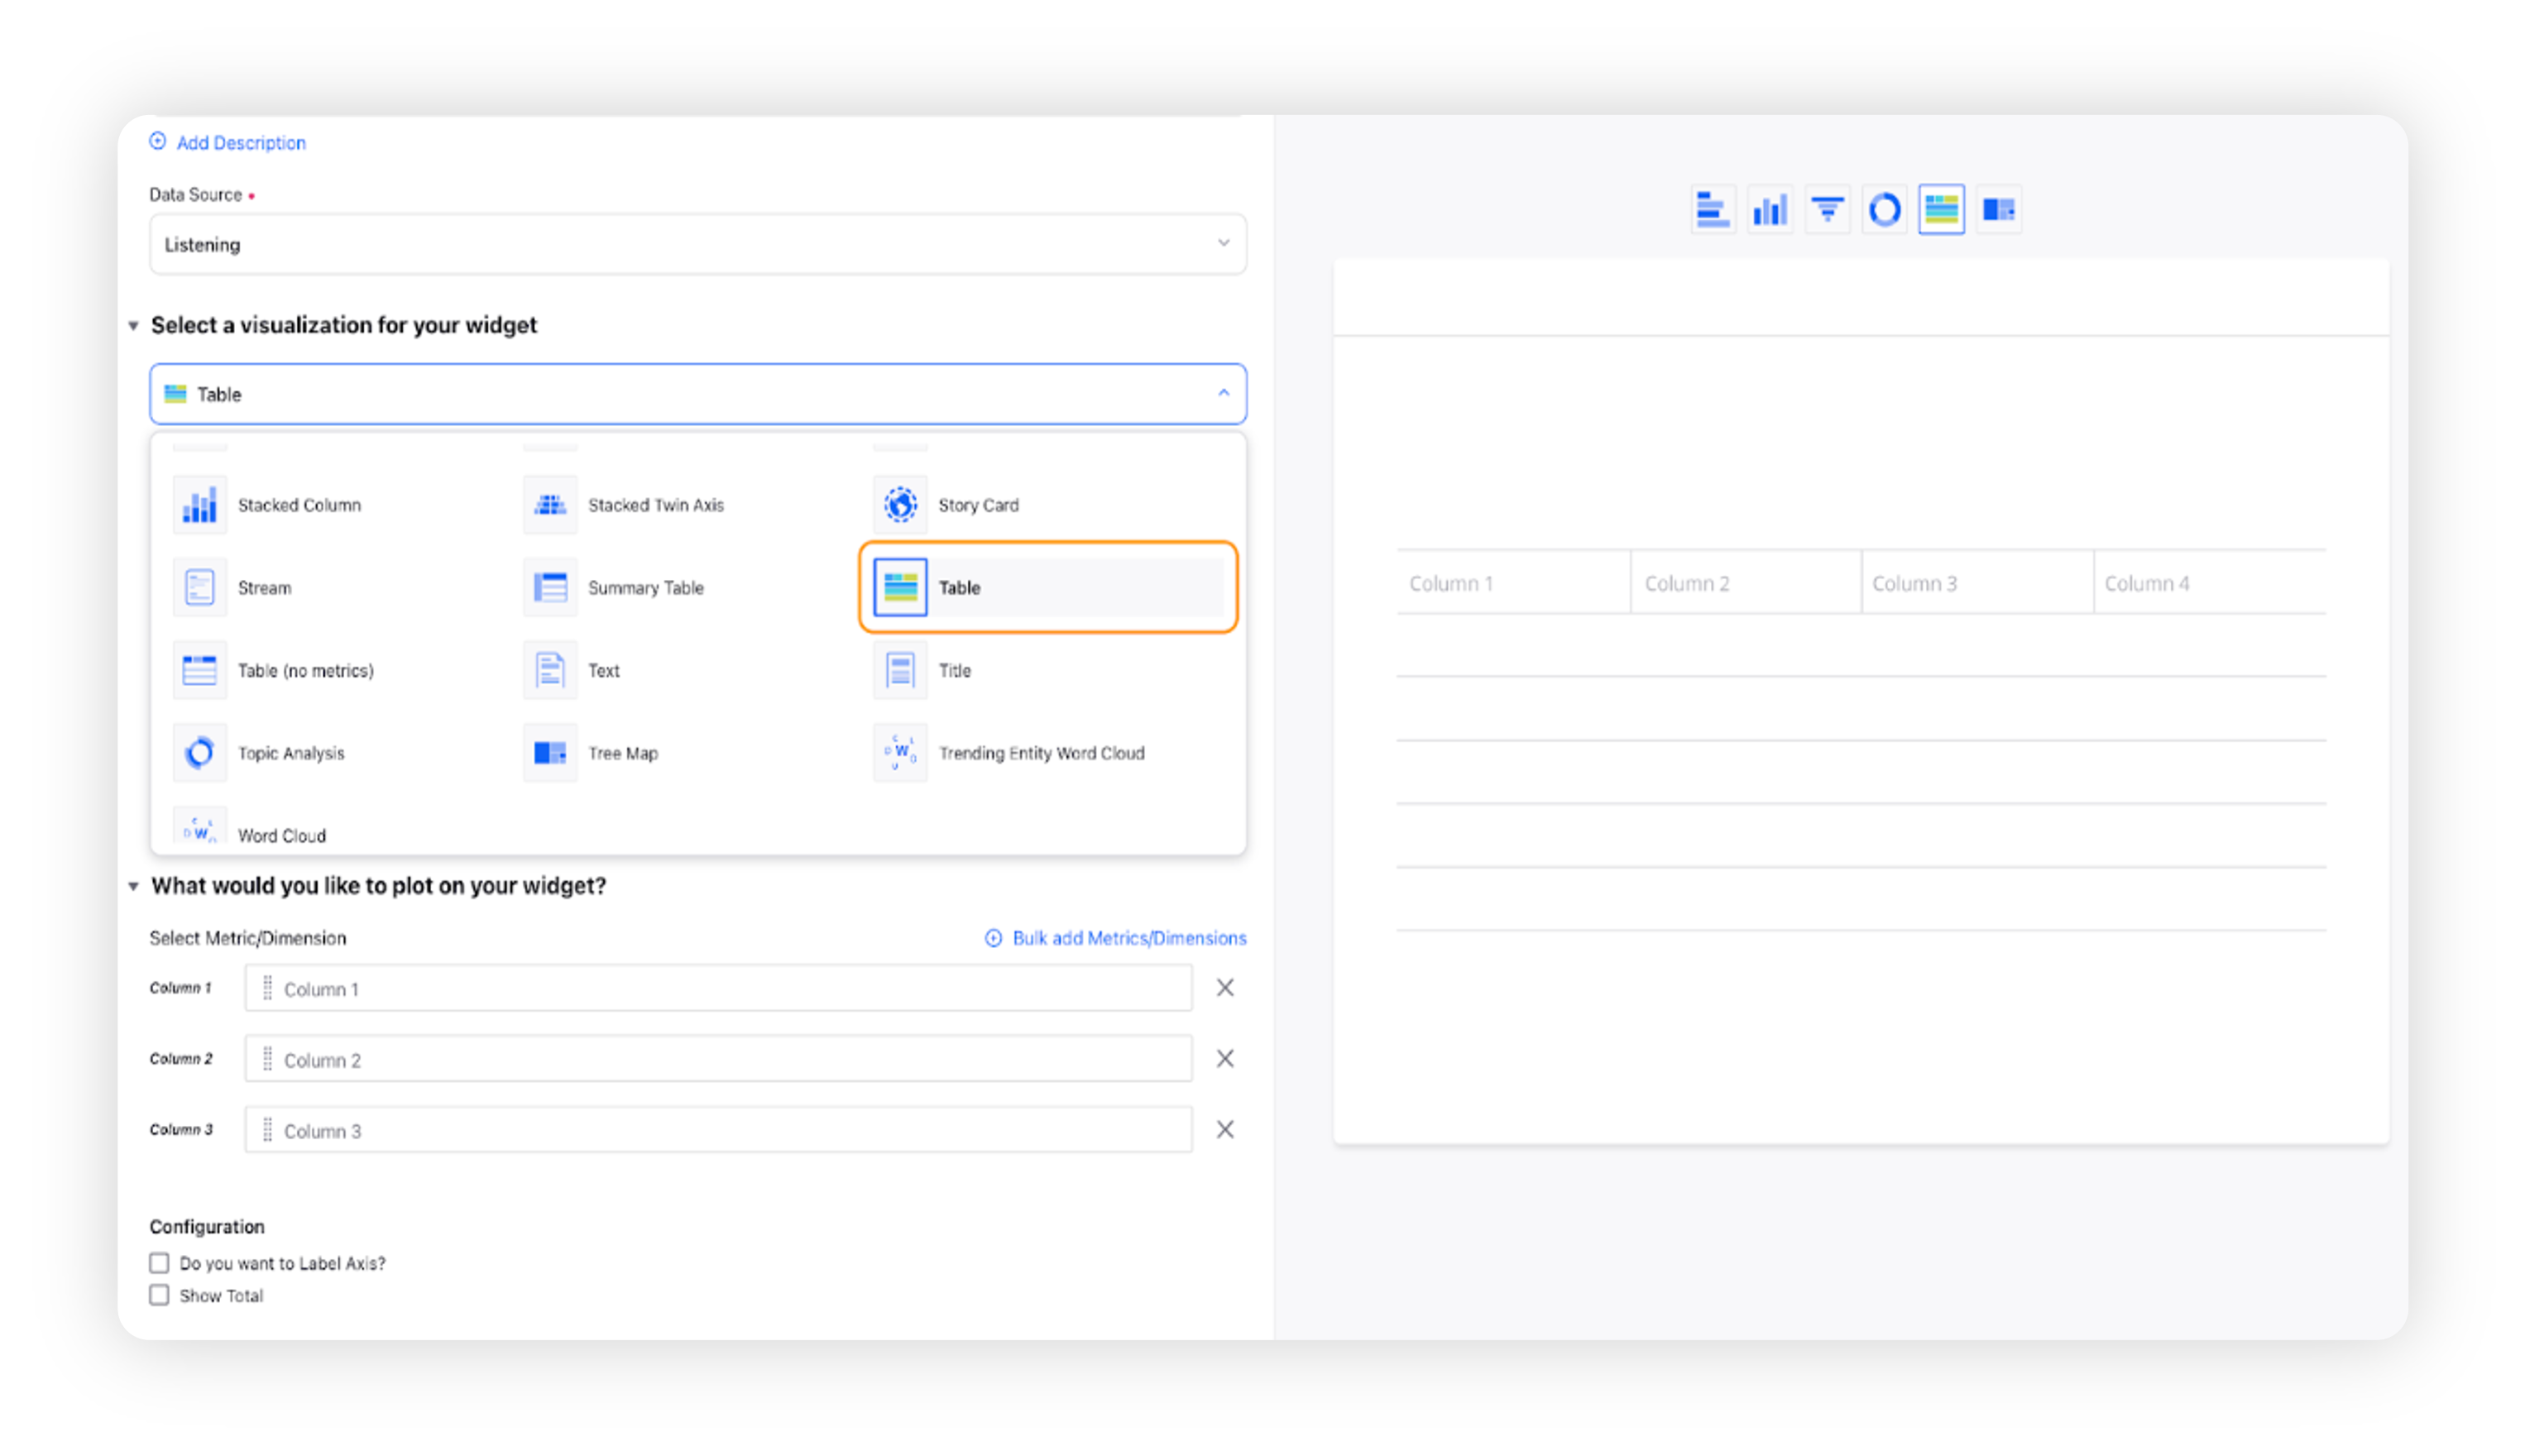
On the widget builder, enter the widget's name, and select Listening as Data Source.
Select Table as a visualization type for your Listening widget.

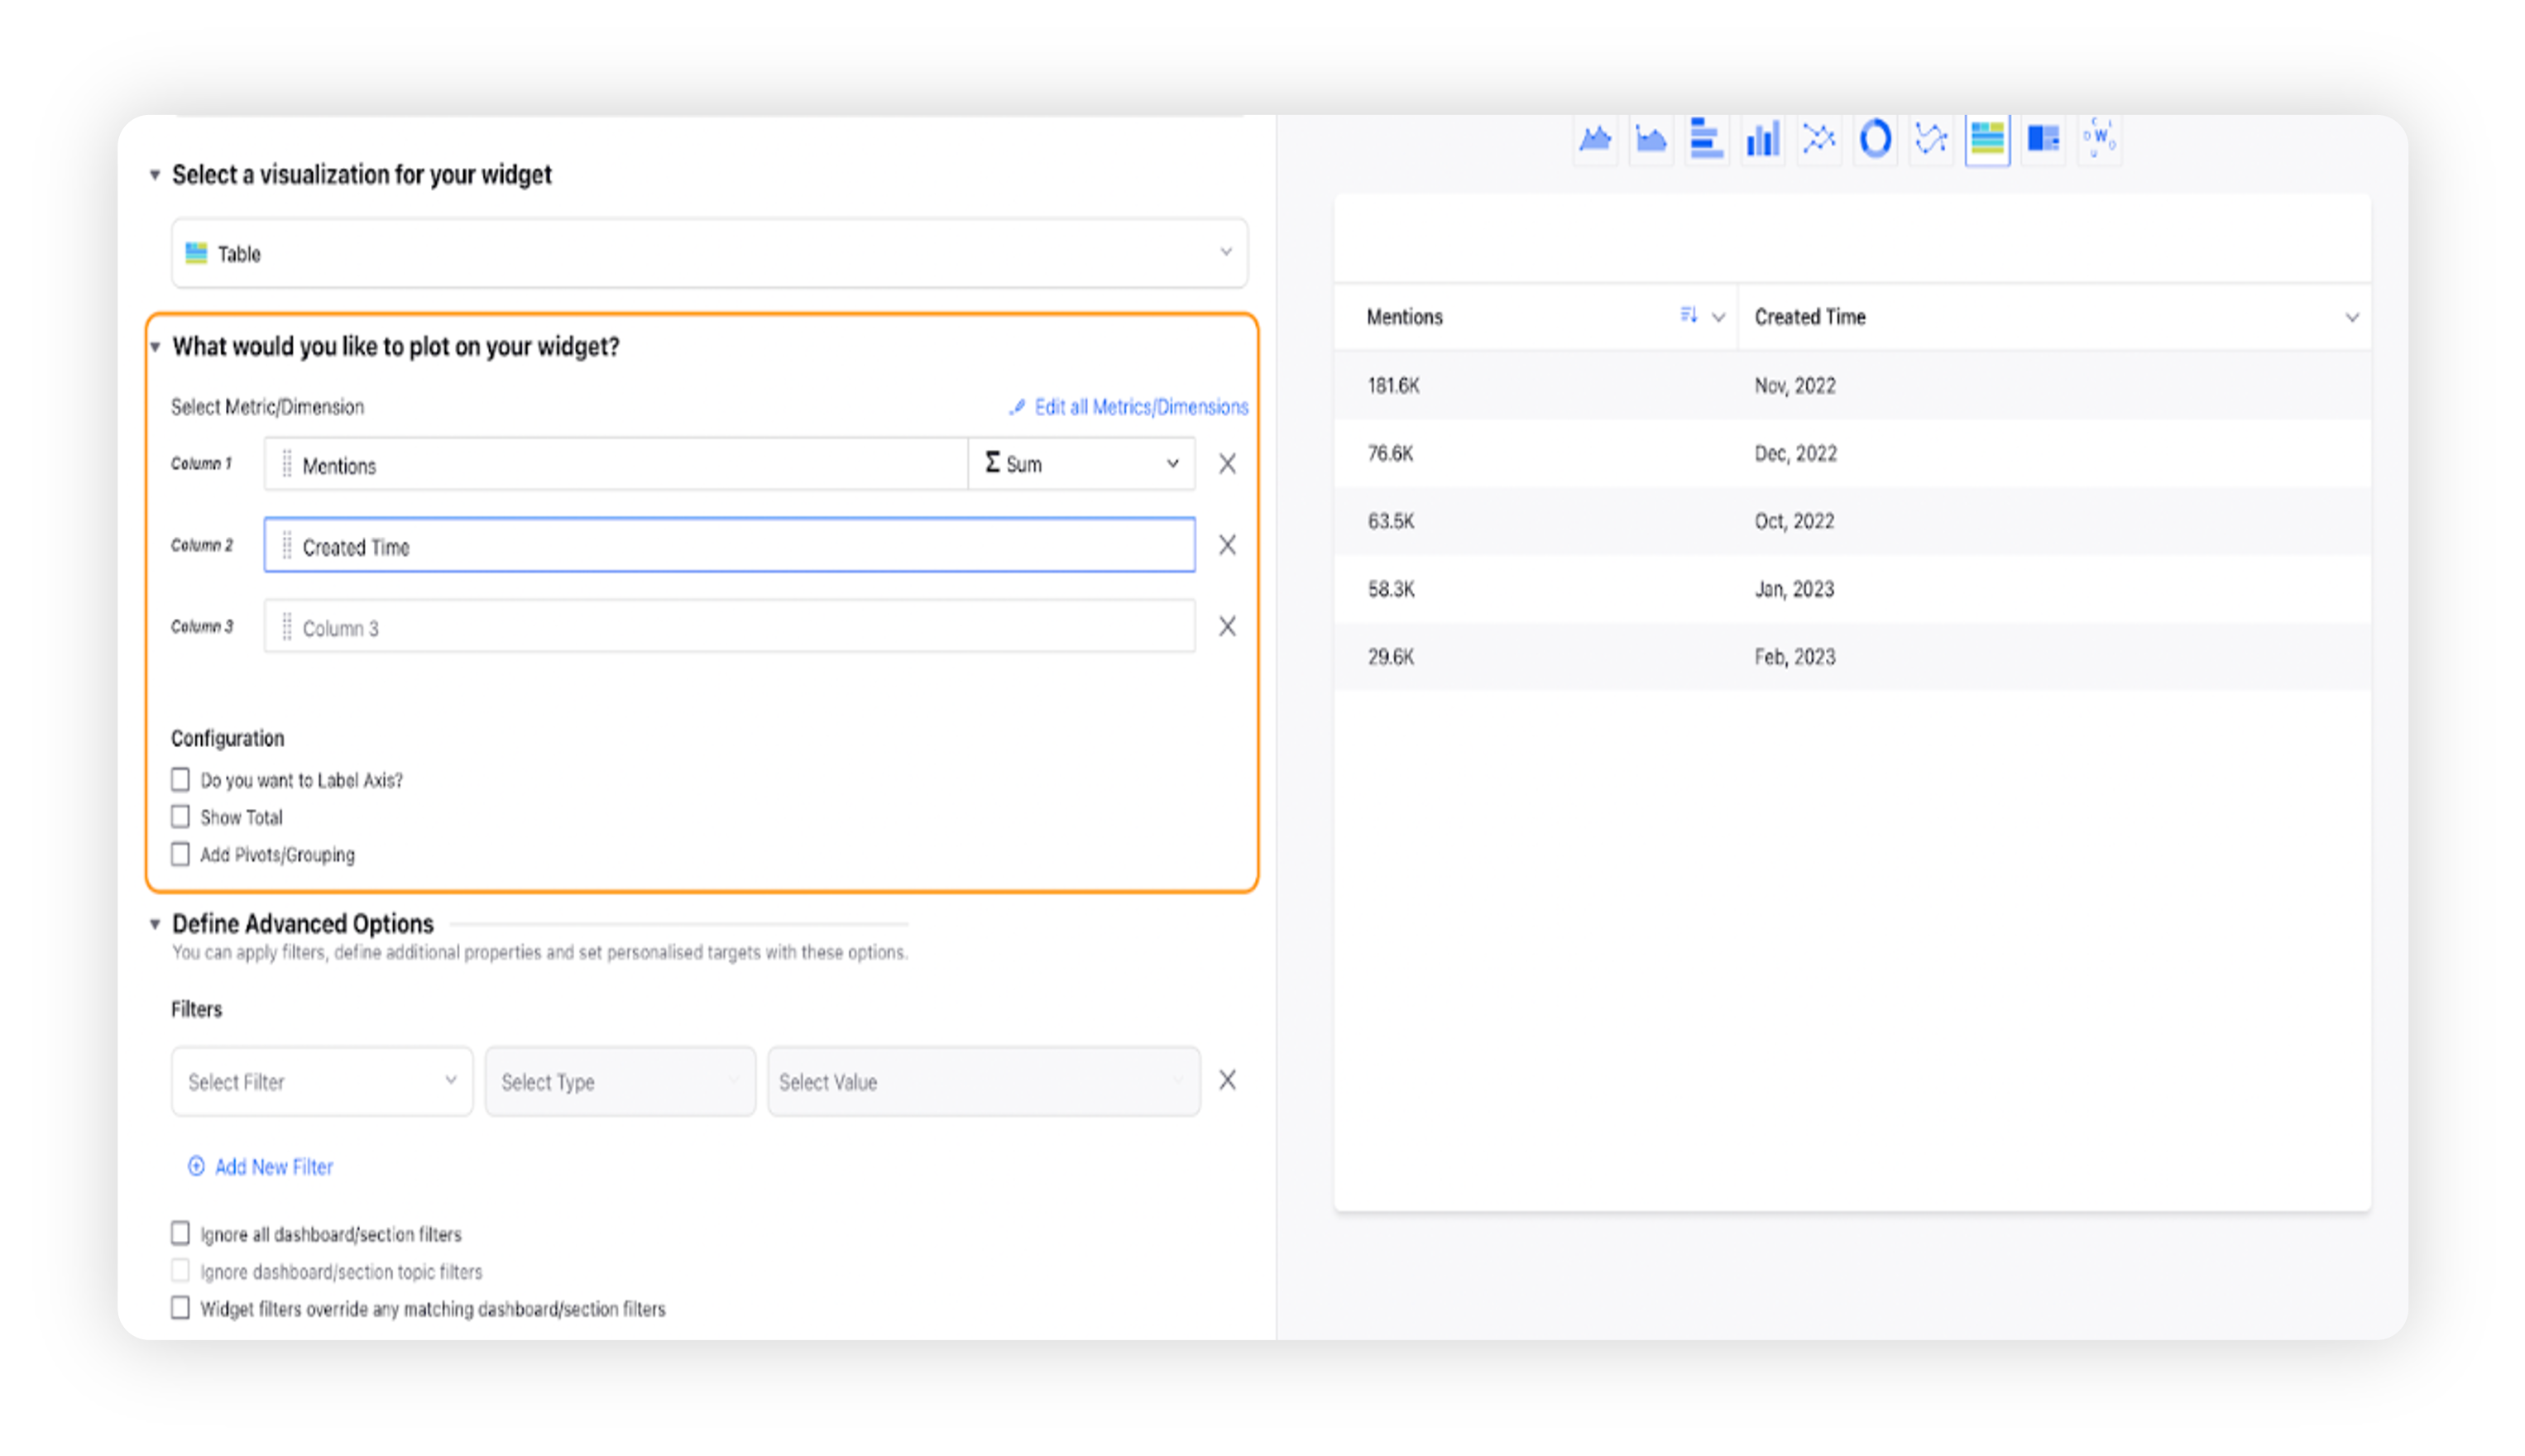
Under the “What would you like to plot on your widget?” section, you can plot your desired dimensions and metrics e.g., Created Time and Mentions. You’ll need to add at least one metric and one dimension to show the data on preview and add the widget to the dashboard.

Select the configuration options as desired. For more information, refer to the ‘Configuration options’ section below.
Under the "Defined Advanced Options" section, you can apply filters, define additional properties and set personalized targets with these options.
Under the “Define Sorting” section, you can choose which metric to sort the table by, and whether to have it sorted in the Ascending or Descending order. This can also be done by using the column headers after the widget is added to the dashboard.

Click Add to Dashboard on the bottom right corner to create your new widget.
Configuration options
The configuration options available for the Table widget will work as follows –
Configuration Option
Action
Do you want to Label Axis?
If you want to add names for your Axis, you can select this configuration option, and then you can enter the desired names as labels.
Show Total
Selecting this option will show the sum total of the metric for each column.
Sorting and Conditional Formatting in Table Widget
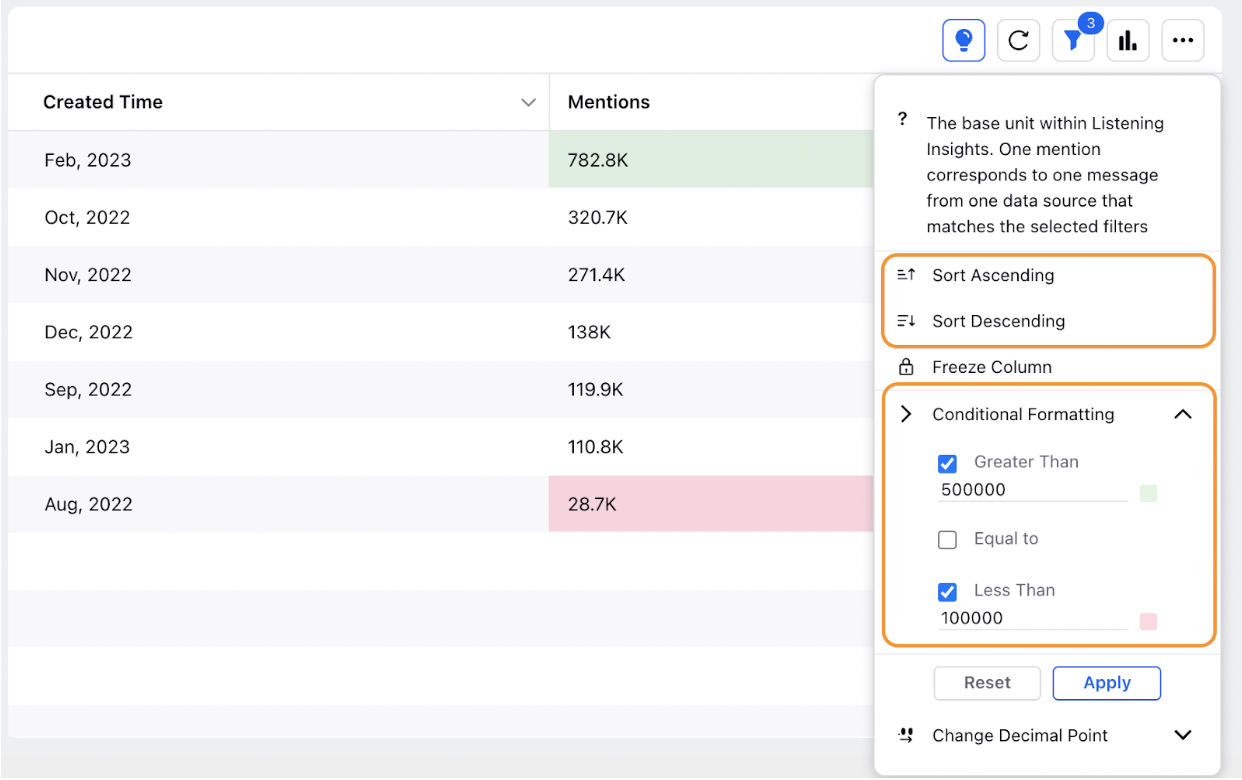
The table can be Sorted (Ascending or Descending order) using the menu on the column headers as shown below.

The “Conditional Formatting” option allows you to apply formatting to the cells of a column based on specific conditions or criteria.