How to Configure an Insight Group?
Updated
Access to insights can be tailored for different teams, regions, departments, and so on. based on their designated groups, ensuring relevant information is easily available to the right individuals.
Creating an insight group empowers users to organize and analyze data based on specific criteria, allowing for a more focused and personalized approach to extracting valuable insights.
Permissions
As a prerequisite to create an Insight Group, you must have the following permission that is available in Global Roles and Workspace Roles under Conversational Analytics.
Permission | Description |
View | Allows you to view the Insight Group Configuration page. |
Create | Allows you to create the groups on Insight Group Configuration page. |
To Create an Insight Group
Click on the New Tab icon. Under Sprinklr Service open the Conversational Analytics persona.
The Home screen of conversational analytics is displayed.

Click on the Settings icon at the bottom left corner of the screen.
The Governance screen is displayed.

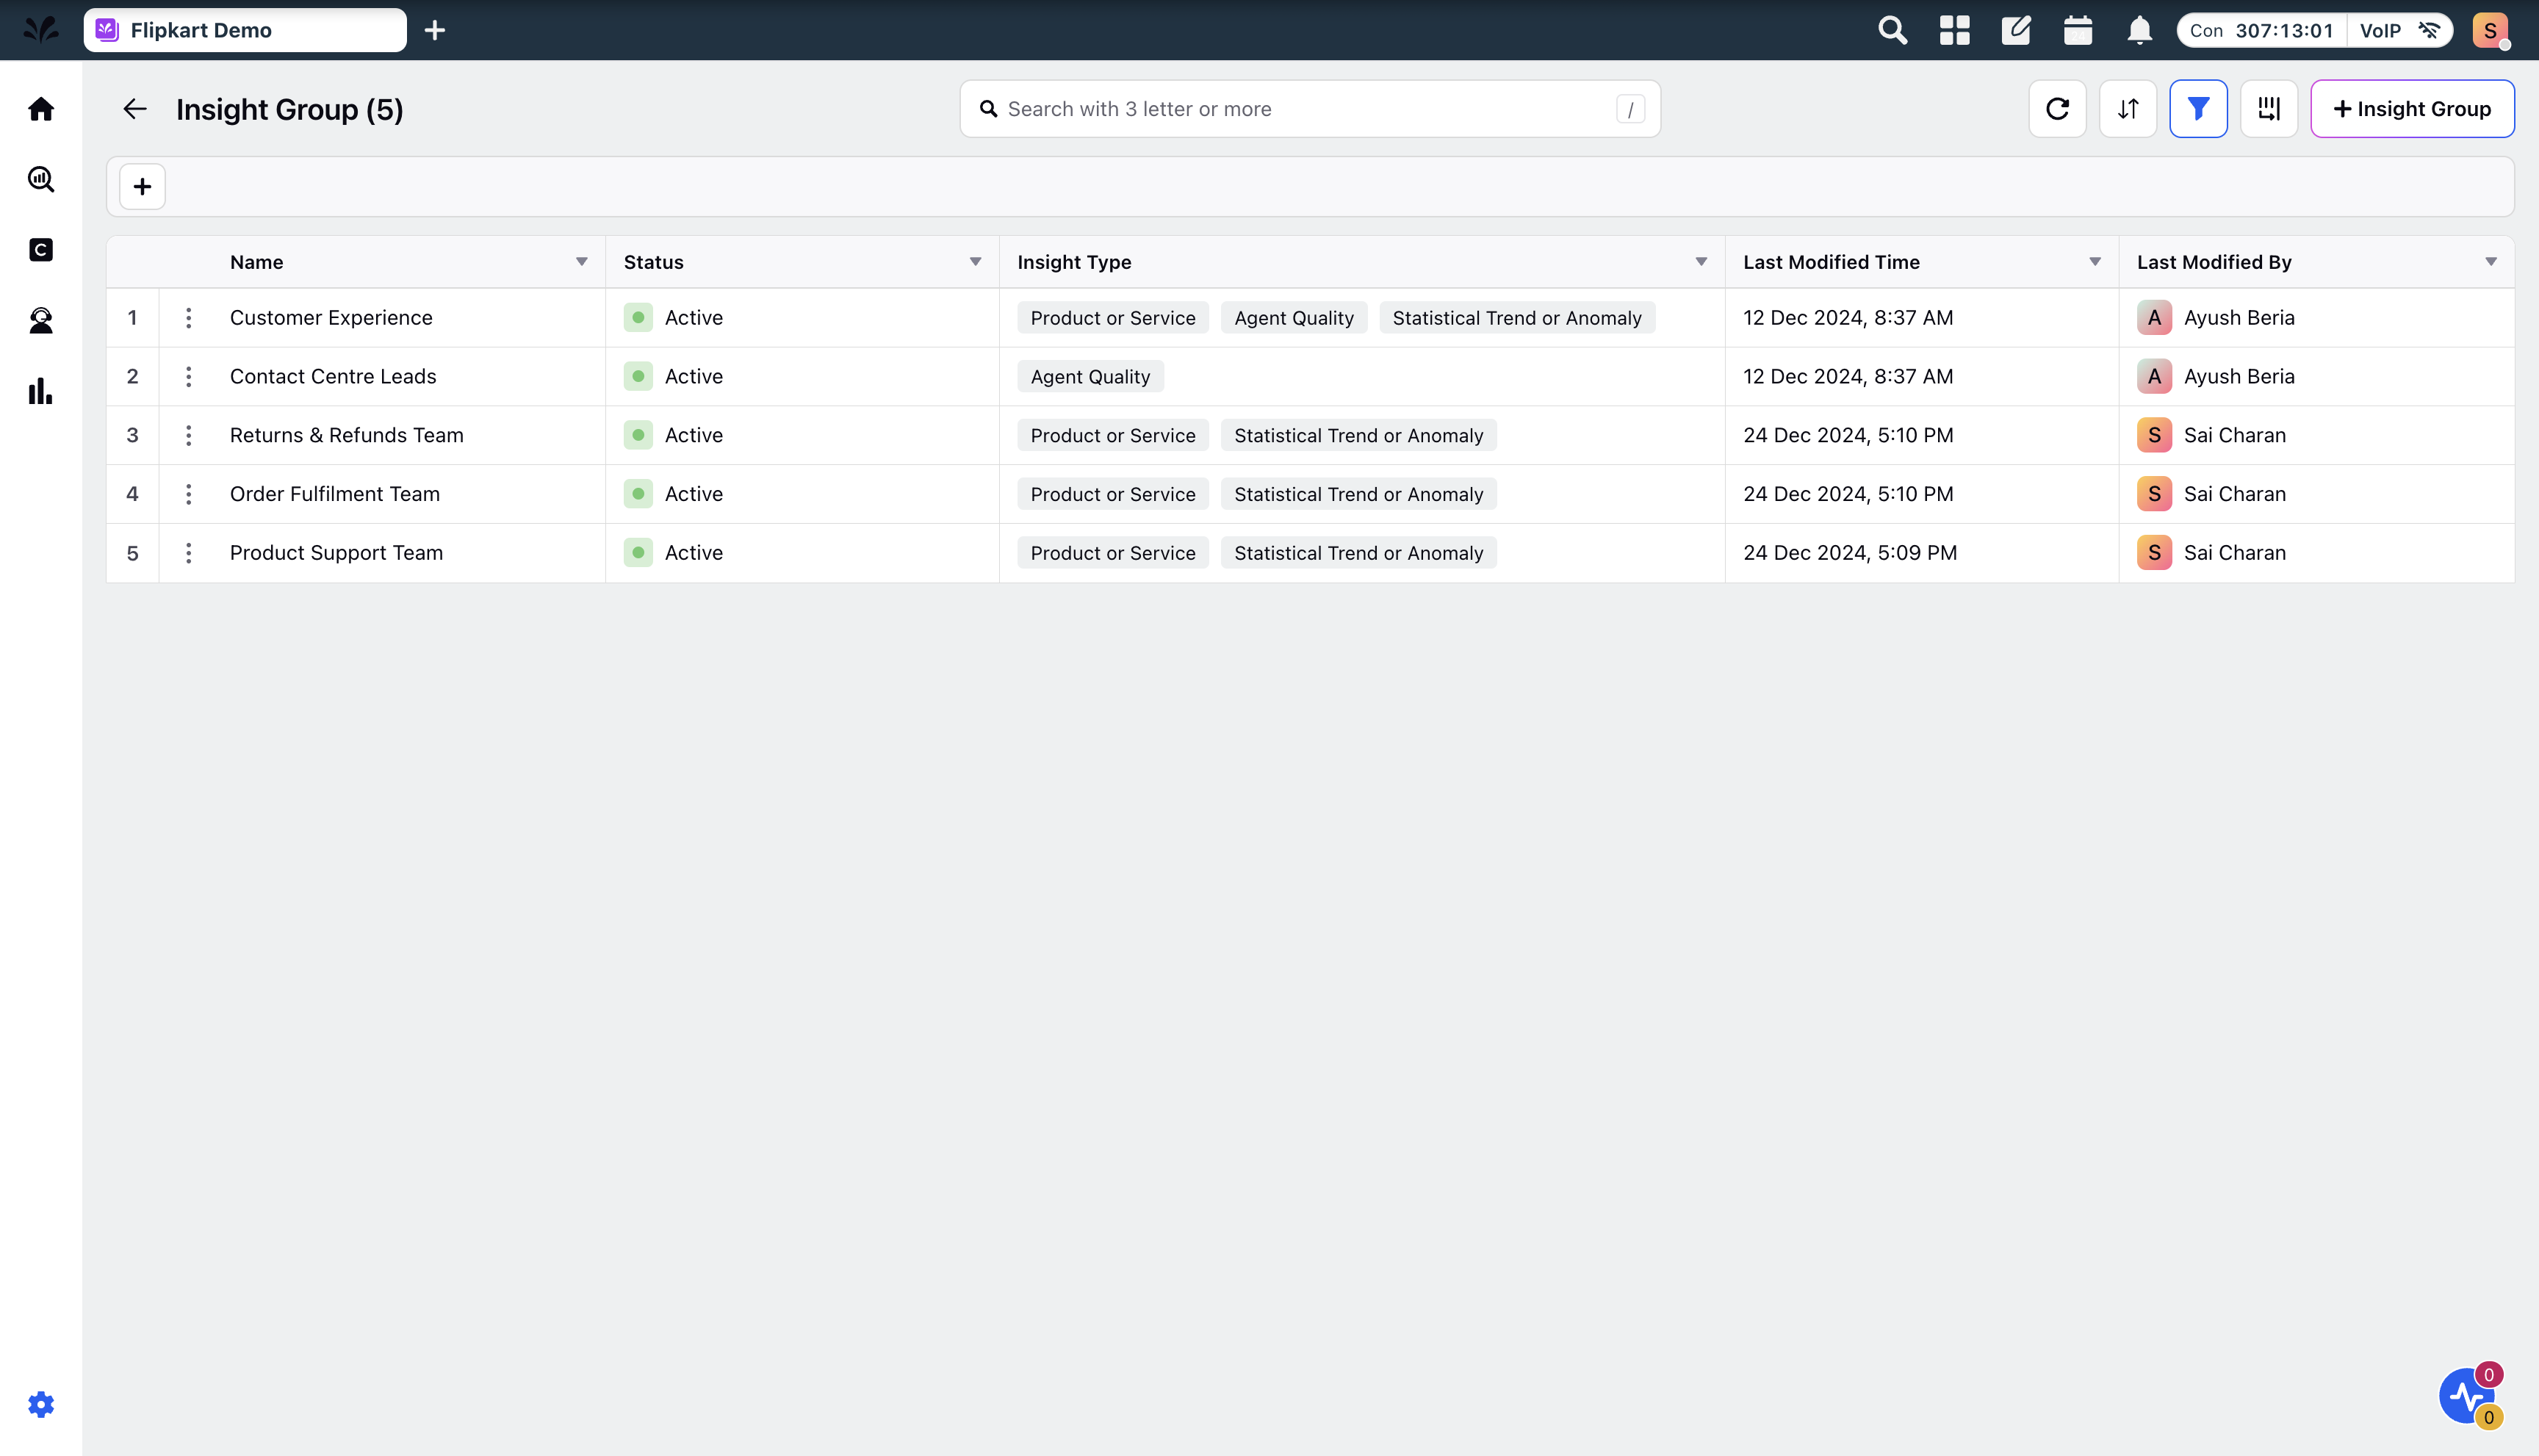
Click on Insight Groups to access the Insight Groups screen.
On the Insight Groups screen, click + Insight Group in the top right corner.

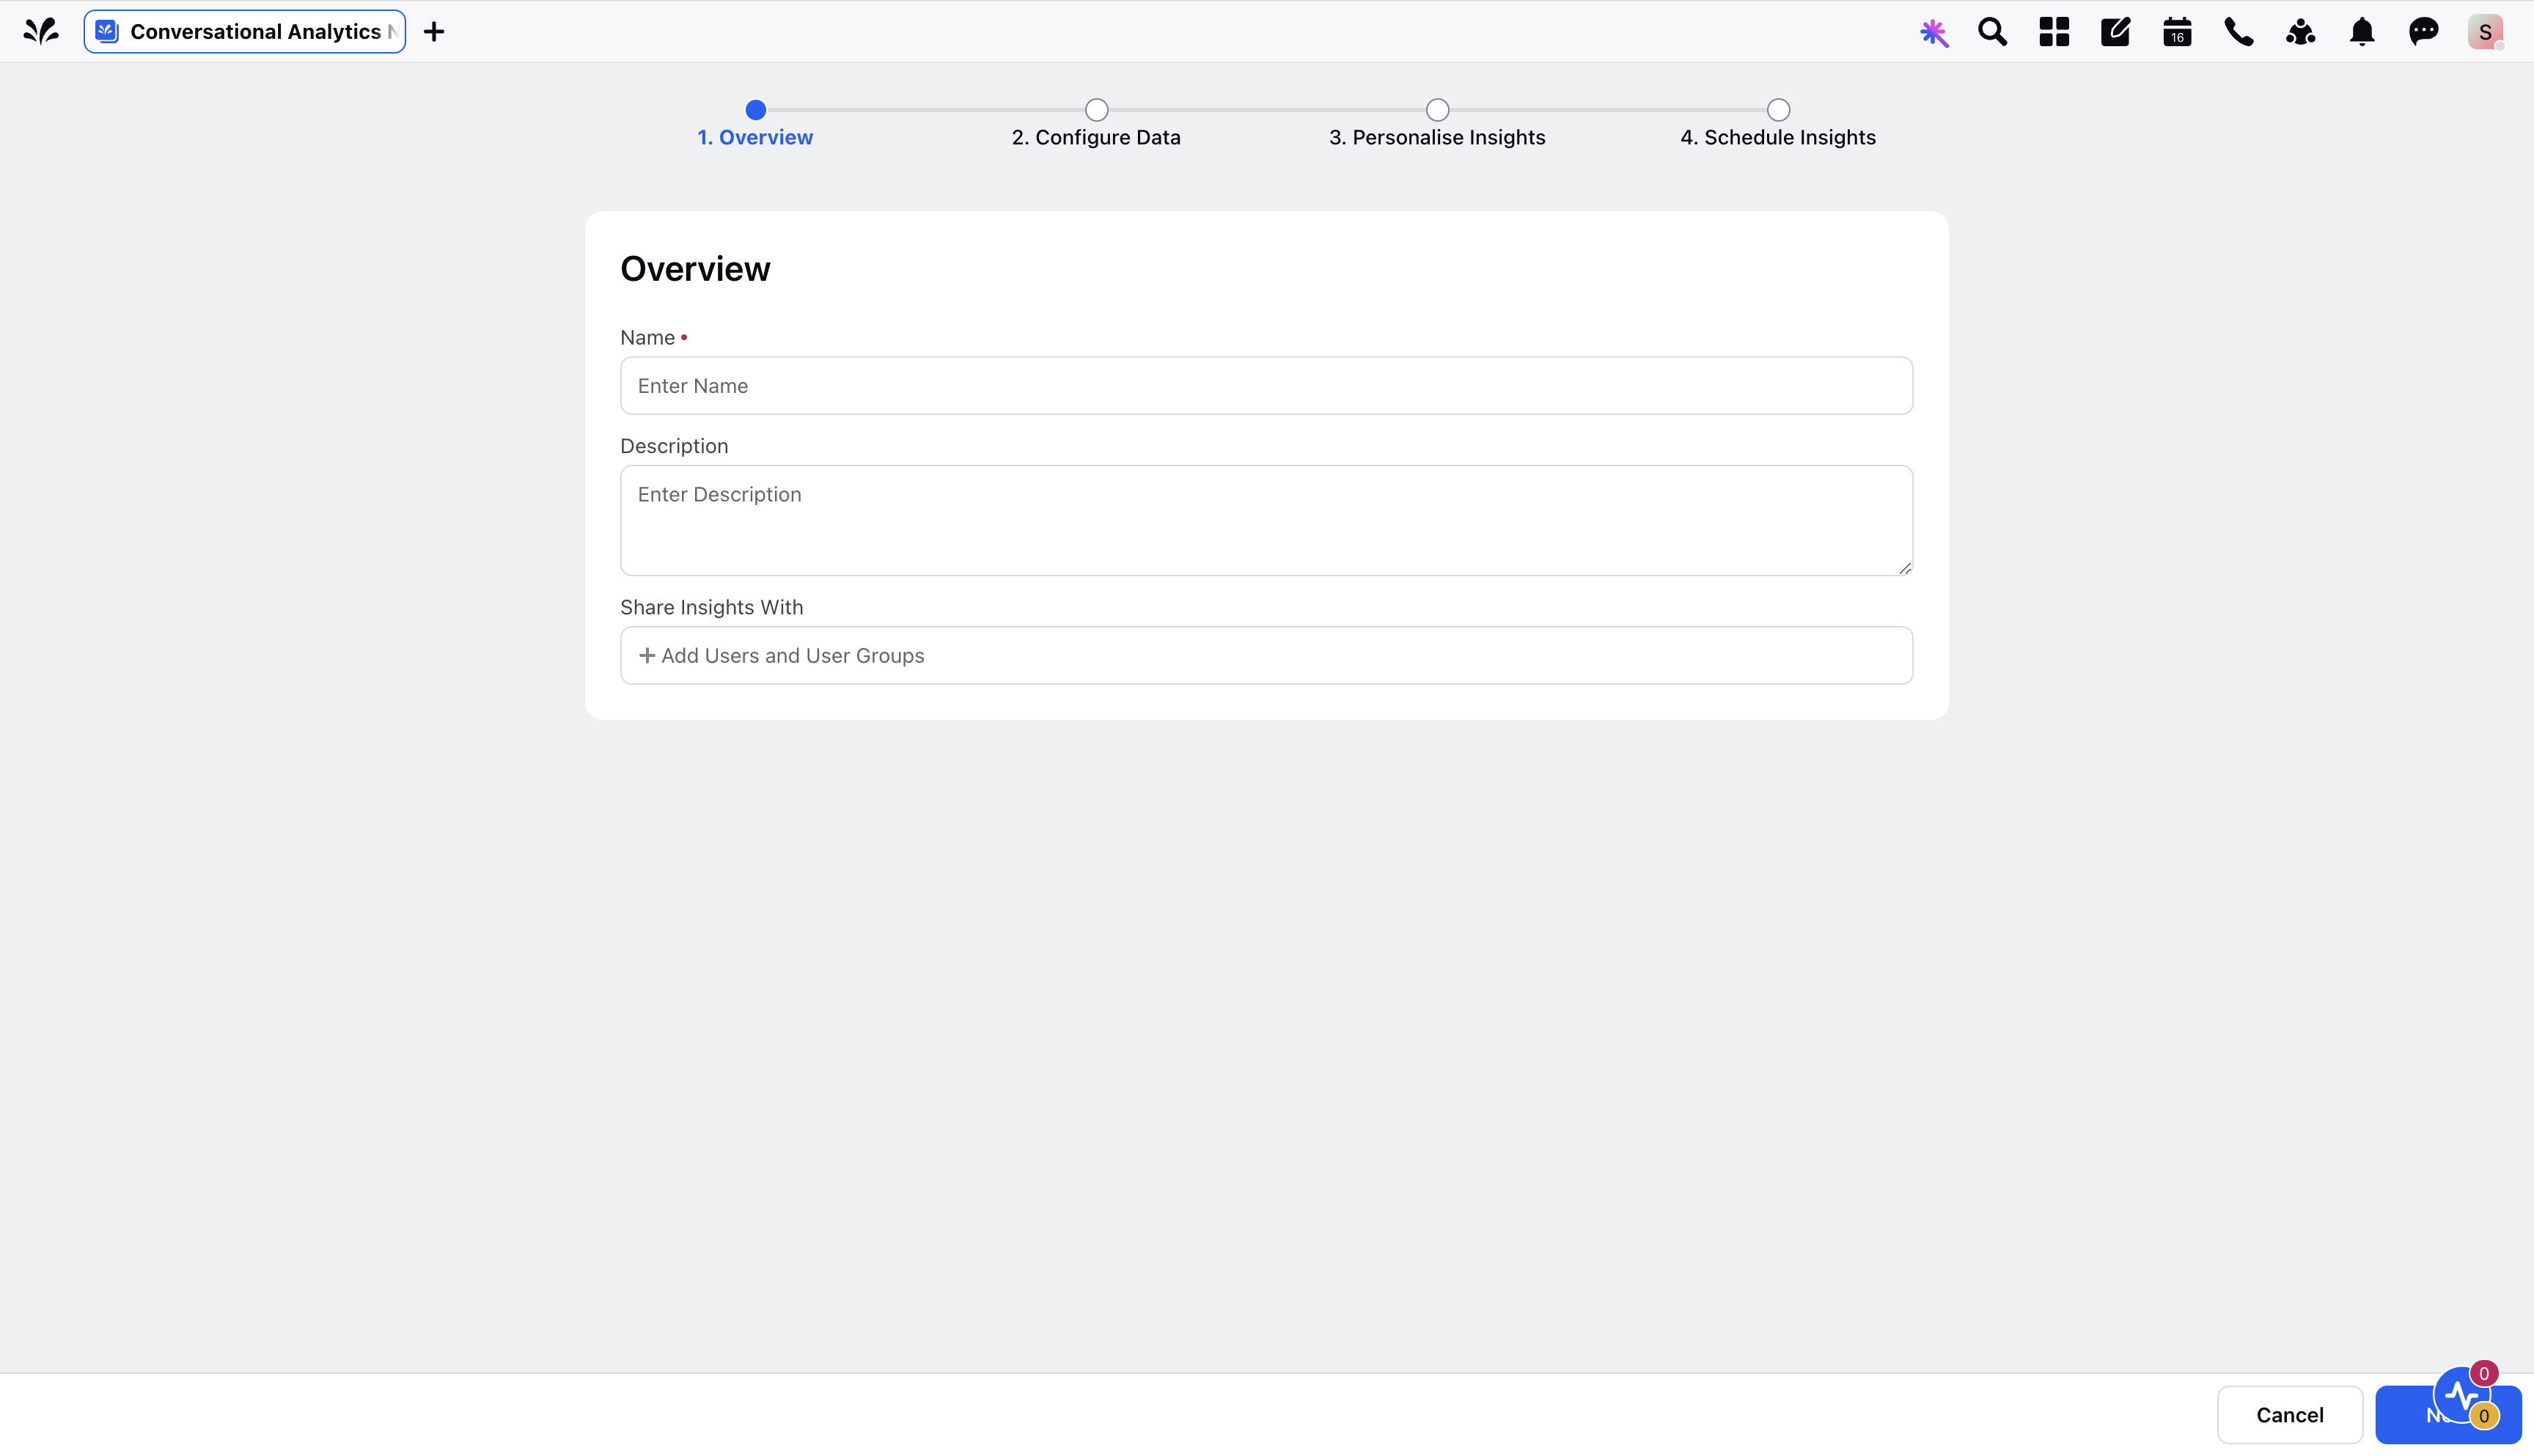
Provide a meaningful name and description in the Overview section.

Share insights with designated users who have access to the generated insights.
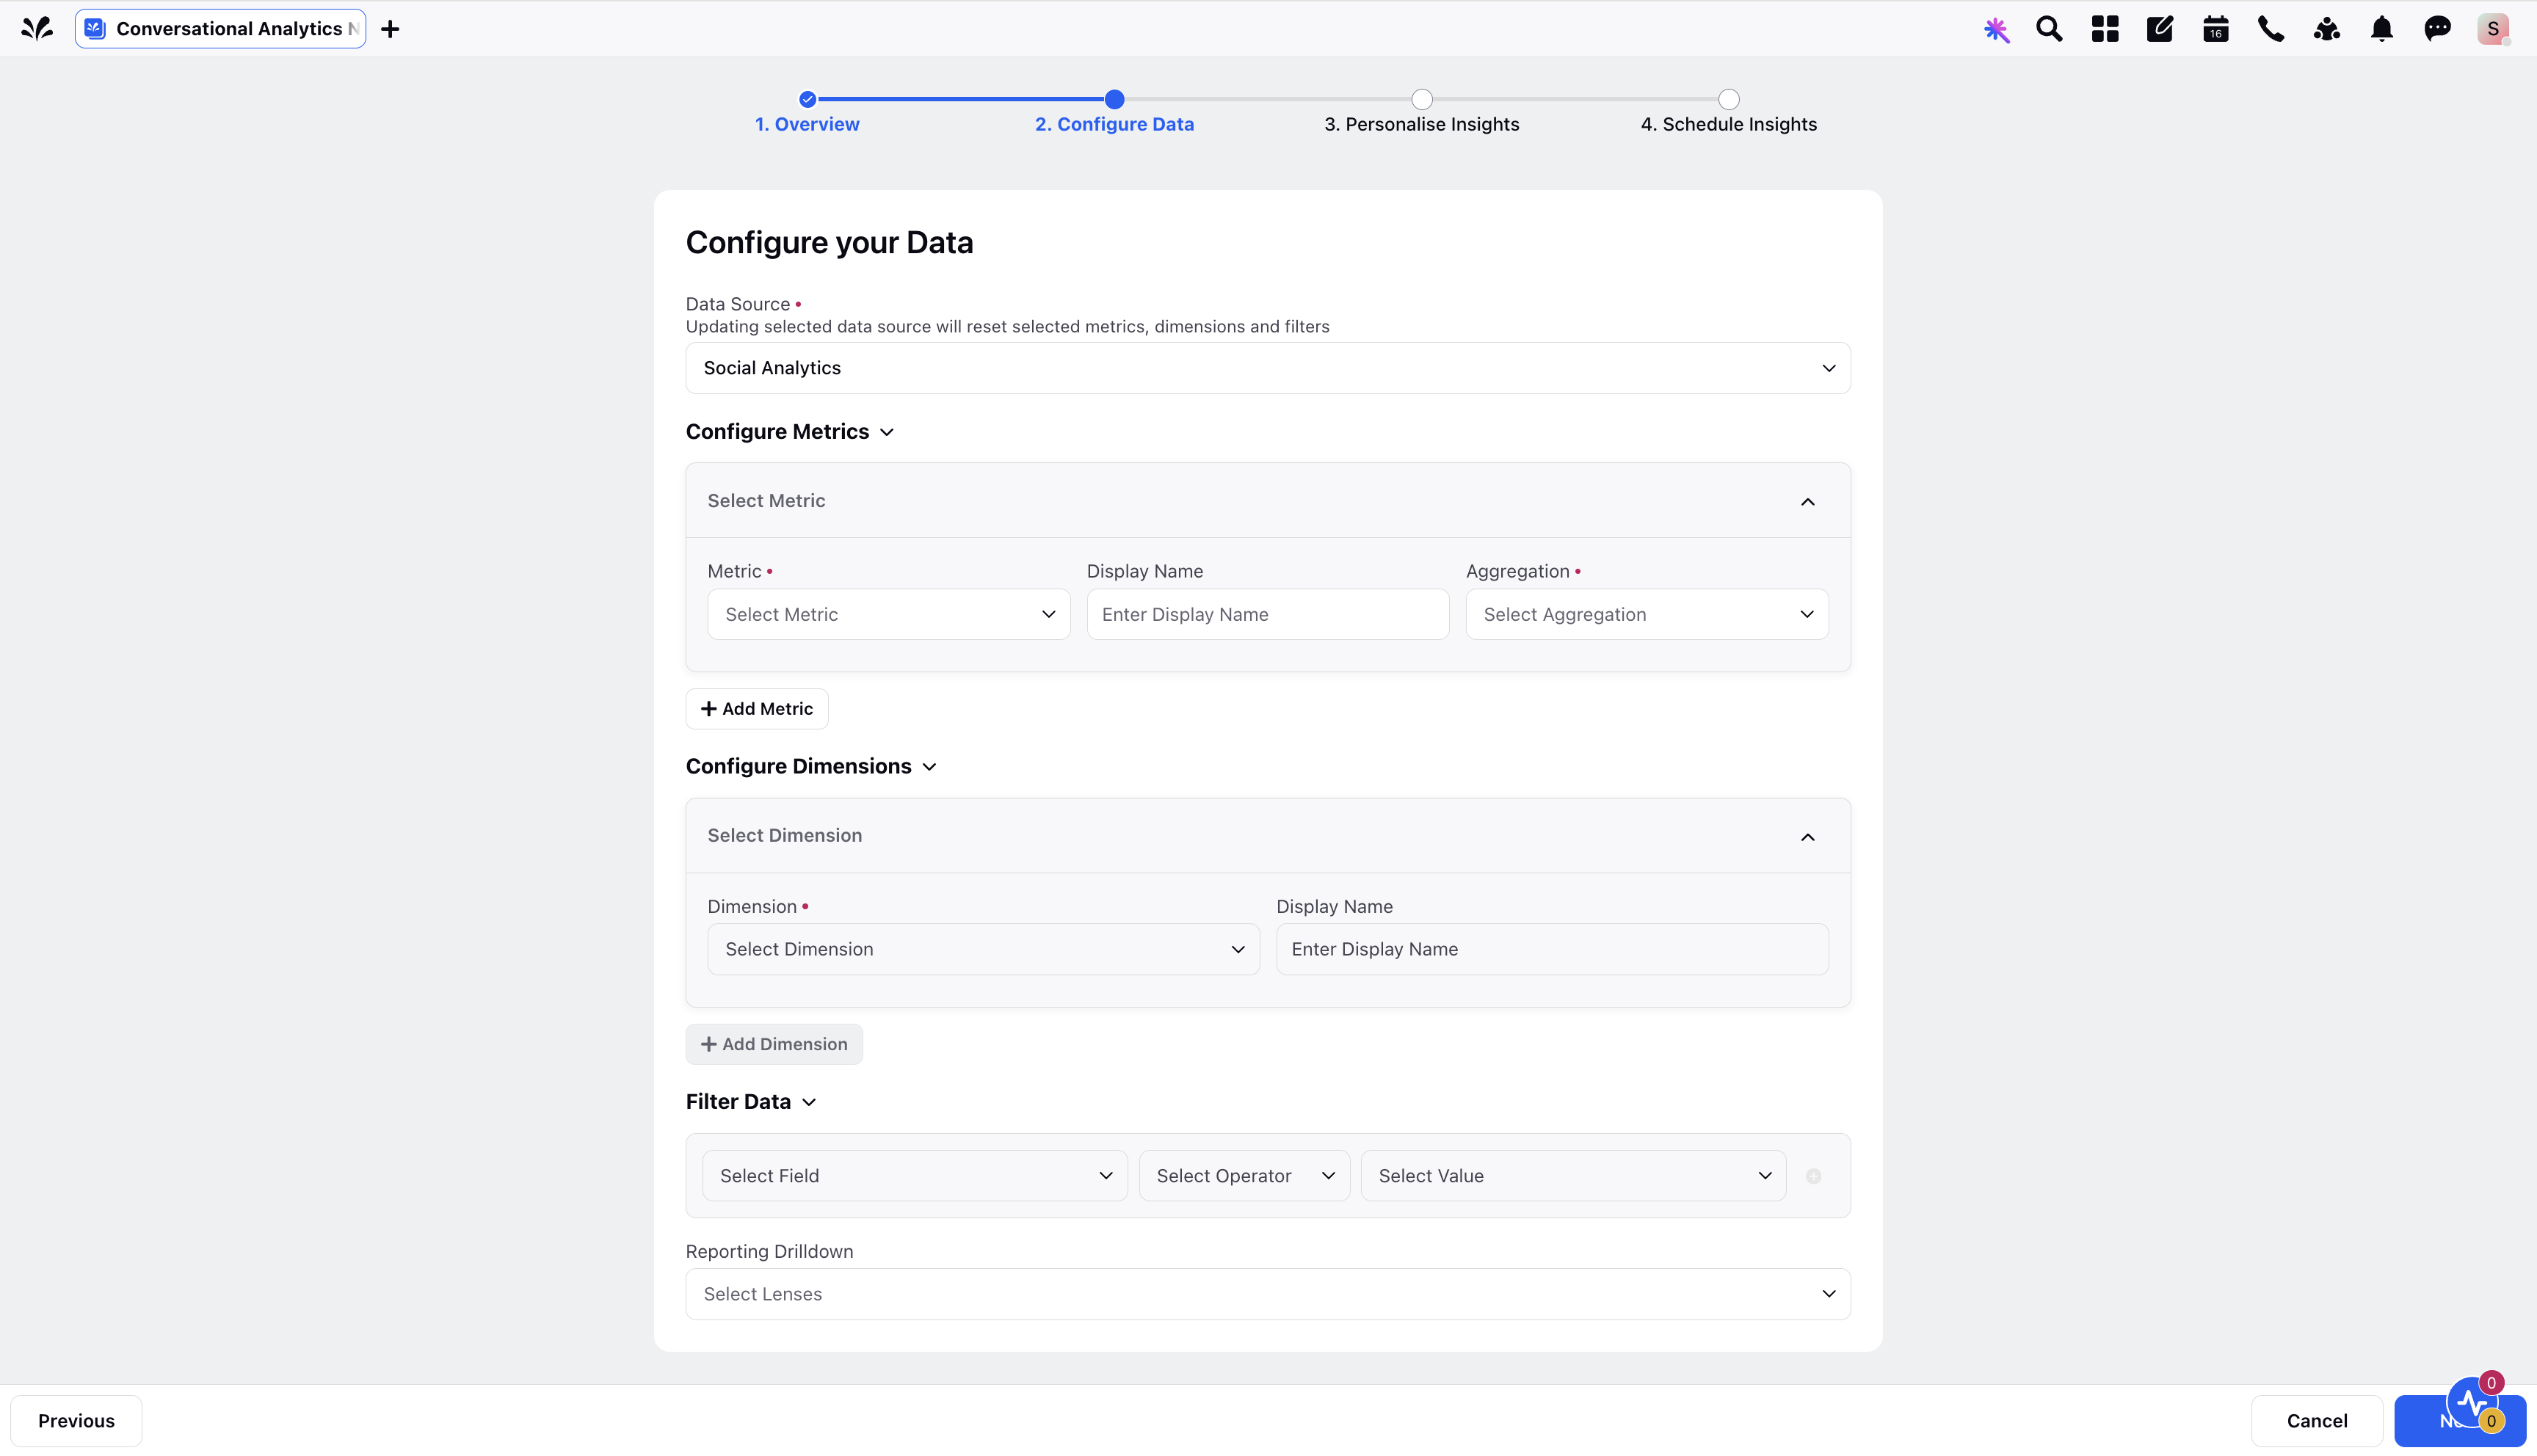
Under the Configure Data section, choose Social Analytics as the Data Source.

Within Configure Metrics, set up the metrics of interest. For instance, if you want to track CSAT and case count, you can configure these metrics here. Custom metrics can also be selected.
Once metrics are chosen, customize their Display Names for clarity. Next, select the desired Aggregation method. For example, you can aggregate case count by sum, percentage, or average. If multiple aggregations are needed, add them separately with distinct display names to differentiate between them. This allows for a flexible and nuanced approach to data aggregation based on specific user preferences and analytical requirements.
Proceed to select dimensions under Configure Dimensions. Choose the fields that are relevant for gaining insights into your data, such as product, region, intent, or channel. These dimensions provide a contextual understanding of the metrics you are analyzing. Additionally, you have the option to rename these dimensions as needed, ensuring that they make the insights more intuitive for users.
Moving on to Filter Data, you have the option to refine your analysis by applying filters on dimensions. For example, you can specify filters like region as "USA" and channel as "email," tailoring your insights to specific criteria.
In the Reporting Drilldown section, you can select previously created Lenses. These lenses allow you to drill down into widget data in the Insight third pane for a more in-depth analysis.
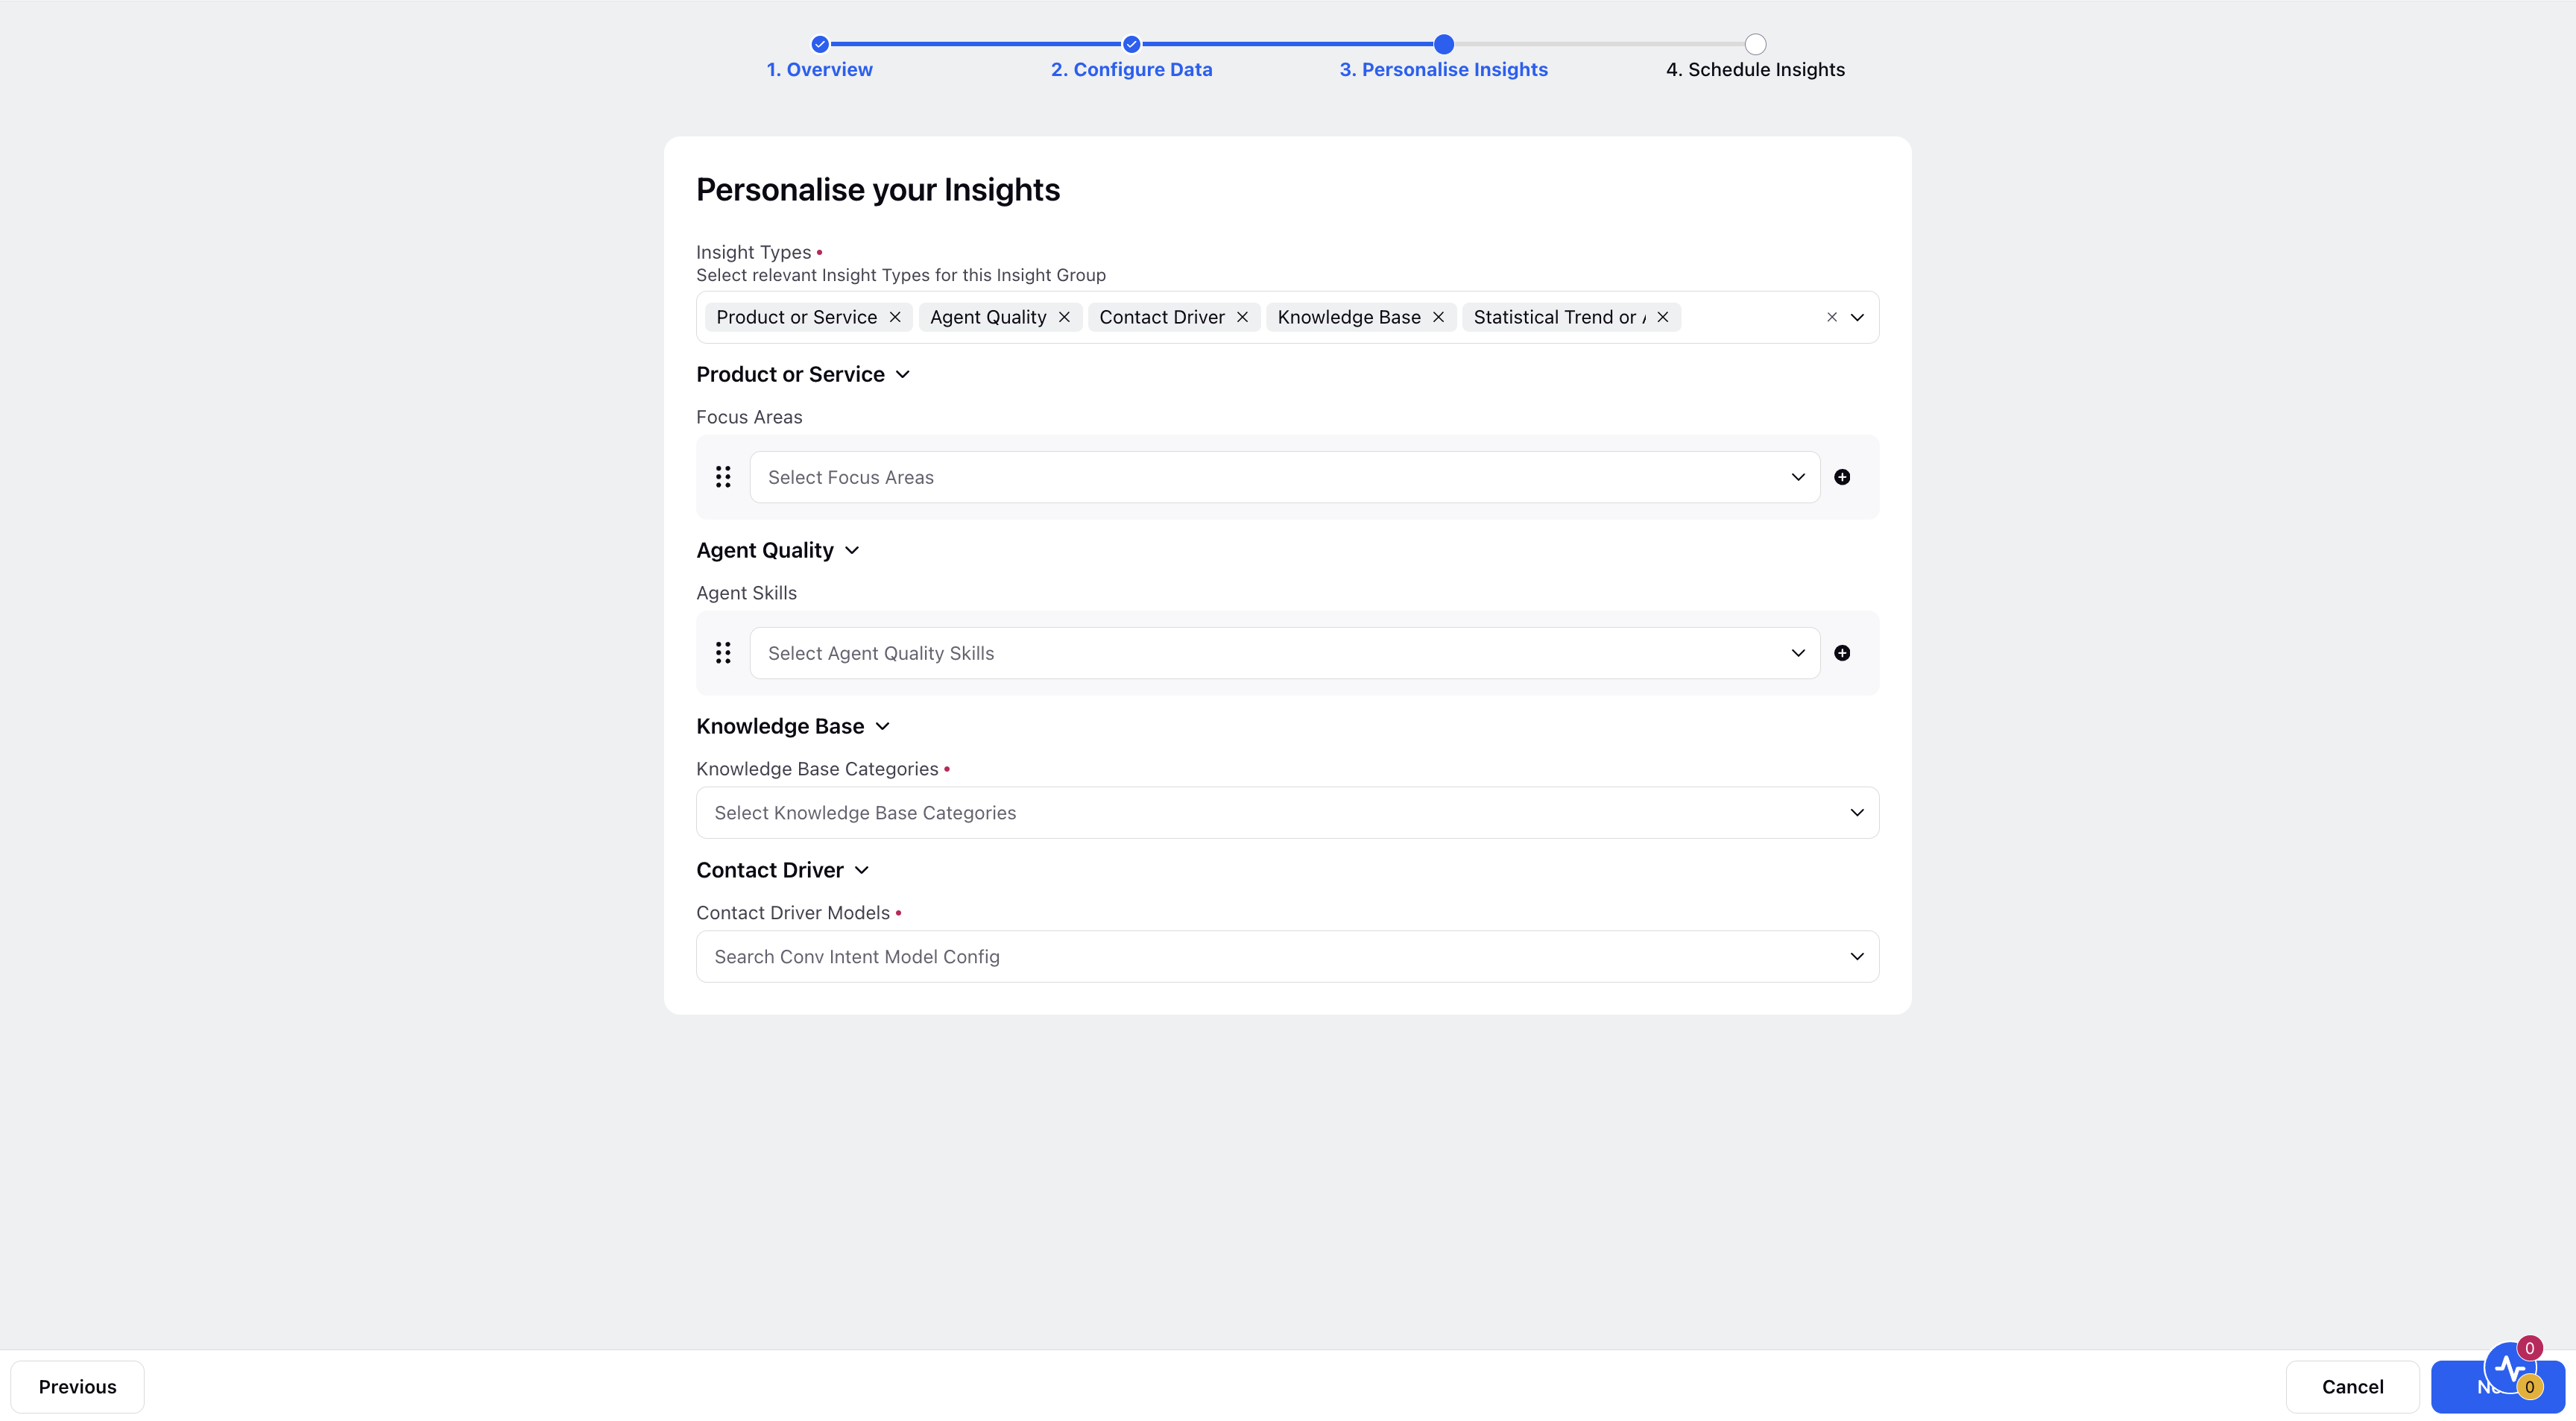
On Personalise Insights screen, under Insight Types choose between Product or Service, Agent Quality, Contact Driver, Knowledge Base and Statistical Trend or Anomaly.

Product or Service
Insights about product or service offered by the brand and steps to improve them.
Choose from the predefined Focus Areas created in the Governance section that are relevant to this insight group. Focus Areas play a crucial role in shaping the analysis, helping you pinpoint specific aspects within your data that align with these defined areas. This ensures a targeted and comprehensive approach to gaining insights in specific domains that are of importance to you. For instance, imagine creating an insight group for a warranty team. In this setup, identified focus areas could involve studying patterns in warranty claims, gauging the demand for various warranty coverage options, and addressing concerns related to warranty fraud.
Agent Quality
Insights about agent quality and steps to address the same.
Select the desired Agent Quality Skills. Specifying skills is instrumental in delving into the nuances of agent-customer interactions.
Skills-based analytics provide a standardized benchmark for evaluating agent performance, aiding in the identification of both strengths and areas for improvement.
Insights about gaps in contact driver intents and steps to address them.
Select the desired Contact Driver Models.
Insights about gaps in knowledge base articles of the brand and steps to address them.
Select the desired Knowledge Base Categories.
Statistical Trend or Anomaly
Insights about statistical trends or anomalies observed in configured metrics and dimensions and steps to address them.
On Schedule Insights screen, Under Daily Schedule section, Select the Schedule Type from the drop down list. Also select the Hour and AM/PM values from the drop down list.

Under the Weekly Schedule section, select the Day, Hour and AM/PM values from the respective drop down list.
Under the Monthly Schedule section, select the Date, Hour and AM/PM values from the respective drop down list.
Select the Time Gap from the drop down list.
Enter value in the Expected Insight Resolution Time field.
Click Save at the bottom to finalize the configuration.
After creating an insight group, you can manage it by hovering over the group card. Options include editing, pausing, making a copy, or deleting the group. Pausing an insight group halts the generation of insights for that group, and its status changes to Inactive, displayed at the top left of the group card.
Refer to the below table for the parameter description of the Schedule Insights screen.
Parameter | Description |
Daily Schedule | Scheduling Insights on a daily basis. Below are the values for Daily Schedule:
|
Weekly Schedule | Scheduling Insights on a weekly basis. Below are the values for Weekly Schedule:
|
Monthly Schedule | Scheduling Insights on a monthly basis. Below are the values for Monthly Schedule:
|
Time Gap | It is the time gap between the "Case Creation Time” and the “Schedule”. Available Options:
|
Timezone | Timezone of the users viewing this Insight Group. |
Expected Insight Resolution Time | Number of Days in which this group is considered as resolved. Any insight occurrence after this period is not considered as a recurring insight. Allows you to input a value within the Free-fill Numeric Input field.
|