Journey Logs
Updated
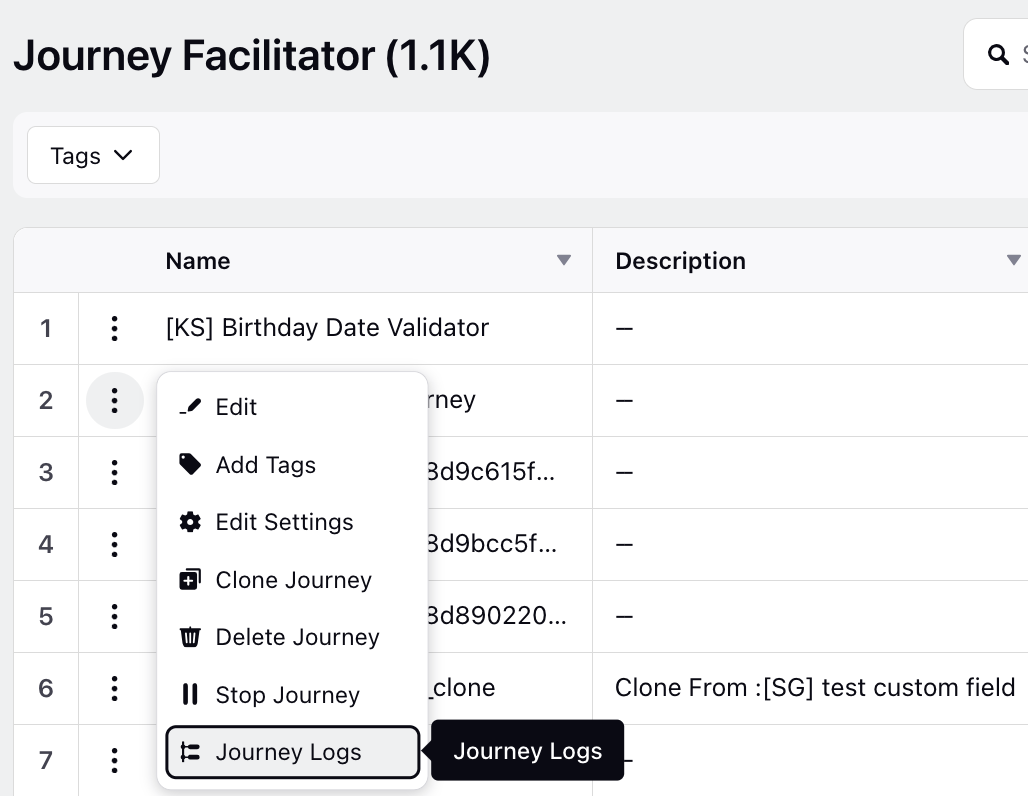
Accessing Journey Logs
You can access journey logs to help troubleshoot and identify what went wrong and at which point in the process. This feature is crucial for diagnosing issues and understanding the flow of your journey.
![]() Note: This feature is currently in its Beta version, so there may be some gaps and missing data.
Note: This feature is currently in its Beta version, so there may be some gaps and missing data.
Hover over the Options icon and select Journey Logs.
Viewing Journey Performance
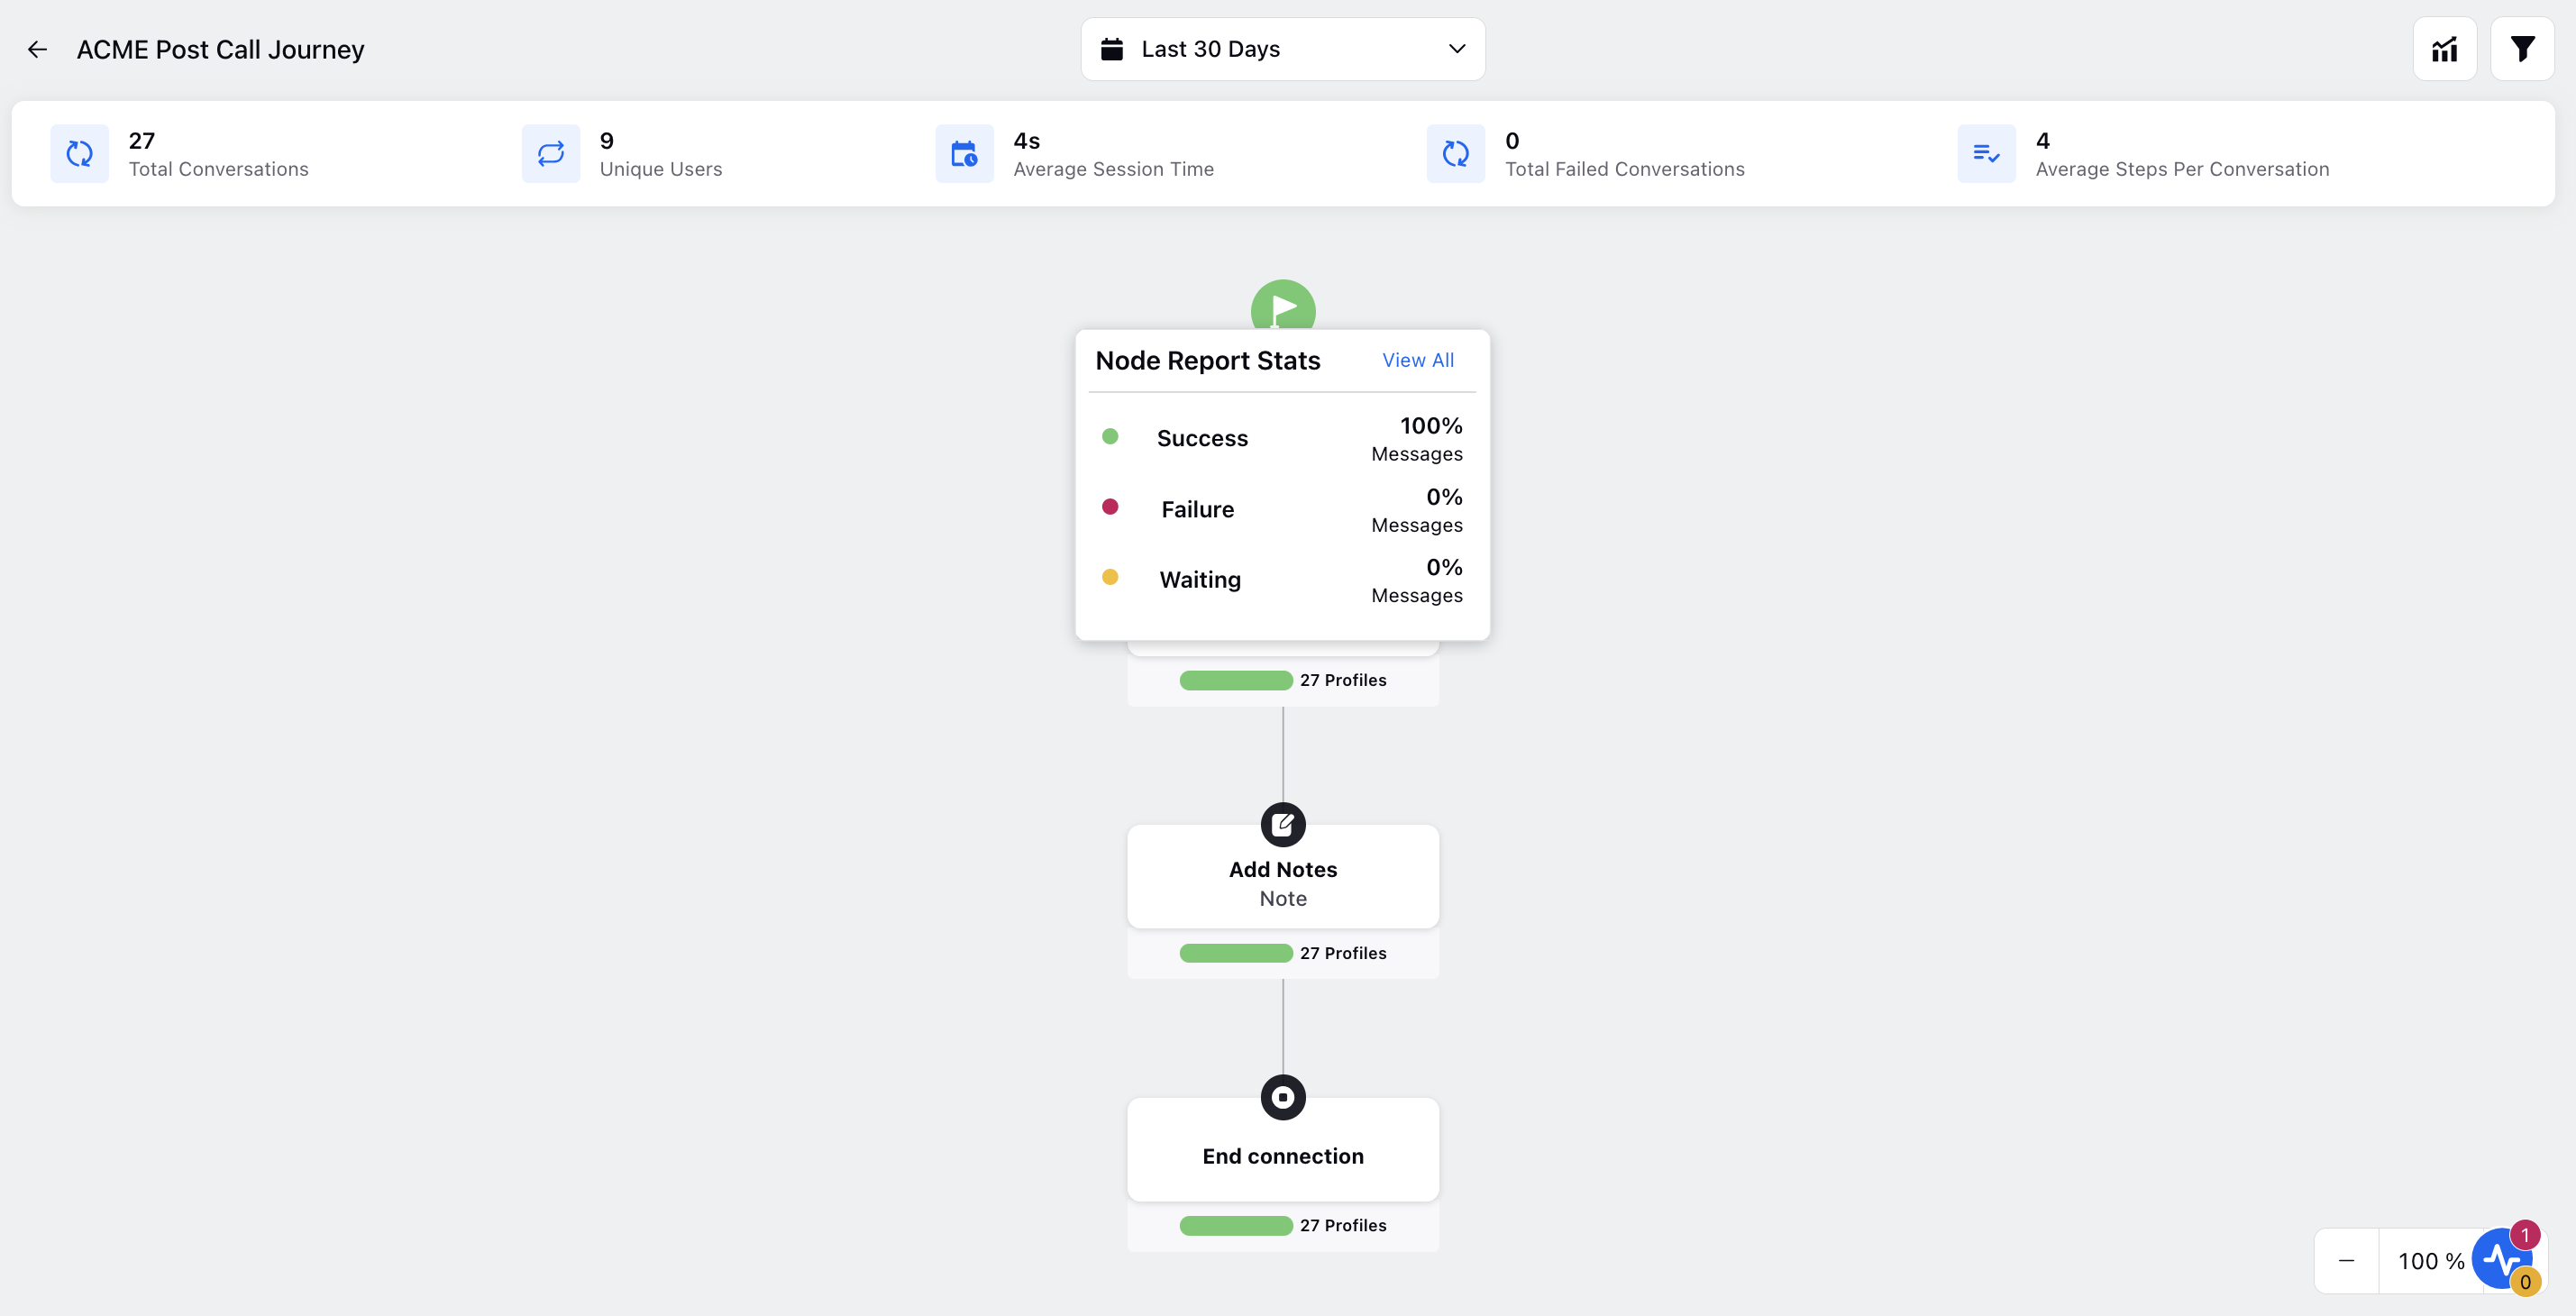
You can view reports on overall journey performance, which includes statistics such as:
Total Conversations
Unique Users
Average Session Time
Total Failed Conversations
Average Steps Per Conversation
Chronological Log of Executed Steps
A chronological log of each executed step within the journey is available. By hovering over the profile count on each node, you can access the Node Report Stats:
The percentage of executions that passed through successfully
The percentage of executions that failed at that node
The percentage of executions that are currently waiting at that node
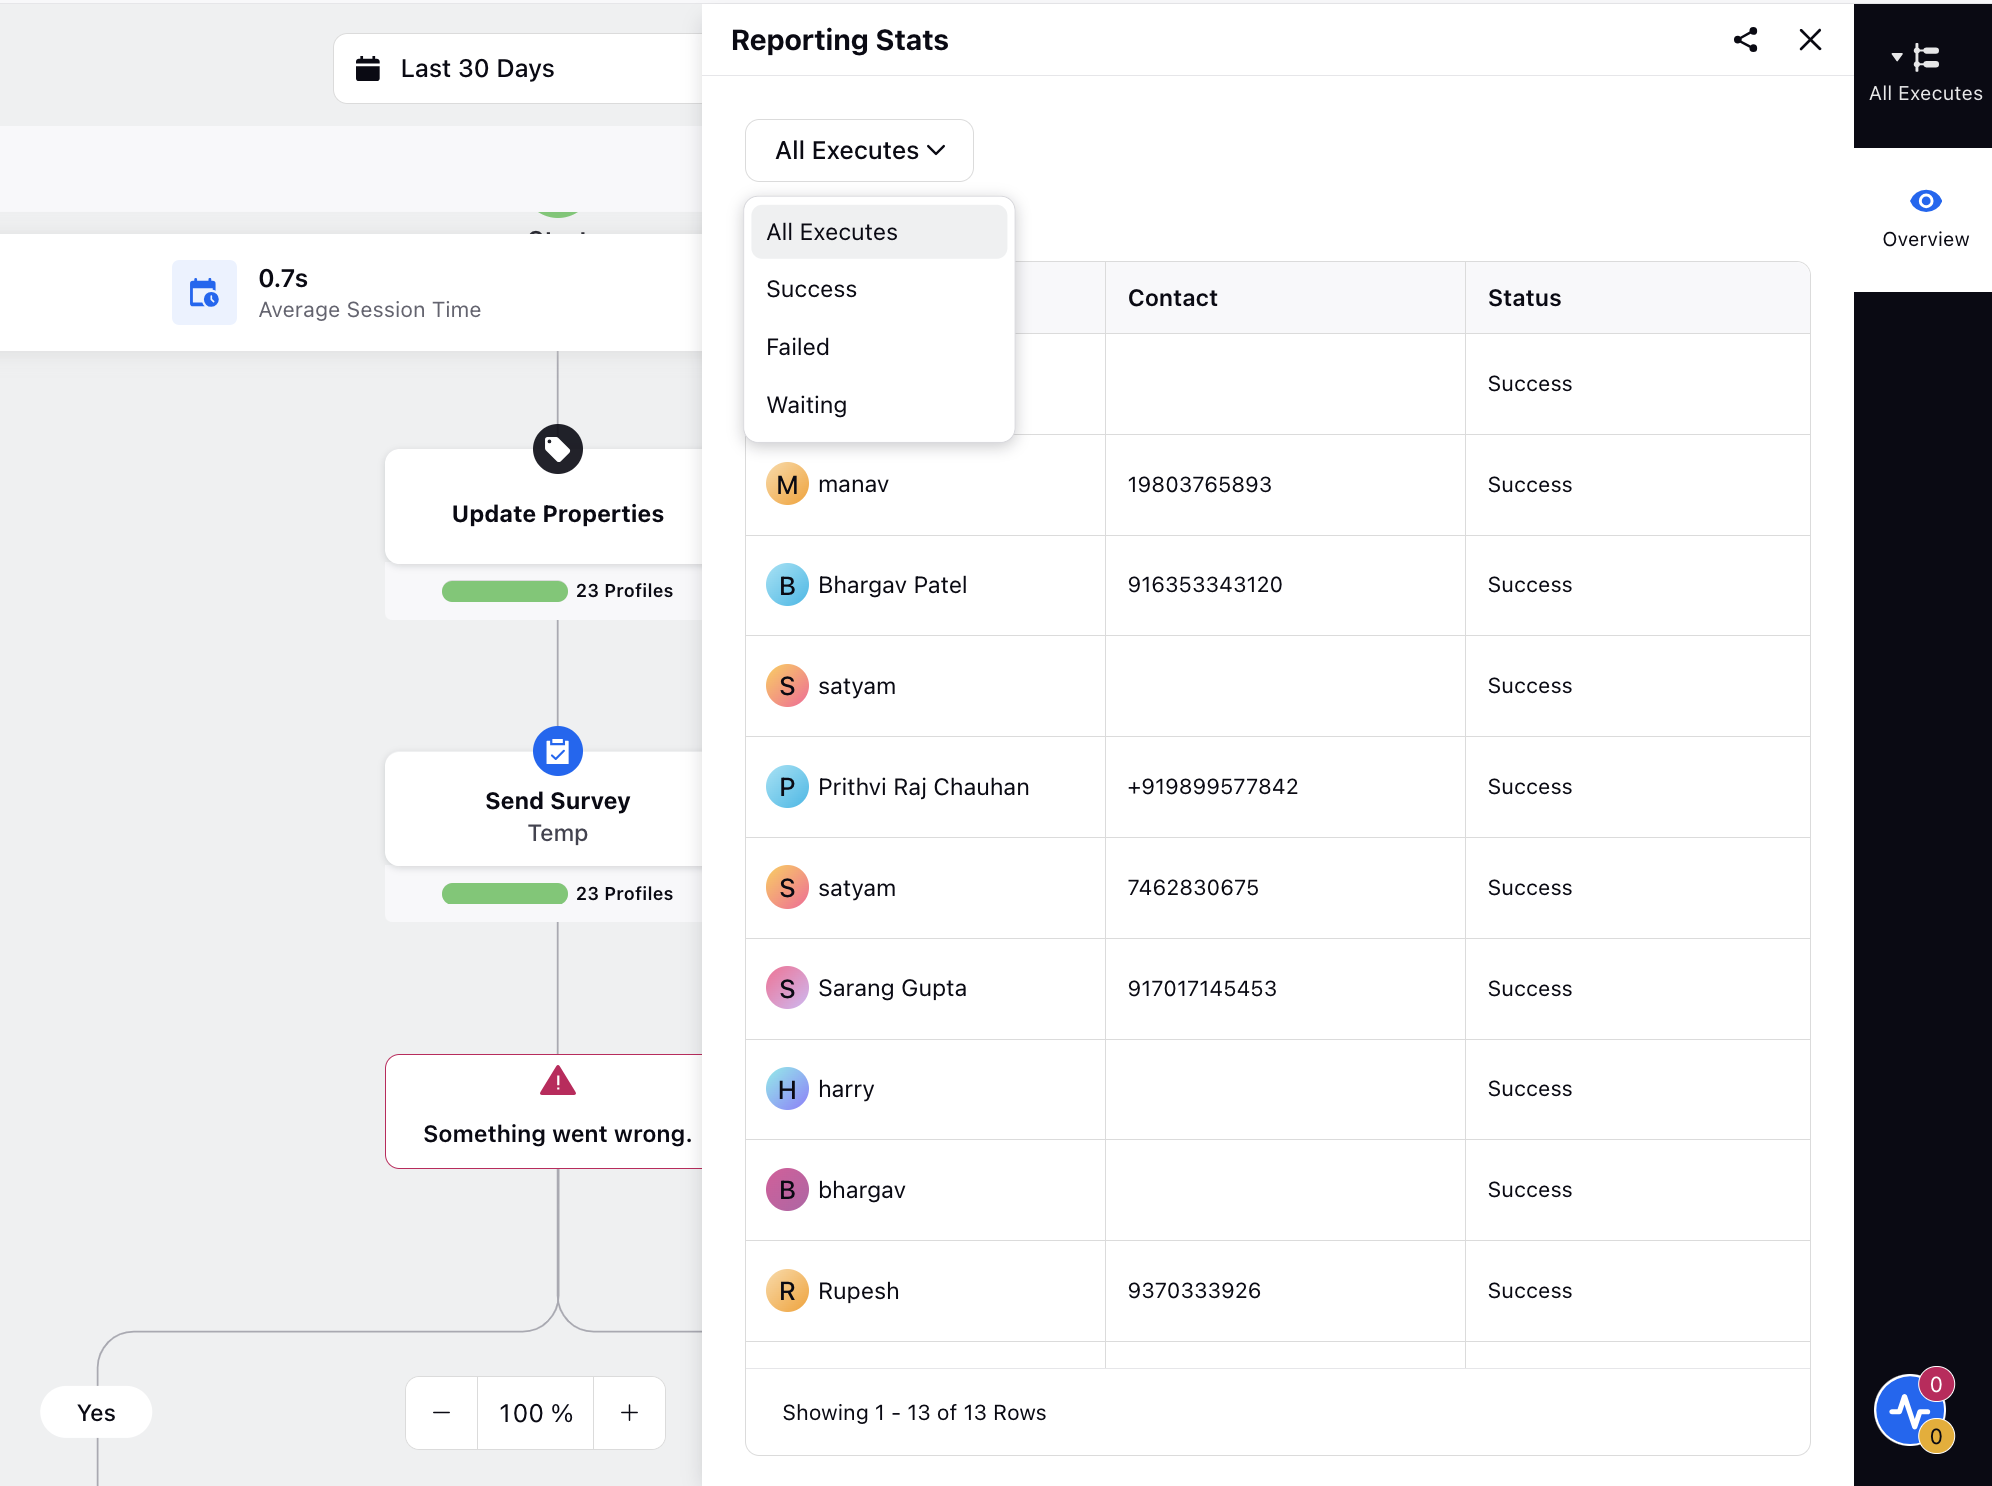
Detailed Profile View
Clicking View All on Node Report Stats opens the Reporting Stats third pane. This pane provides detailed information on all profiles for that particular node, including status and contact details. You can filter these profiles by:
Success
Failed
Waiting
View Configuration and Version History
From the journey logs, you can:
View configuration of the node
Access the version history of the journey flow from the top right corner
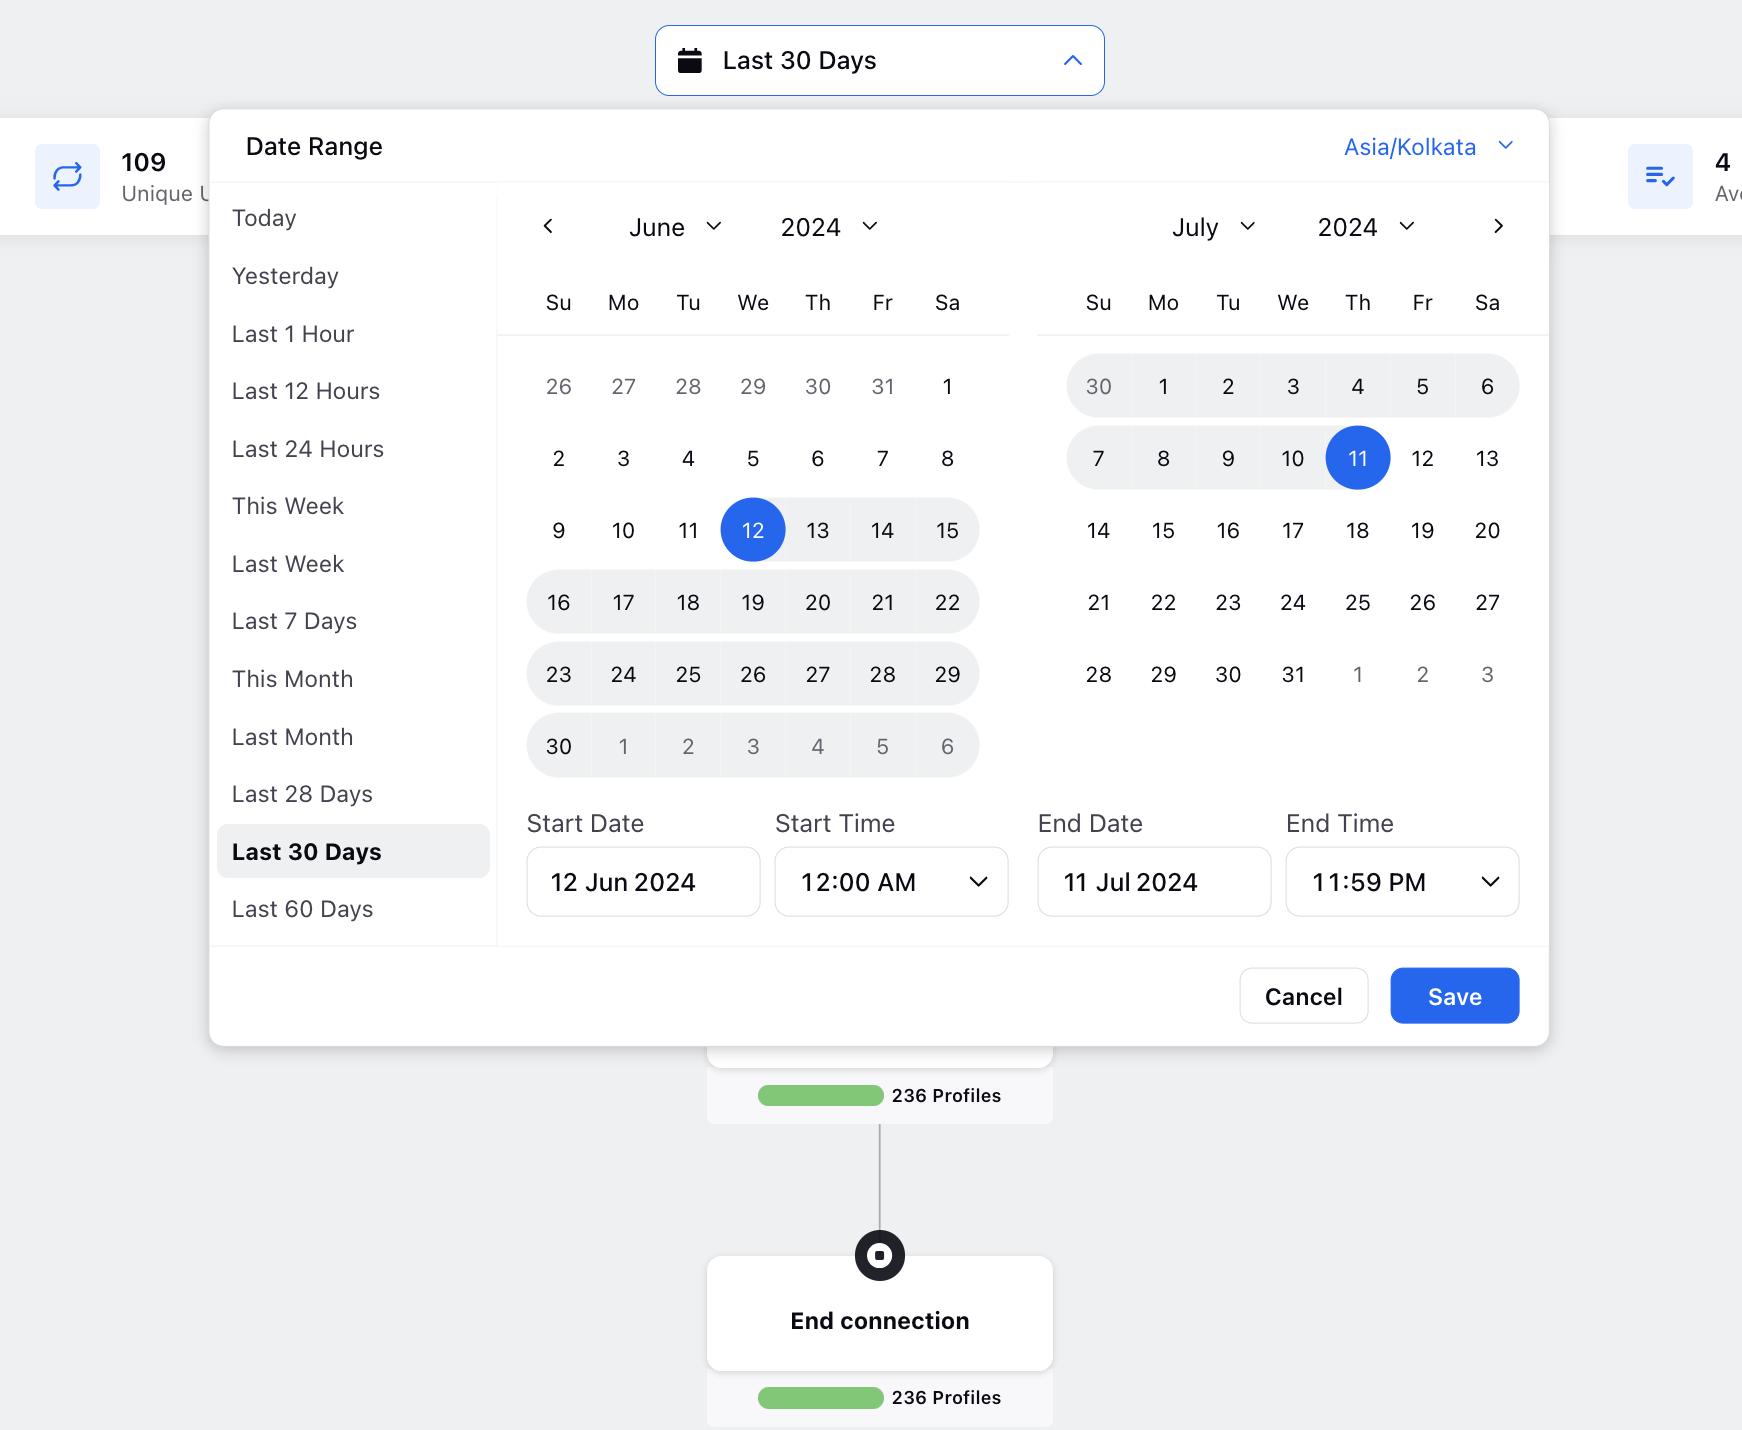
Applying Time Filters
Additionally, you can apply time filters to view the statistics for a specific period, allowing for a more focused analysis of journey performance.