Metrics and dimensions in Visual Insights
Updated
Get familiar with metrics and dimensions supported in Visual Insights.
Metrics and dimensions are used to give you a quantitative view of your online impressions.
A metric is a singular type of data that helps a business measure certain aspects of its operations to achieve success, grow, and optimize its customer journey.
Dimensions are attributes derived after downstream enrichment of your data
Visual Insights metrics & dimensions
In Visual Insights, you can use the following metrics and dimensions to distill information based on your specific needs –
Data Entity | Type | Description |
Photo Mentions | Metric | Total Count of images with your logo present in them |
Photo Object | Dimension | Gives the distribution of what AI-detected objects present alongside your logo |
Photo Scene | Dimension | Gives the distribution of what AI-detected scenes present alongside your logo |
Photo Activity | Dimension | Gives the distribution of AI-detected Activities present alongside your logo |
Photo Visual Sentiment | Dimension | Uses AI to detect Visual Sentiment of people present in the image alongside your logo |
Photo Gender | Dimension | Gives the gender distribution of people present in the image alongside your logo |
Expose Image URL | Dimension | Displays image and video URLs in the UI (Widgets). It allows you to plot the image or video URL for each mention. If there are multiple images in a post, the export will include all URLs, separated by commas. |
How does these dimensions look in the dashboard?
Photo Object: The Photo Object metric shows the distribution of objects associated with your logo.
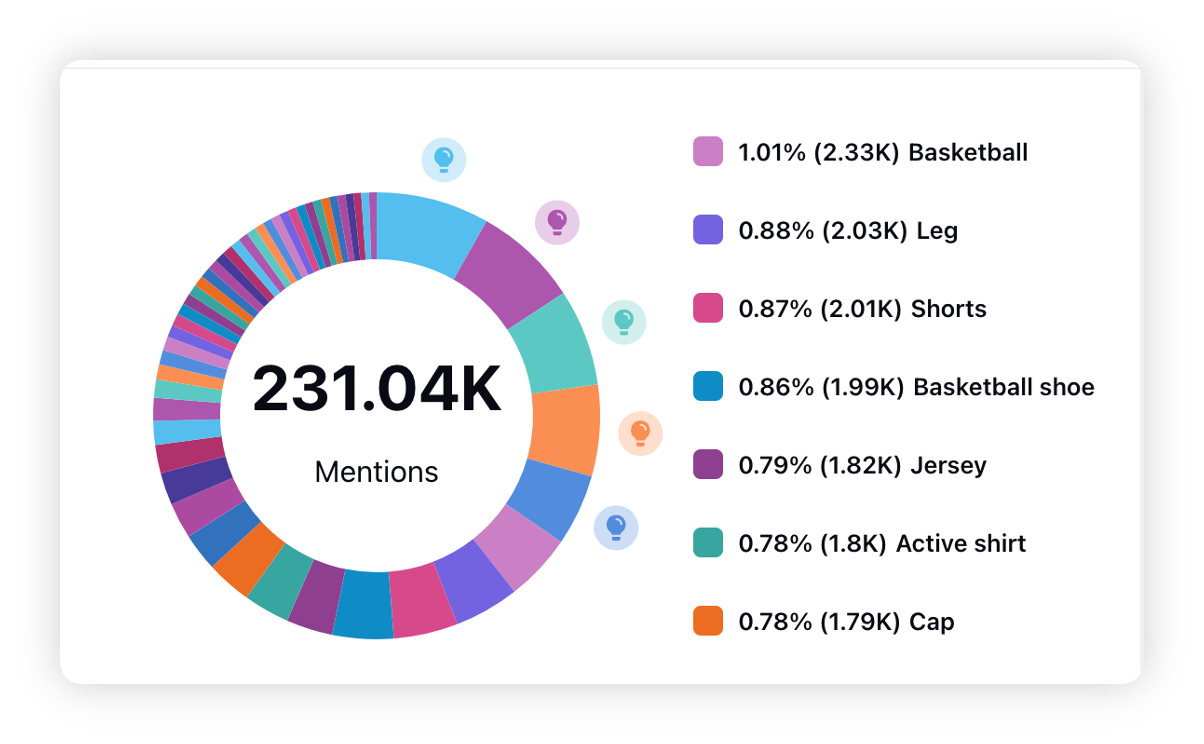
Photo Scene: The Photo Scene metric shows the distribution of scenes associated with your logo.
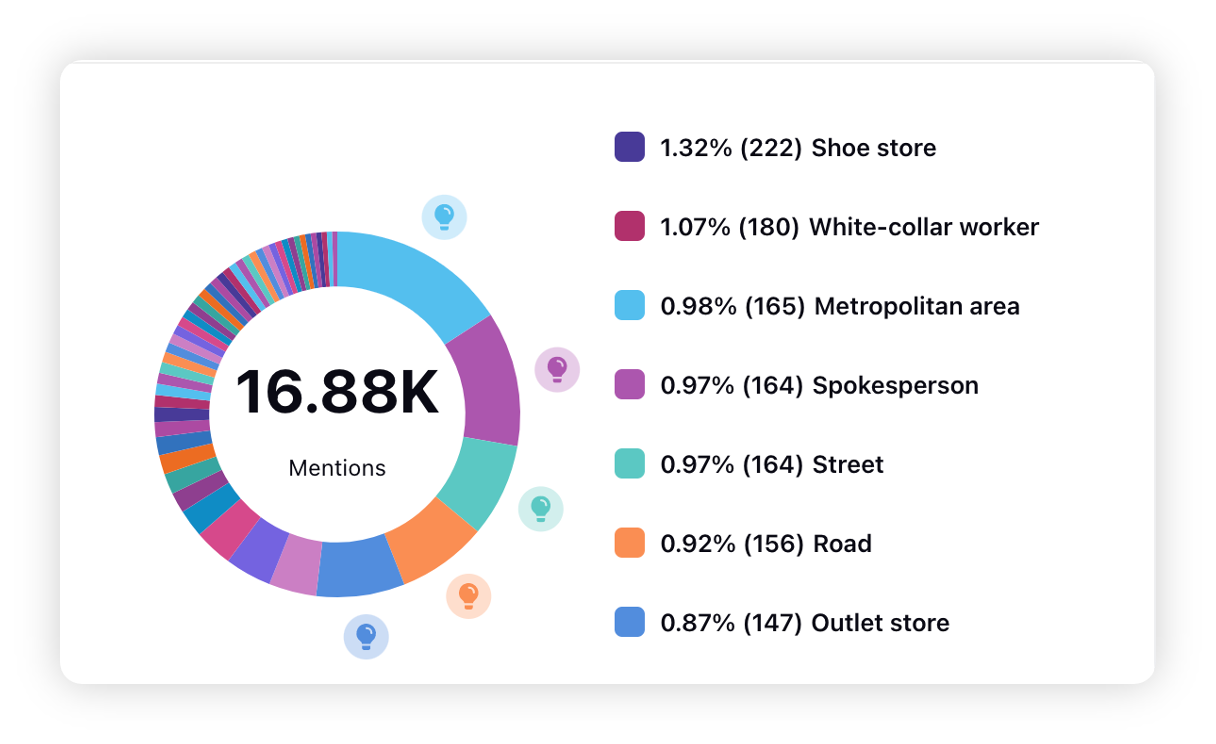
Photo Activity: The Photo Activity metric shows the distribution of activities associated with your logo.
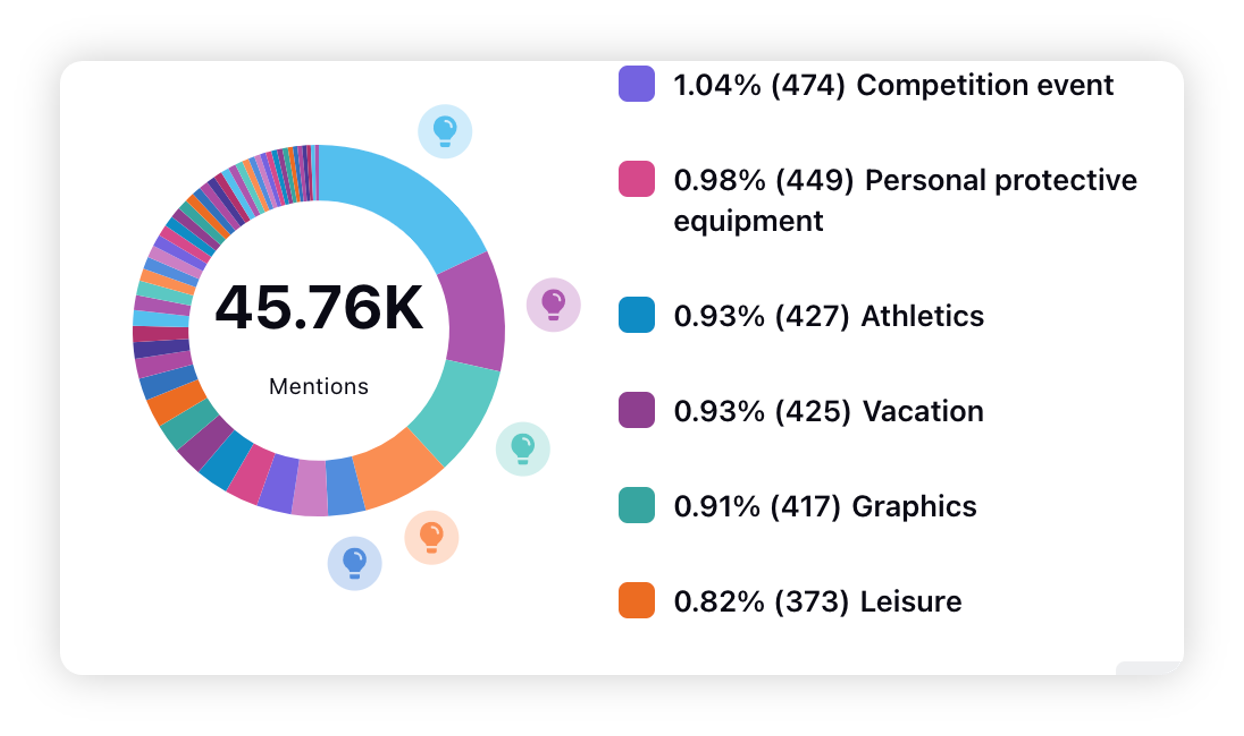
Photo Visual Sentiment: The Photo Visual Sentiment gives you the breakdown of visual sentiment associated with your logo.
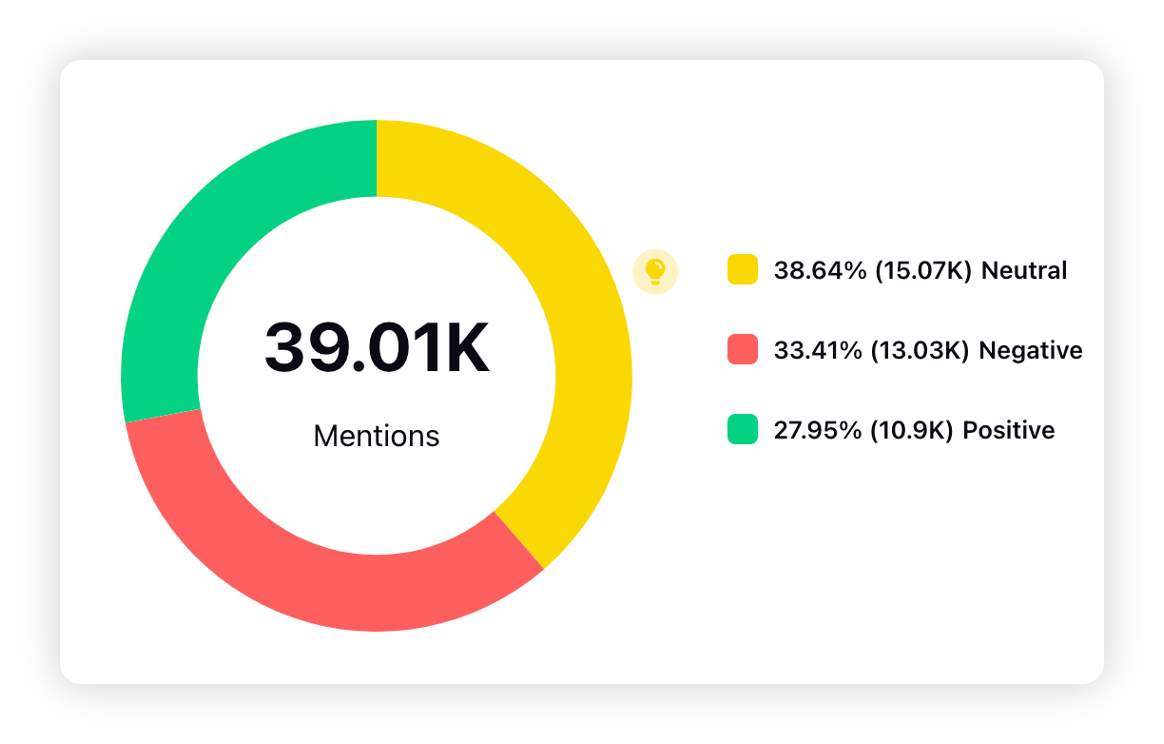
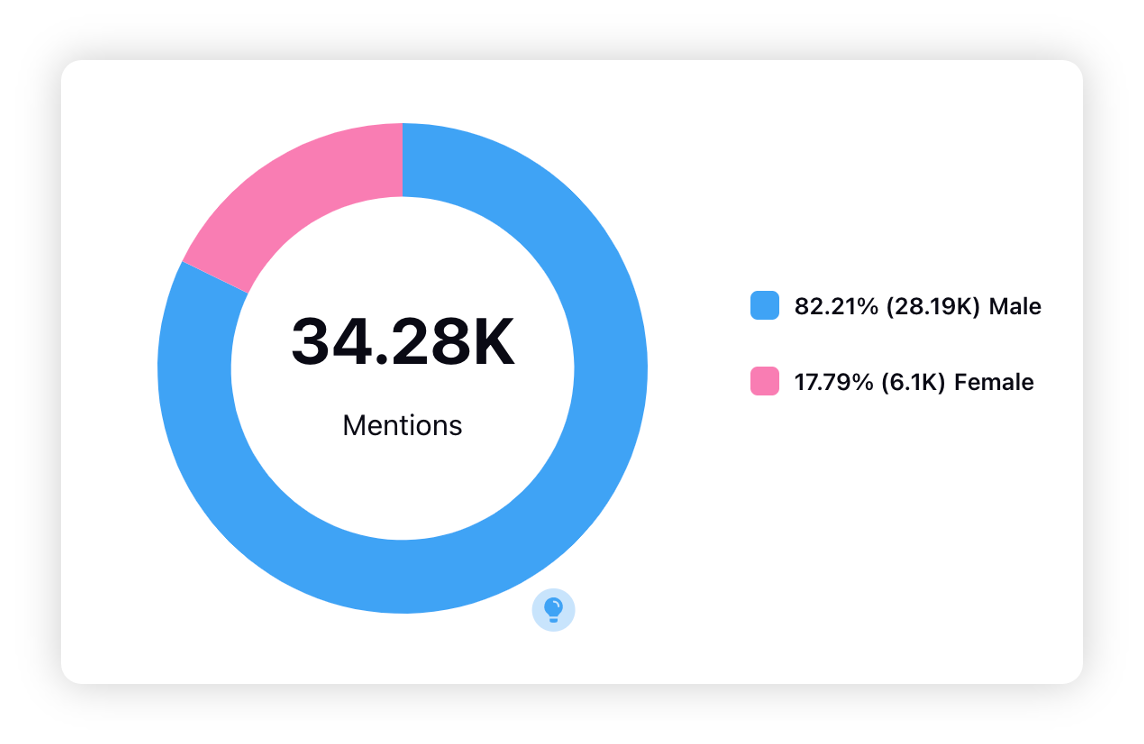
Photo Gender: The Photo Gender filter gives a breakdown of genders associated with your logo.
