Reporting on Guided Workflows
Updated
A Guided Workflow is a business process automation tool that collects inputs and performs actions as per the pre-defined business flow. It can be used by customer care agents to assist customers in a streamlined manner while reducing resolution time. It can also be deployed in an external platform for self-serve use cases, reducing volumes and improving customer satisfaction at the same time.
By creating reporting widgets, you can measure the performance of guided workflows and analyze how it helps brands reduce resolution times and customers receive better, faster service.
To configure a reporting widget
Click the New Tab icon. Under the Sprinklr Service tab, click Care Reporting within Analyze.
On the Reporting Home window, select the desired dashboard within the Dashboards section.
On the selected Reporting Dashboard window, click Add Widget in the top right corner.
On the Create Custom Widget window, enter a Name for the widget, and select the required Data Source as mentioned below.
Select a Visualization for your widget from the available visualization types.
Next, within the What would you like to plot on your widget section, select the desired dimensions and metrics for which you want to view the reporting. You can also apply various filters, e.g., Account and Channel Type.
Click Add to Dashboard in the bottom right corner to add your widget to the dashboard.
Common Use Cases
Guided Workflow Overview
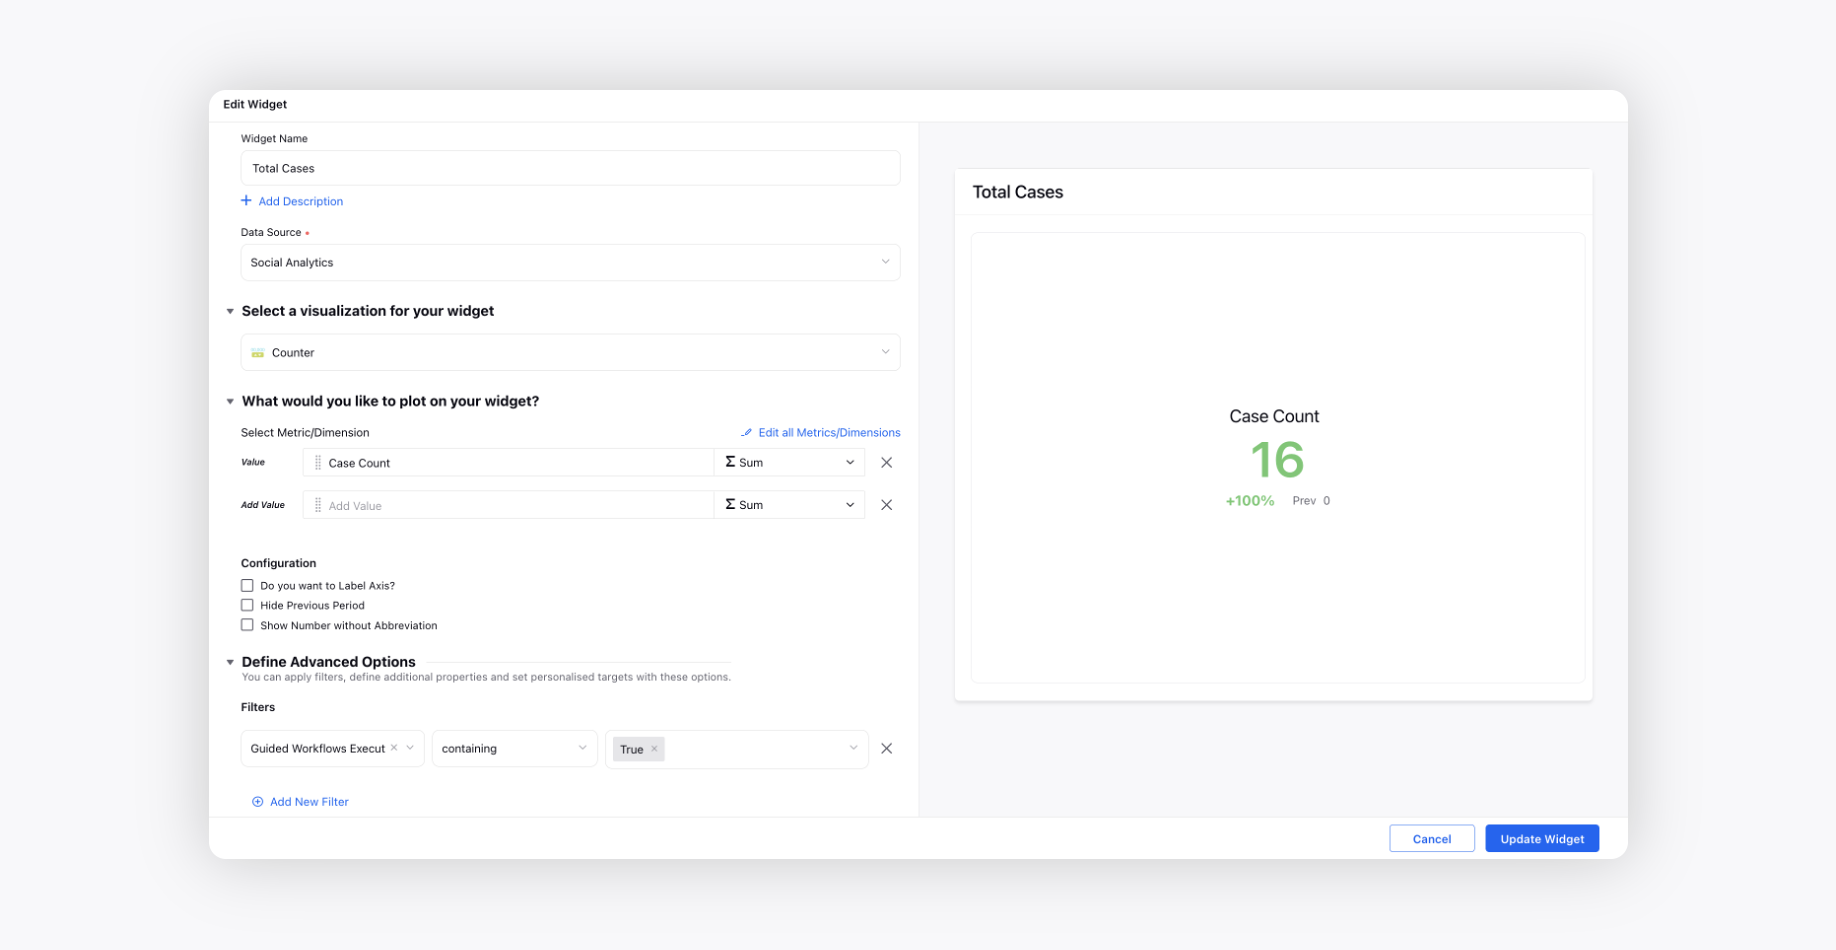
Total Cases
Create a Counter widget and choose the Data Source as Social Analytics.
Select the Case Count metric and add the Guided Workflows Executed filter as True.
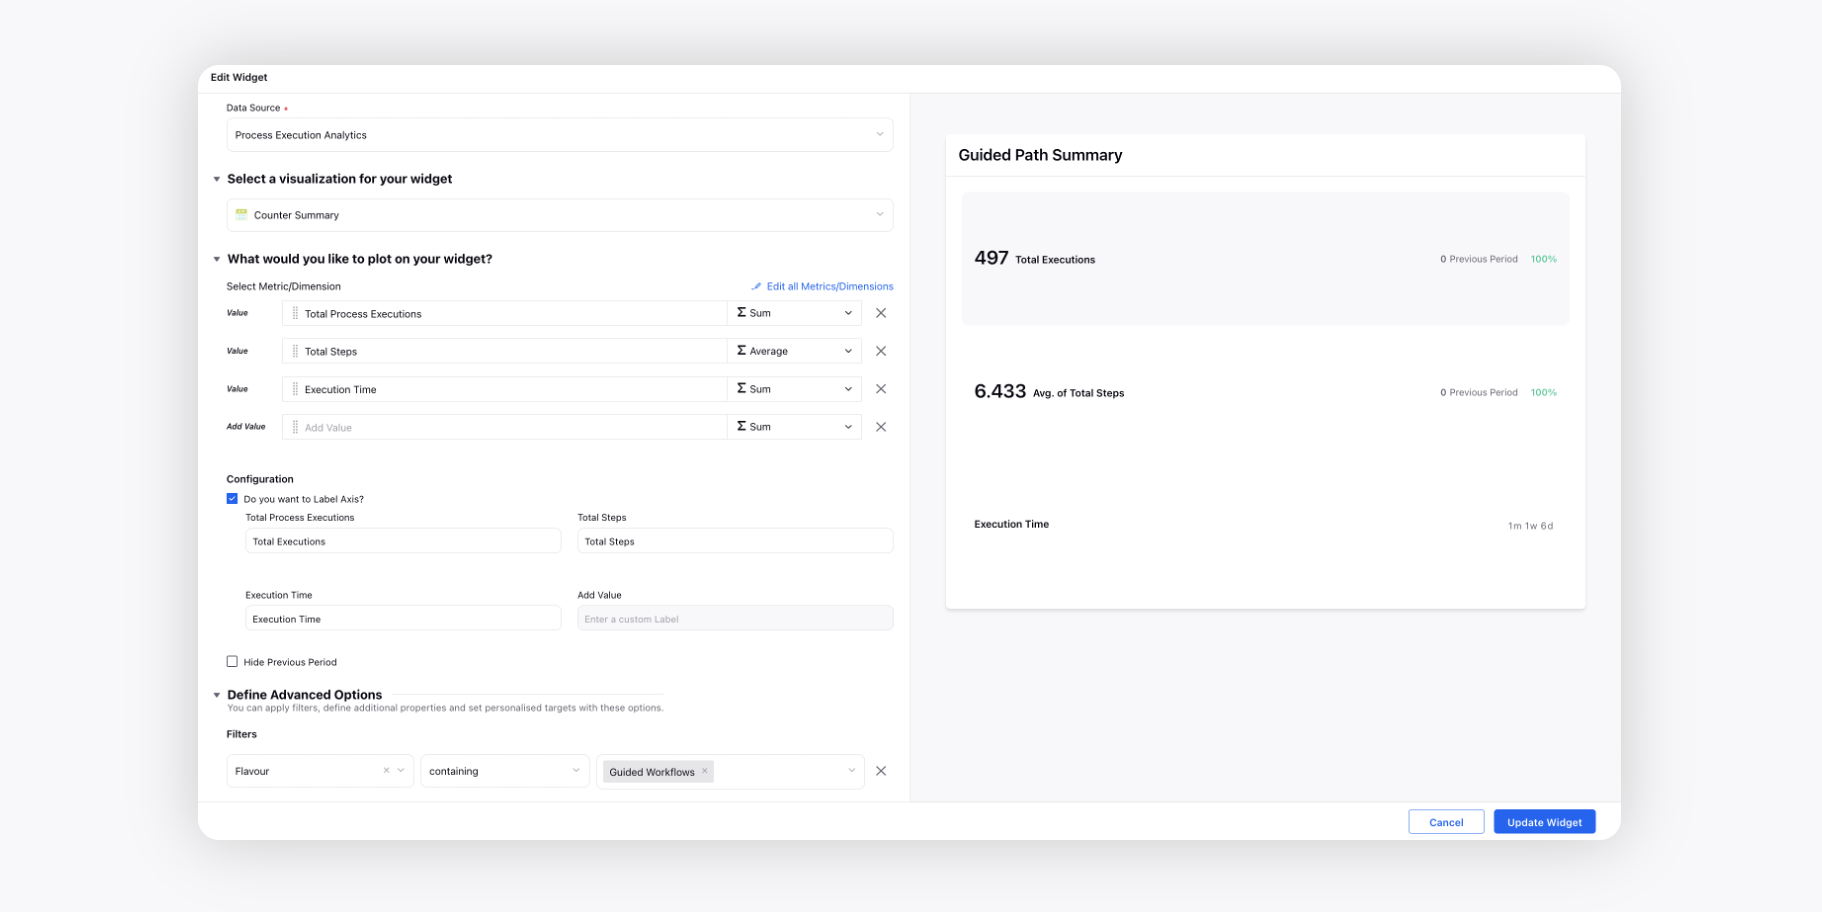
Guided Path Summary
Create a Counter Summary widget and choose the Data Source as Process Execution Analytics.
Select the Total Process Executions, Total Steps, and Execution Time metrics and add the Flavour filter as Guided Workflows.
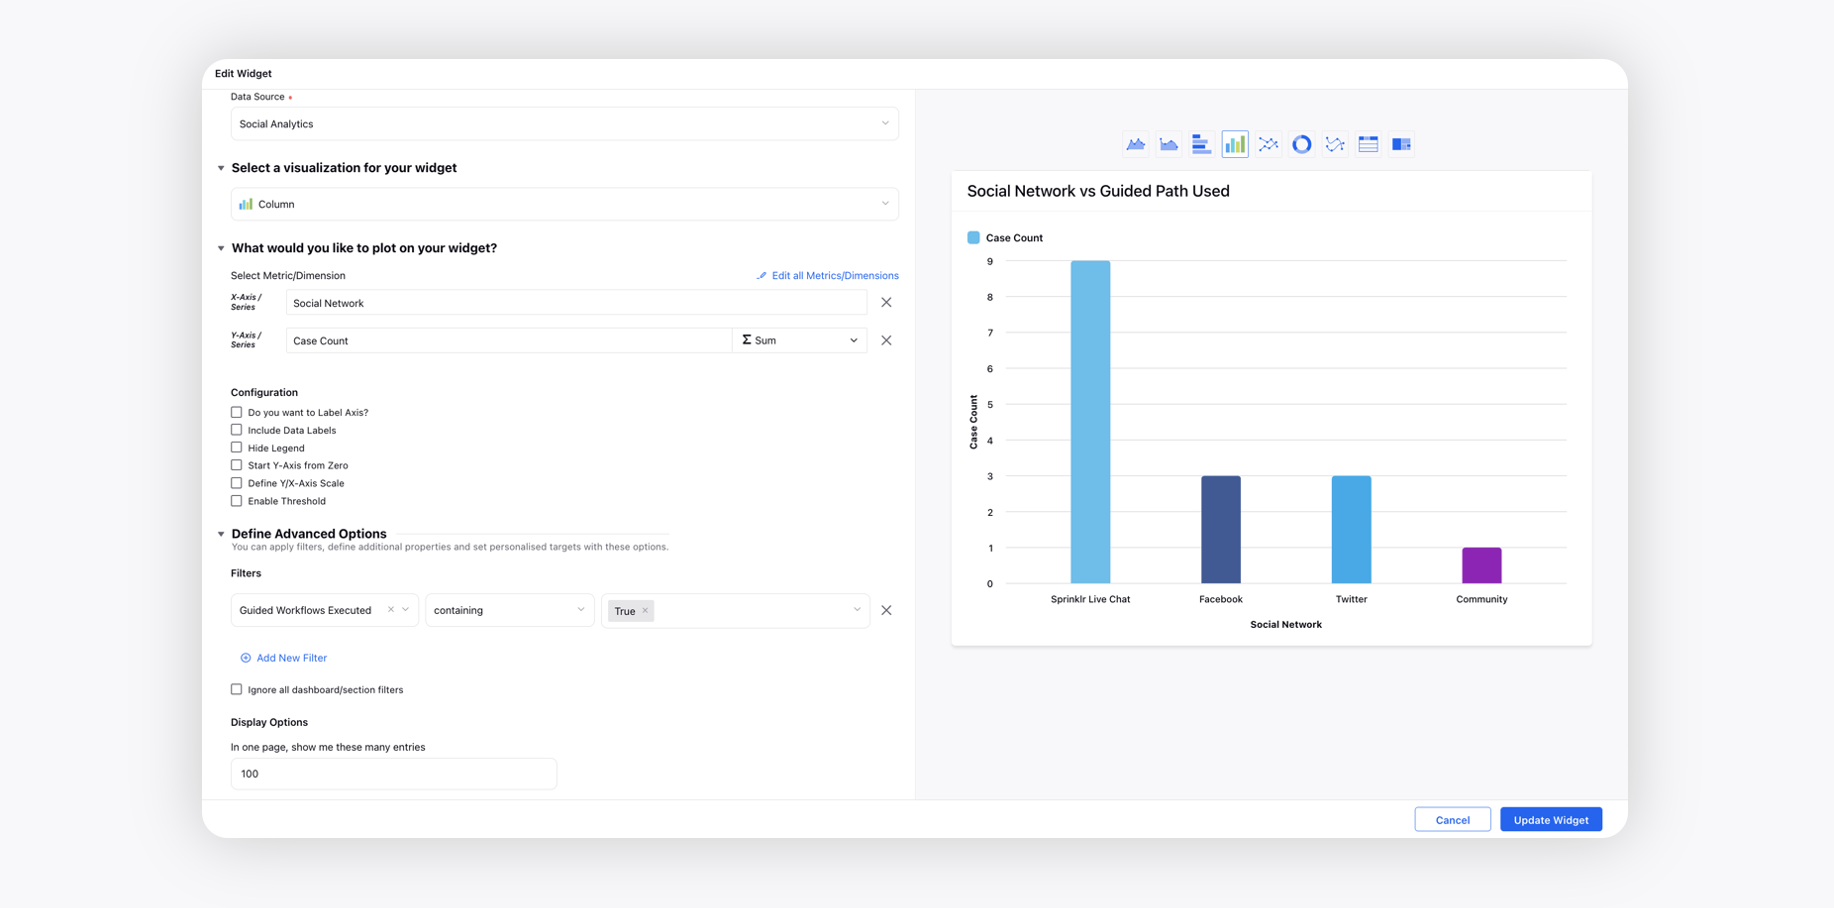
Social Network vs Guided Path Used
Create a Column widget and choose the Data Source as Social Analytics.
Select the Case Count metric with Social Network dimension. Add the Guided Workflows Executed filter as True.
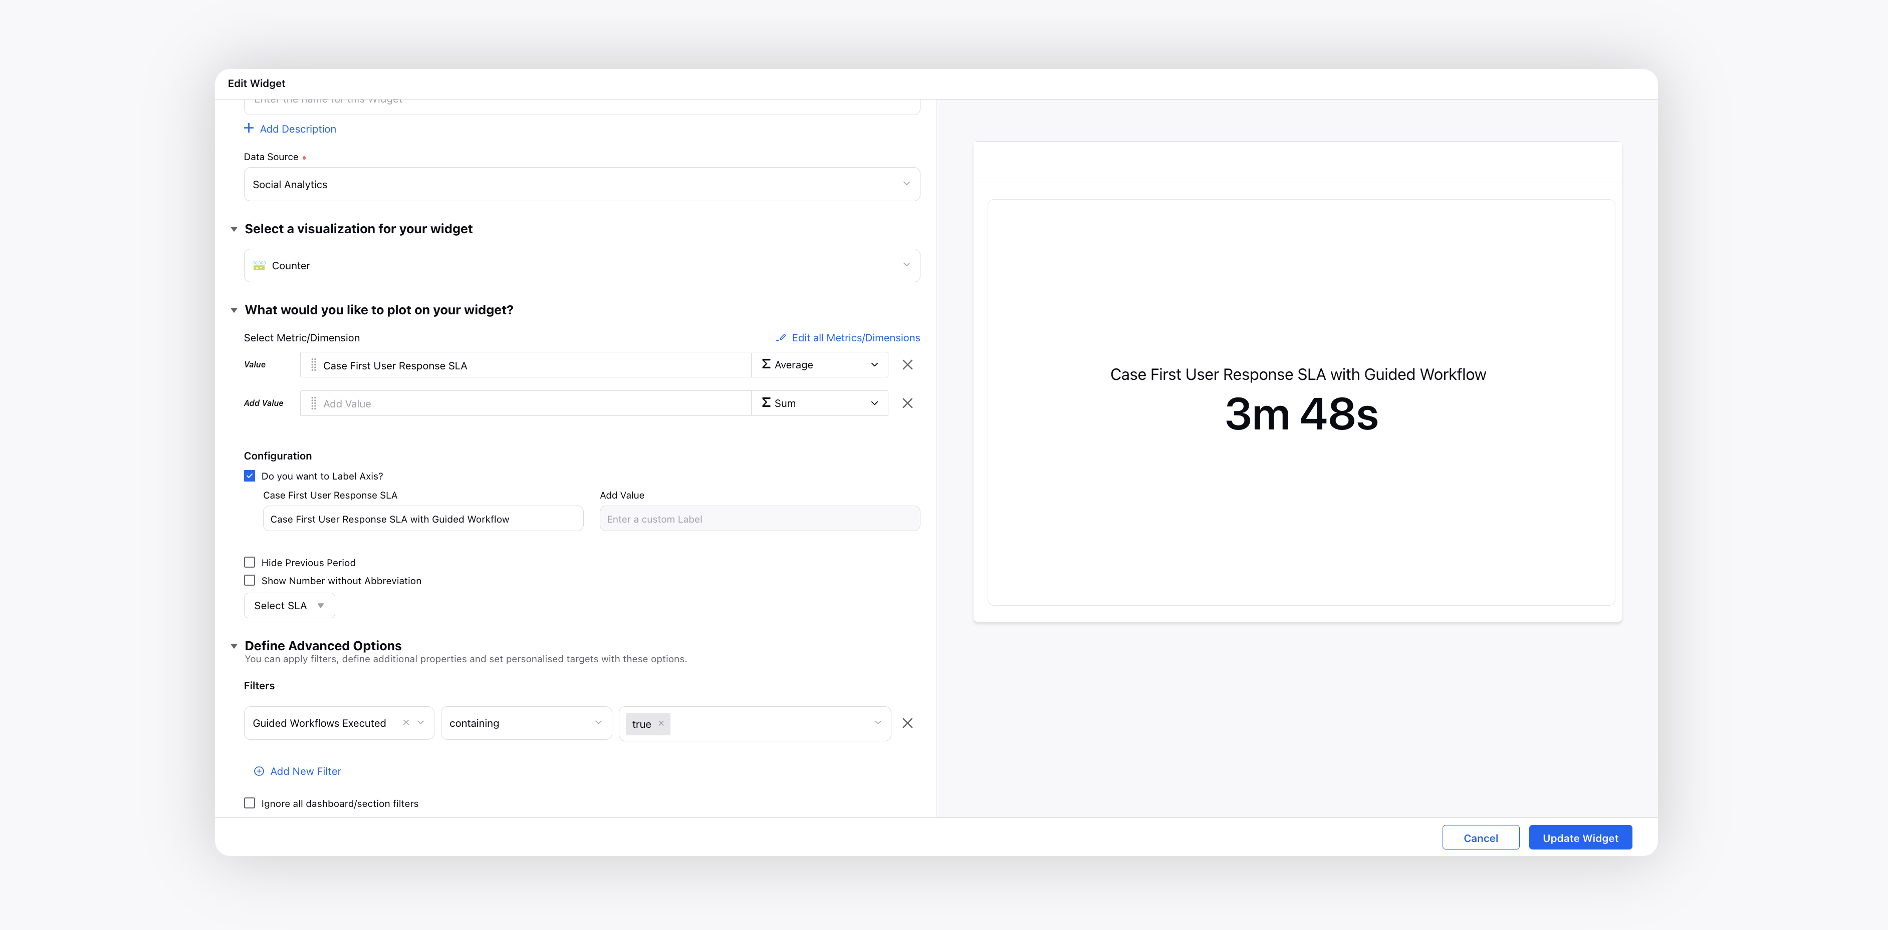
Case First User Response SLA with Guided Workflow
Create a Counter widget and choose the Data Source as Social Analytics.
Select the Case First User Response SLA metric and add the Guided Workflows Executed filter as true.
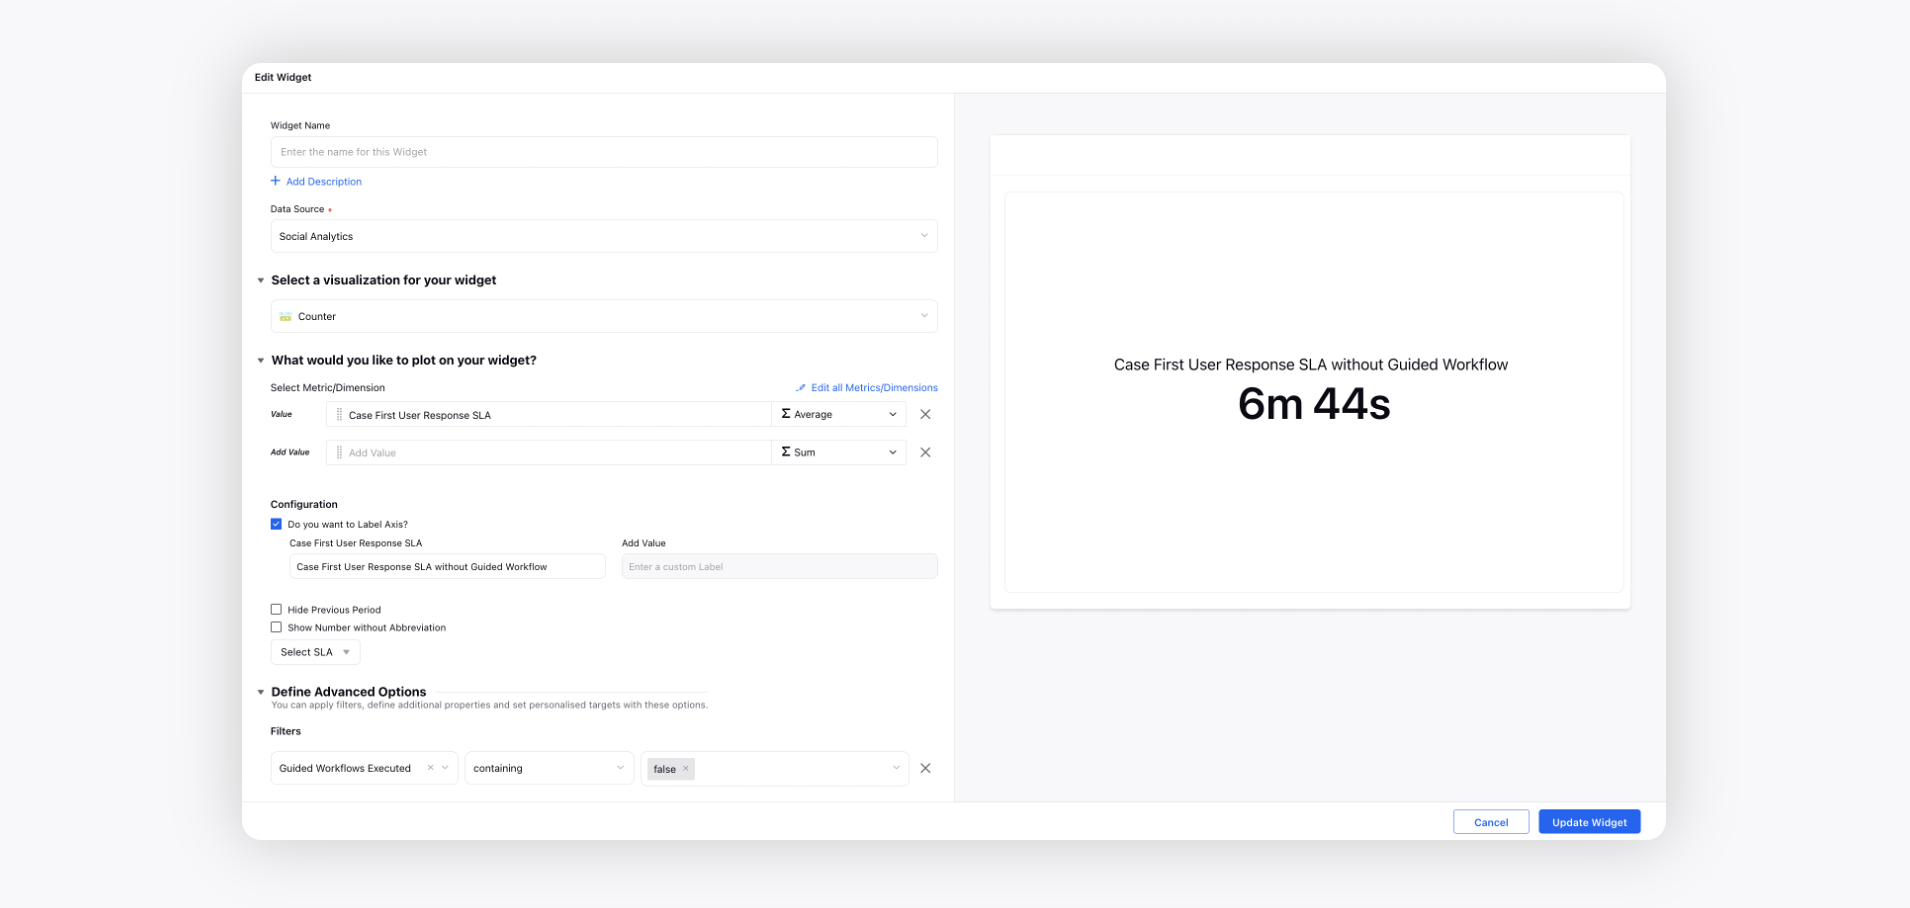
Case First User Response SLA without Guided Workflow
Create a Counter widget and choose the Data Source as Social Analytics.
Select the Case First User Response SLA metric and add the Guided Workflows Executed filter as false.
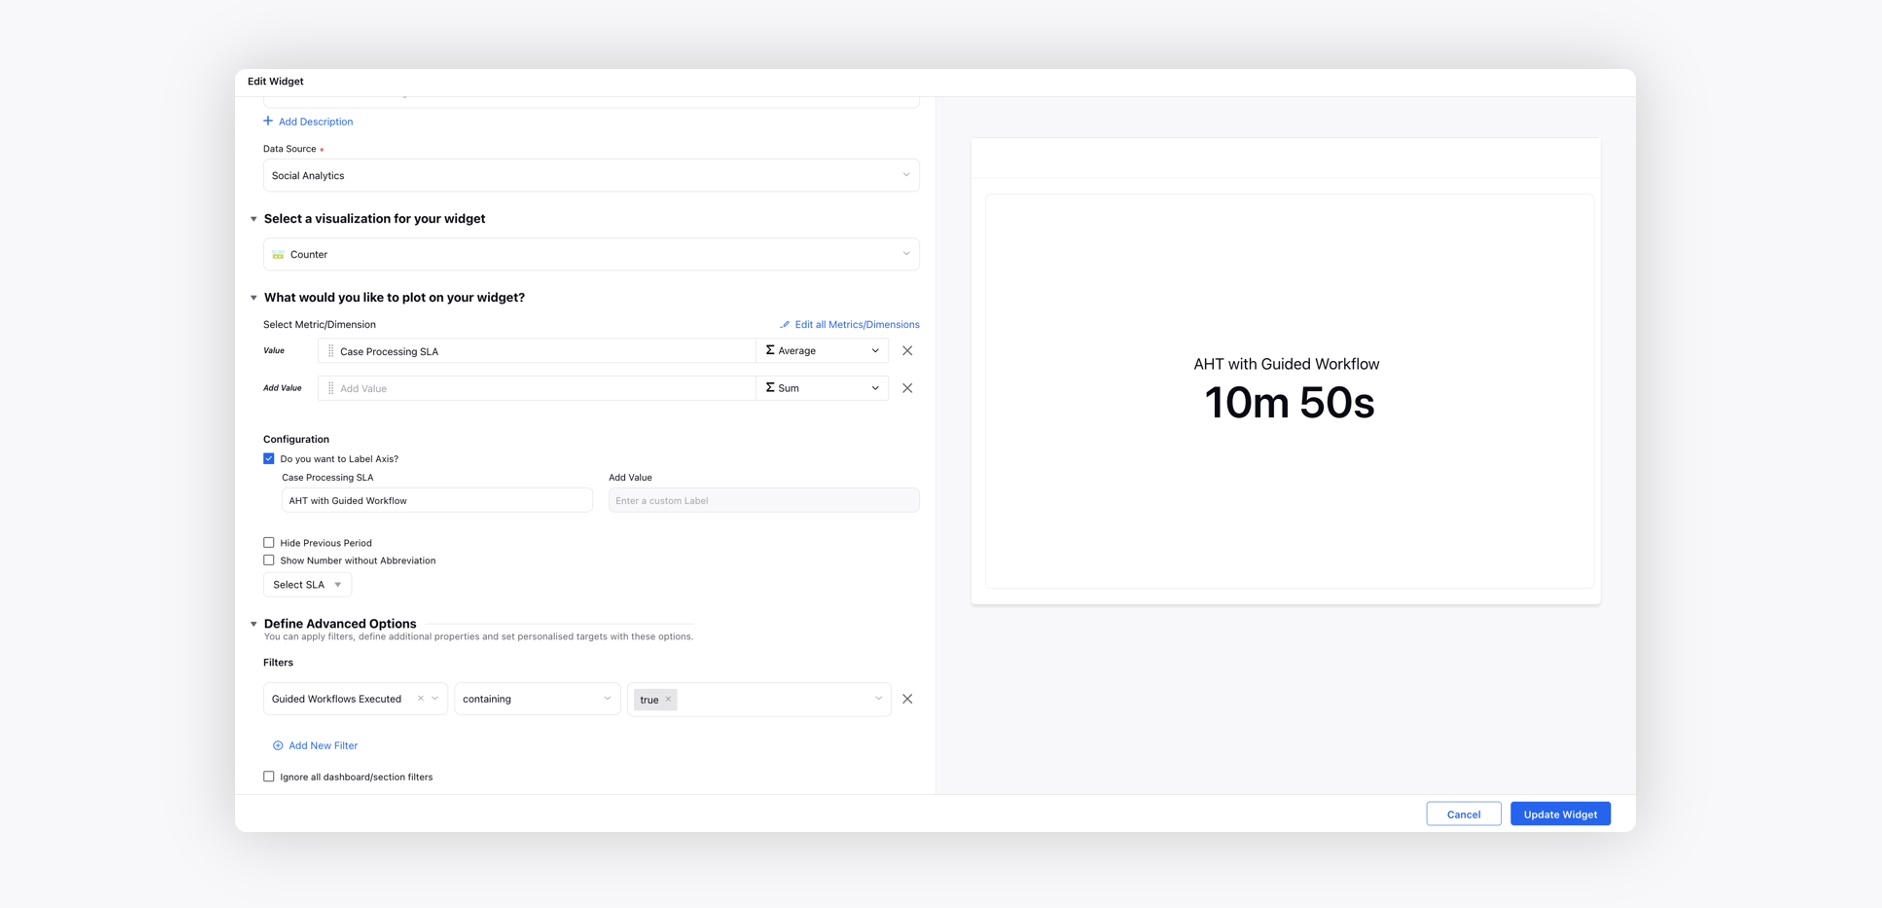
AHT with Guided Workflow
Create a Counter widget and choose the Data Source as Social Analytics.
Select the Case Processing SLA metric and add the Guided Workflows Executed filter as true.
AHT without Guided Workflow
Create a Counter widget and choose the Data Source as Social Analytics.
Select the Case Processing SLA metric and add the Guided Workflows Executed filter as false.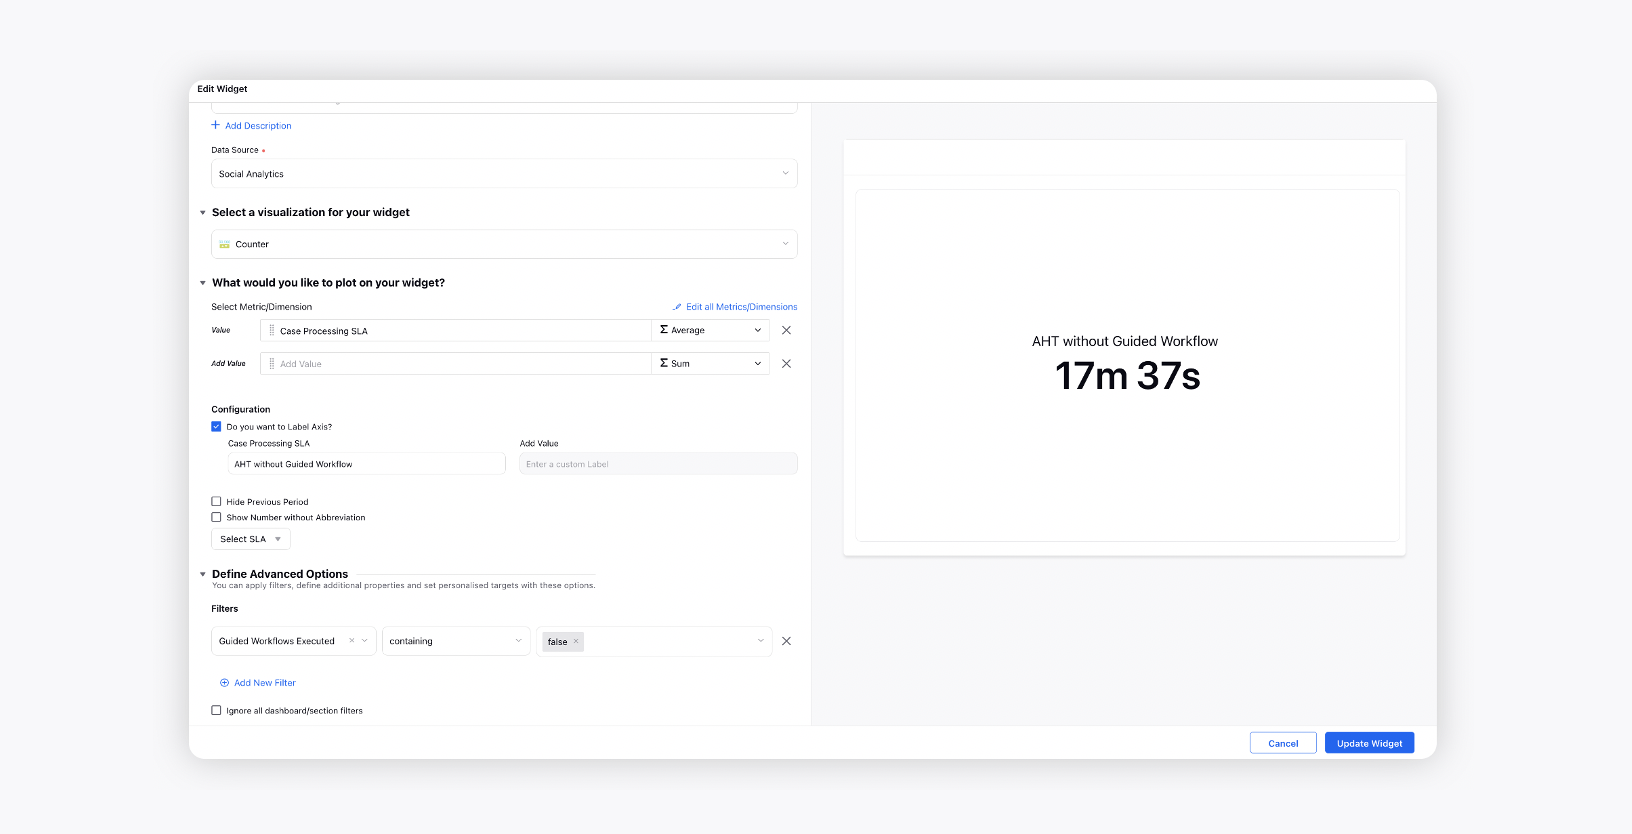
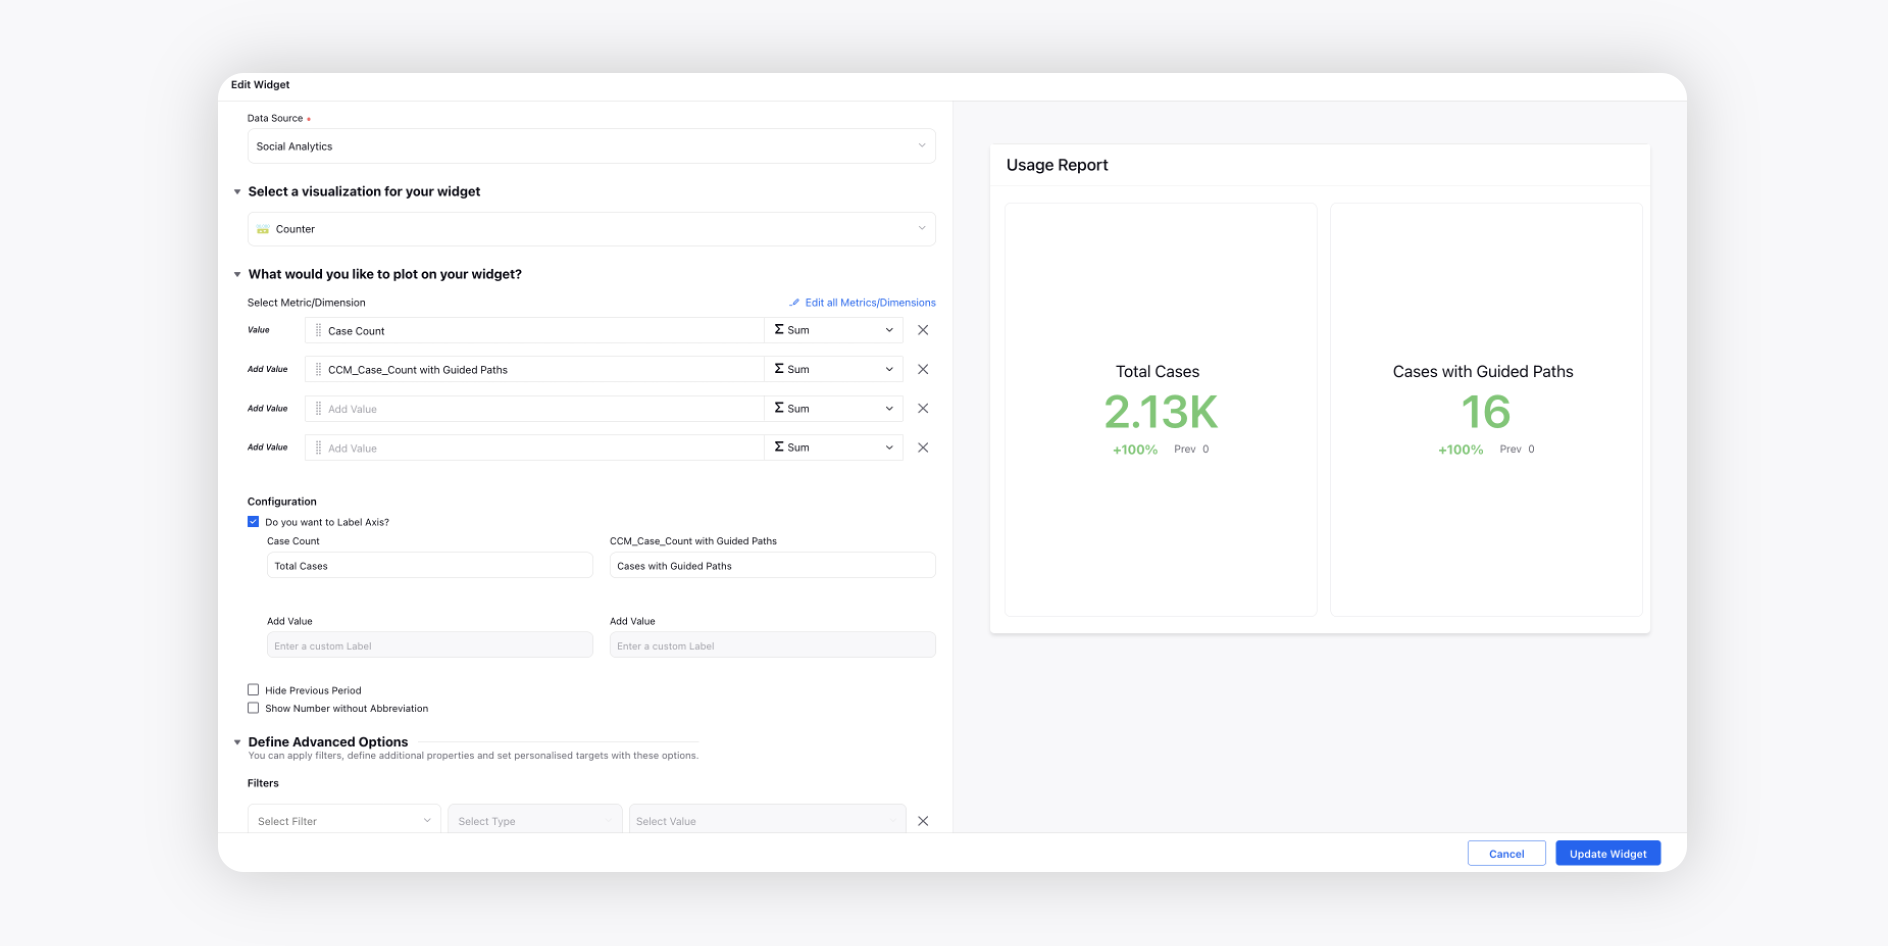
Usage Report
Create a Counter widget and choose the Data Source as Social Analytics.
Select the Case Count and CCM_Case_Count with Guided Paths metrics.
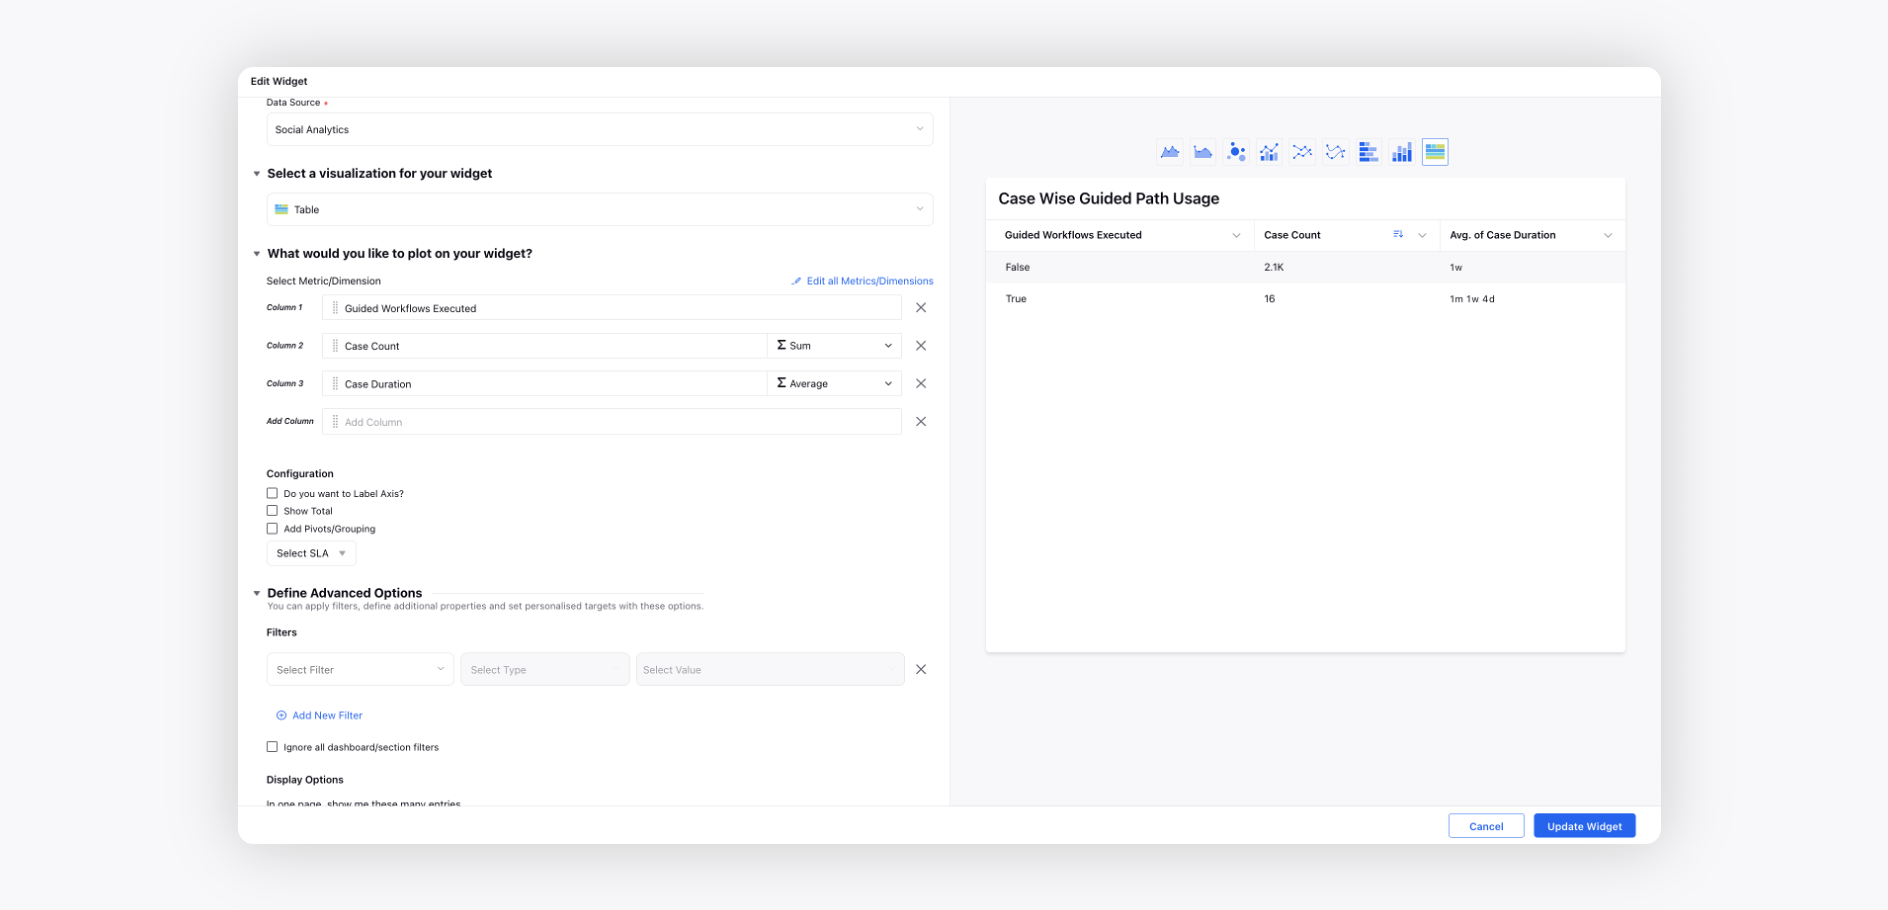
Case Wise Guided Path Usage
Create a Table widget and choose the Data Source as Social Analytics.
Select the Case Count and Case Duration metrics with Guided Workflows Executed dimension.
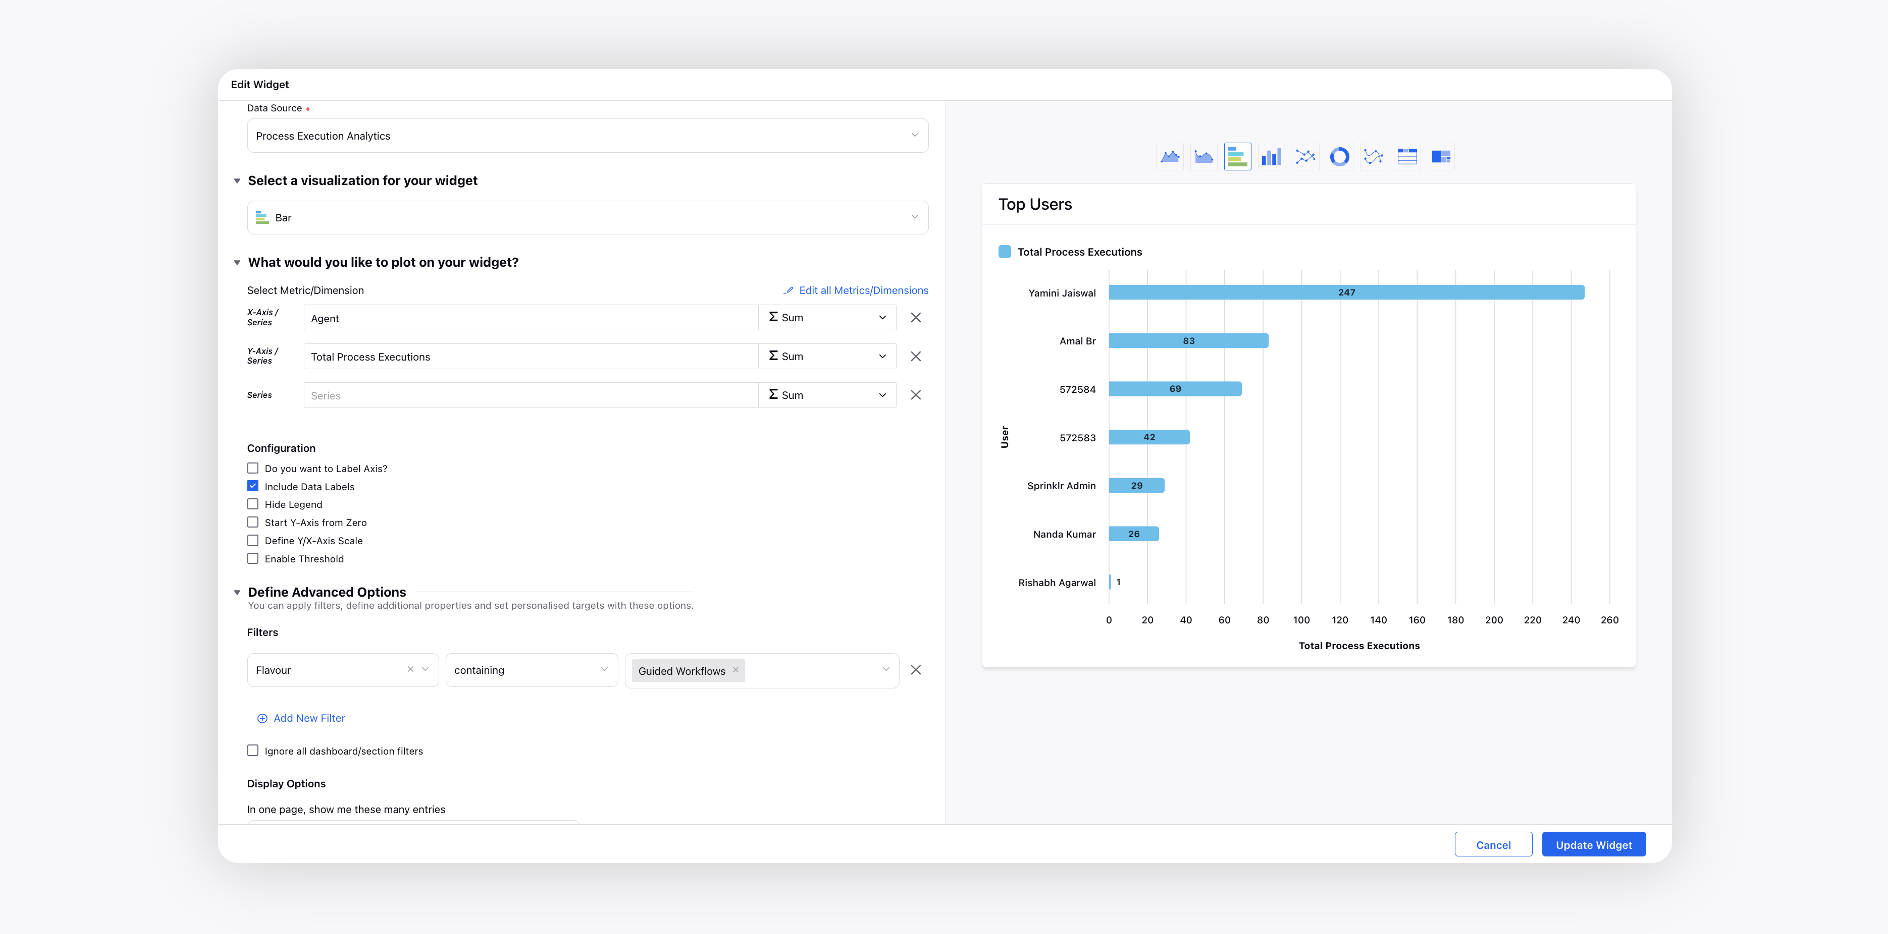
Top Users
Create a Bar widget and choose the Data Source as Process Execution Analytics.
Select the Total Process Executions metric with Agent dimension. Add the Flavour filter as Guided Workflows.
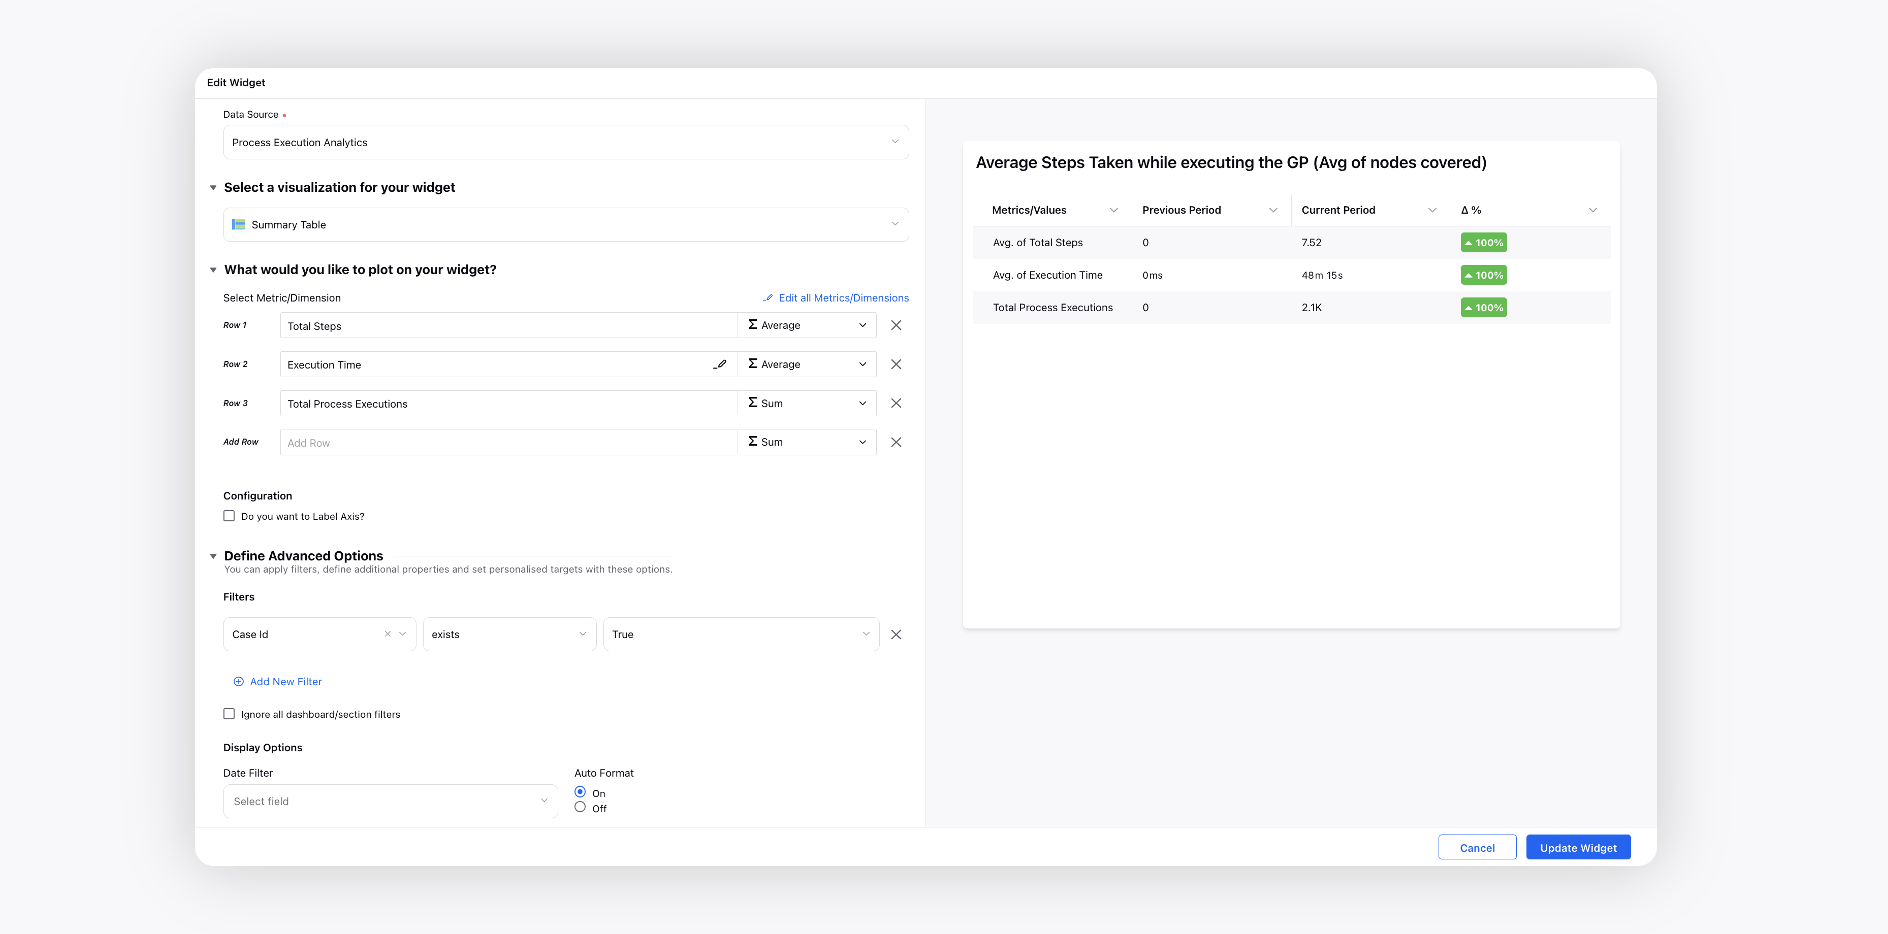
Average Steps Taken while executing the GP (Avg. of nodes covered)
Create a Summary Table widget and choose the Data Source as Process Execution Analytics.
Select the Total Steps, Execution Time, and Total Process Executions metrics. Add the Case Id filter as True.
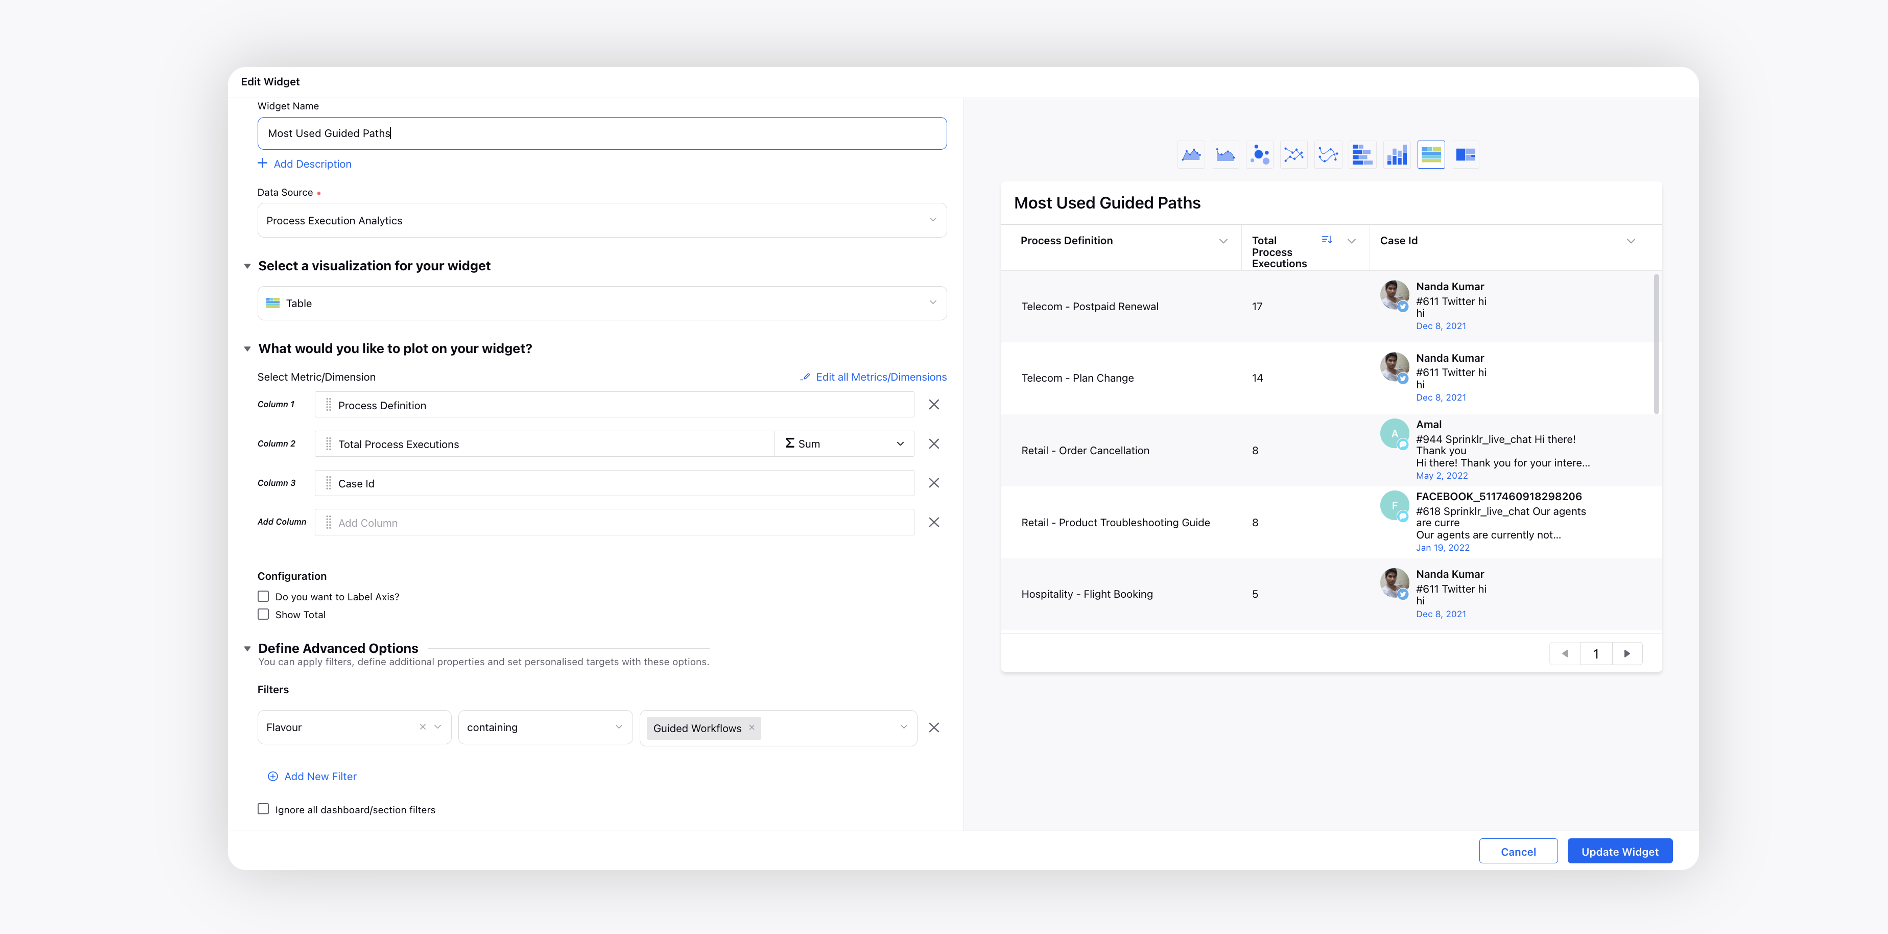
Most Used Guided Paths
Create a Table widget and choose the Data Source as Process Execution Analytics.
Select the Total Process Executions metric with Process Definition and Case Id dimensions. Add the Flavour filter as Guided Workflows.
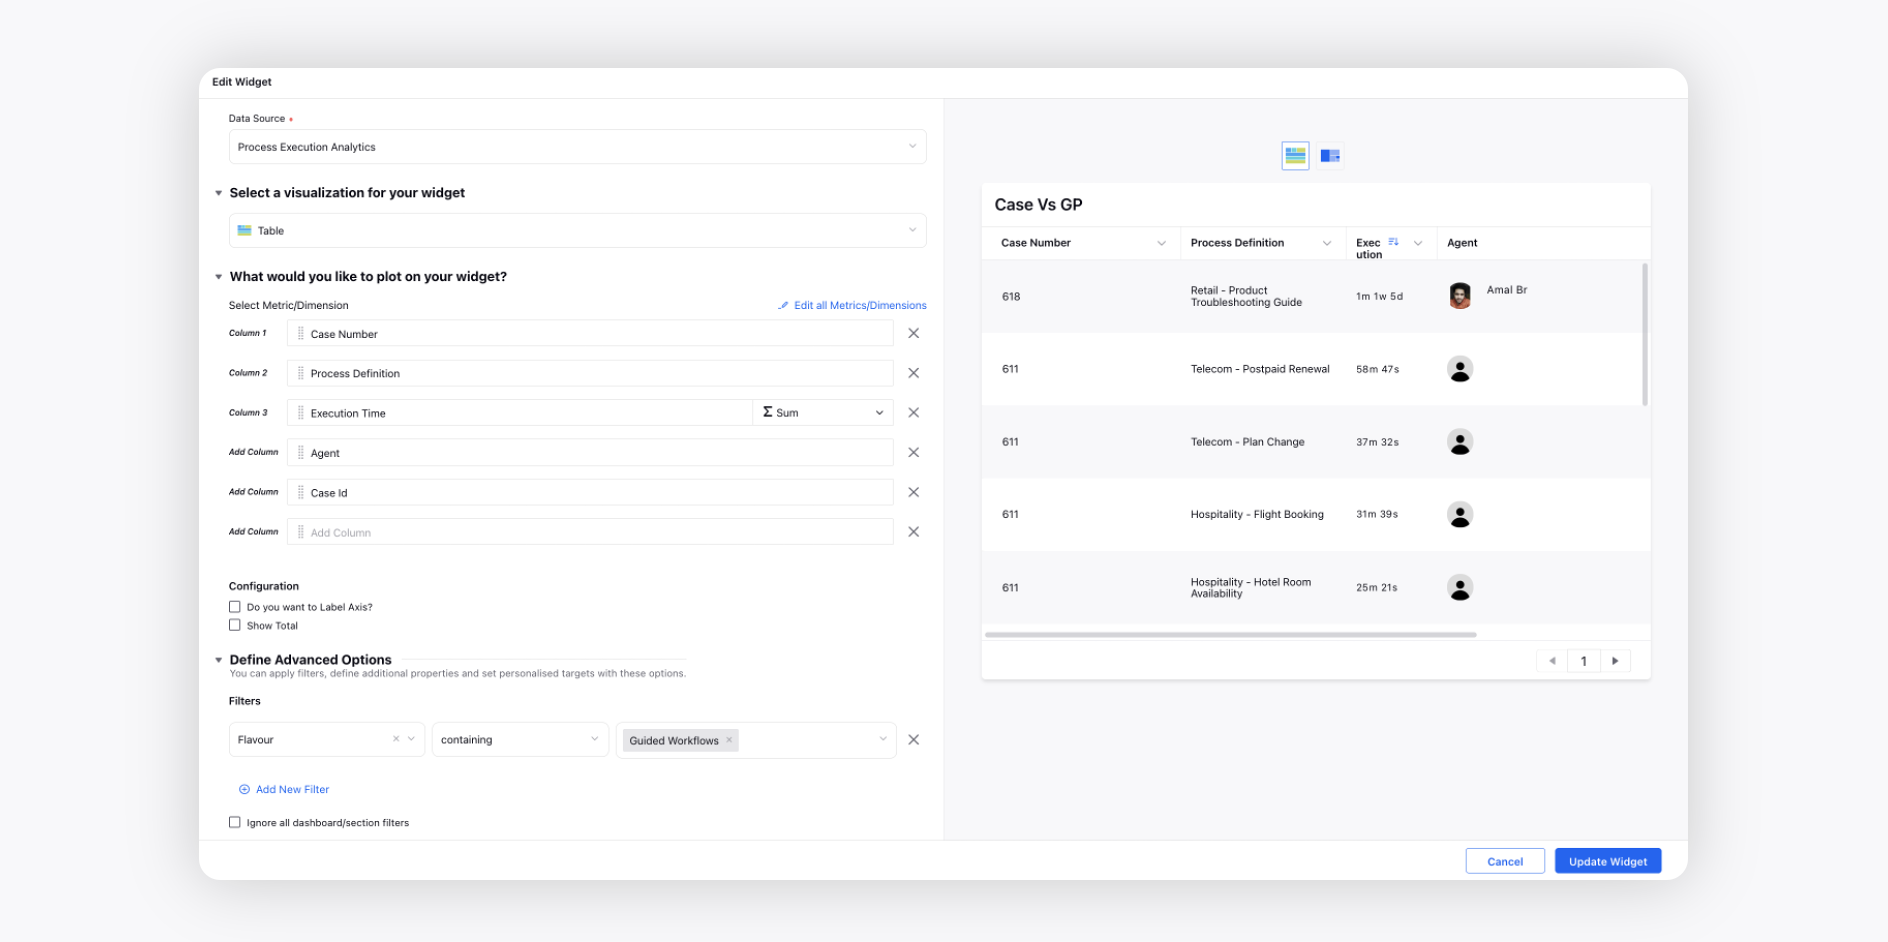
Case Vs GP
Create a Table widget and choose the Data Source as Process Execution Analytics.
Select the Execution Time metric with Case Number, Process Definition, Agent, and Case Id dimensions. Add the Flavour filter as Guided Workflows.
Guided Workflow Summary
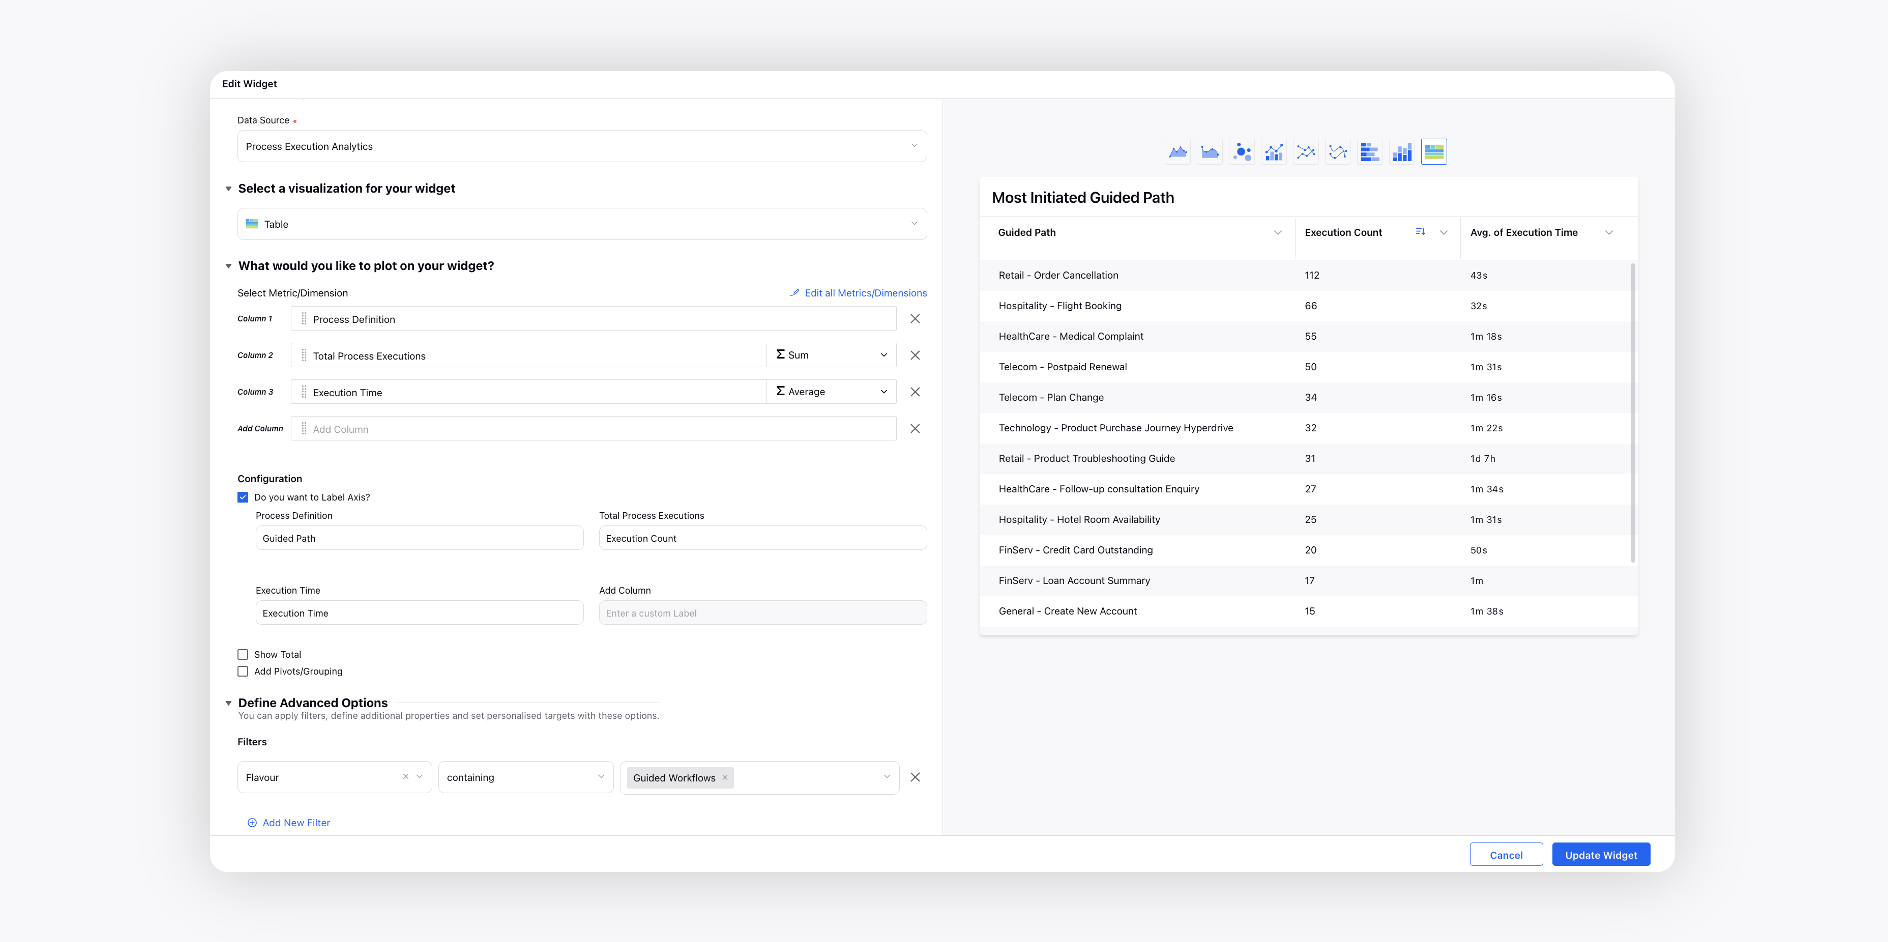
Most Initiated Guided Path
Create a Table widget and choose the Data Source as Process Execution Analytics.
Select the Execution Time and Total Process Executions metrics with Process Definition dimension. Add the Flavour filter as Guided Workflows.
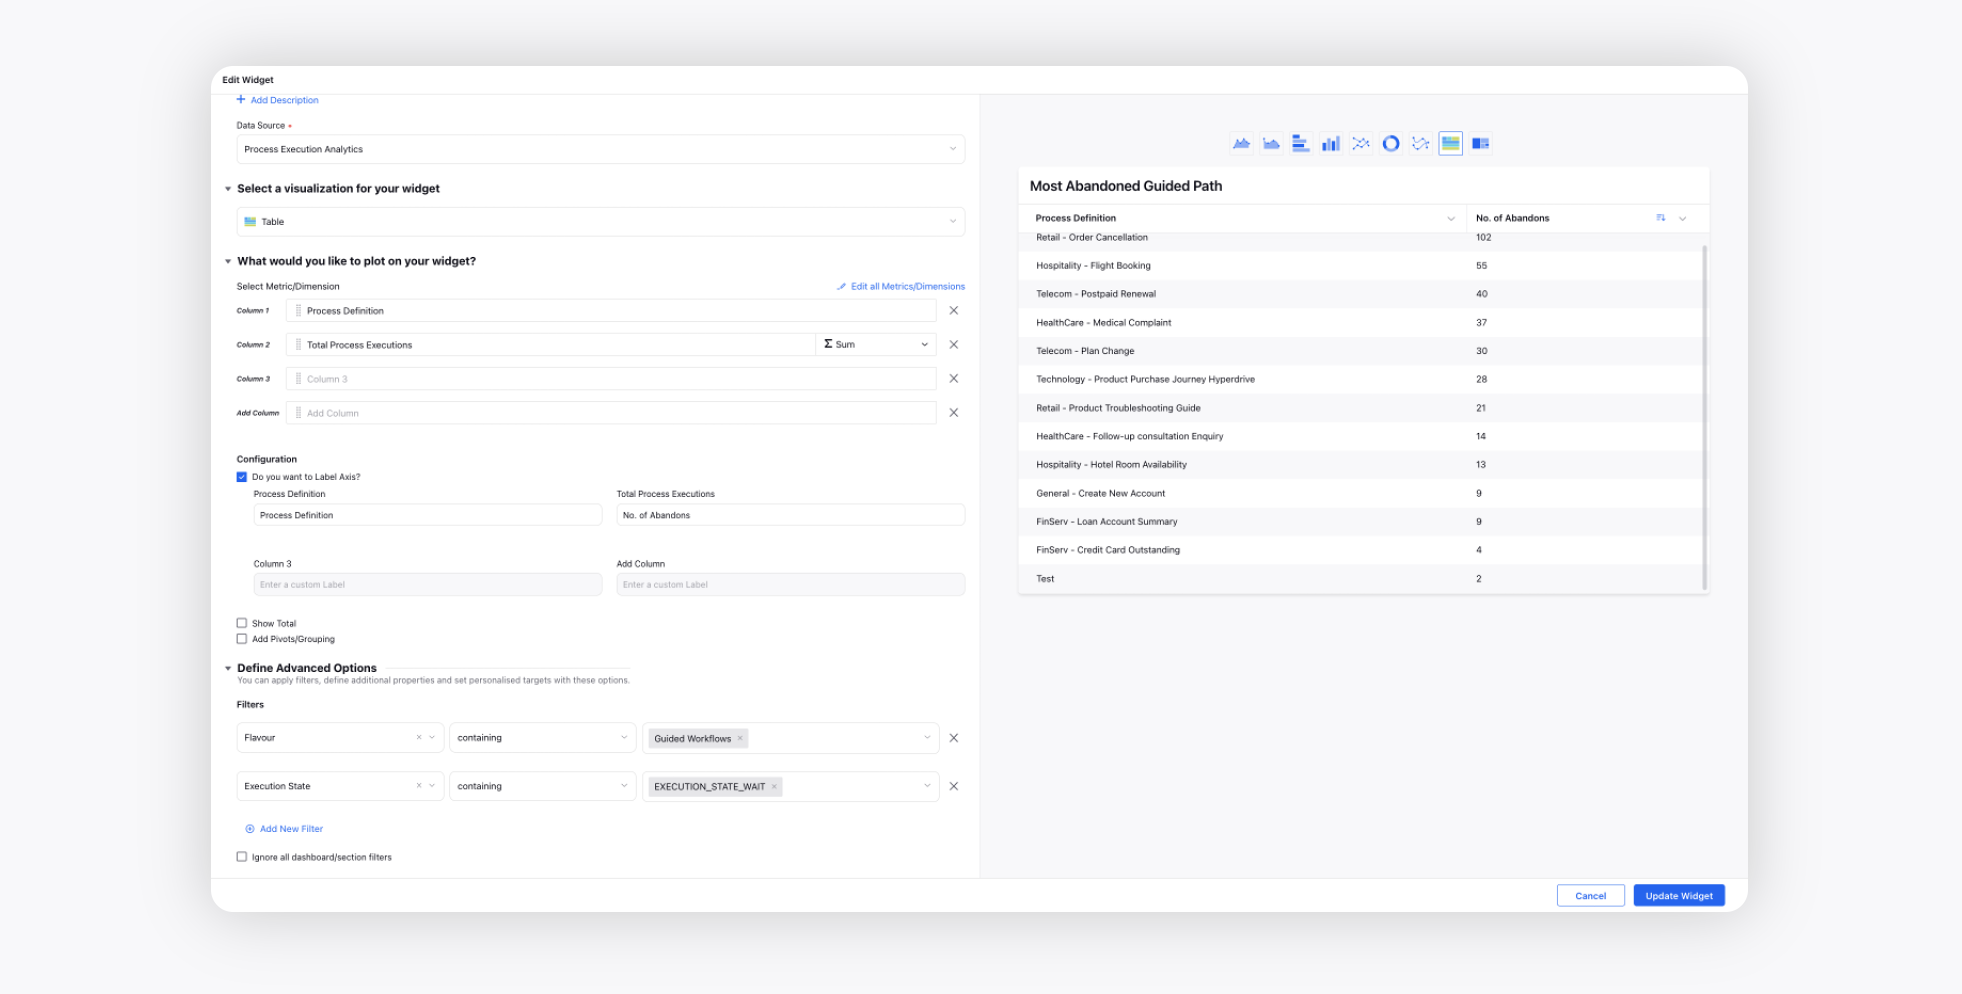
Most Abandoned Guided Path
Create a Table widget and choose the Data Source as Process Execution Analytics.
Select the Total Process Executions metric with Process Definition dimension. Add the Flavour filter as Guided Workflows and Execution State filter as EXECUTION_STATE_WAIT.
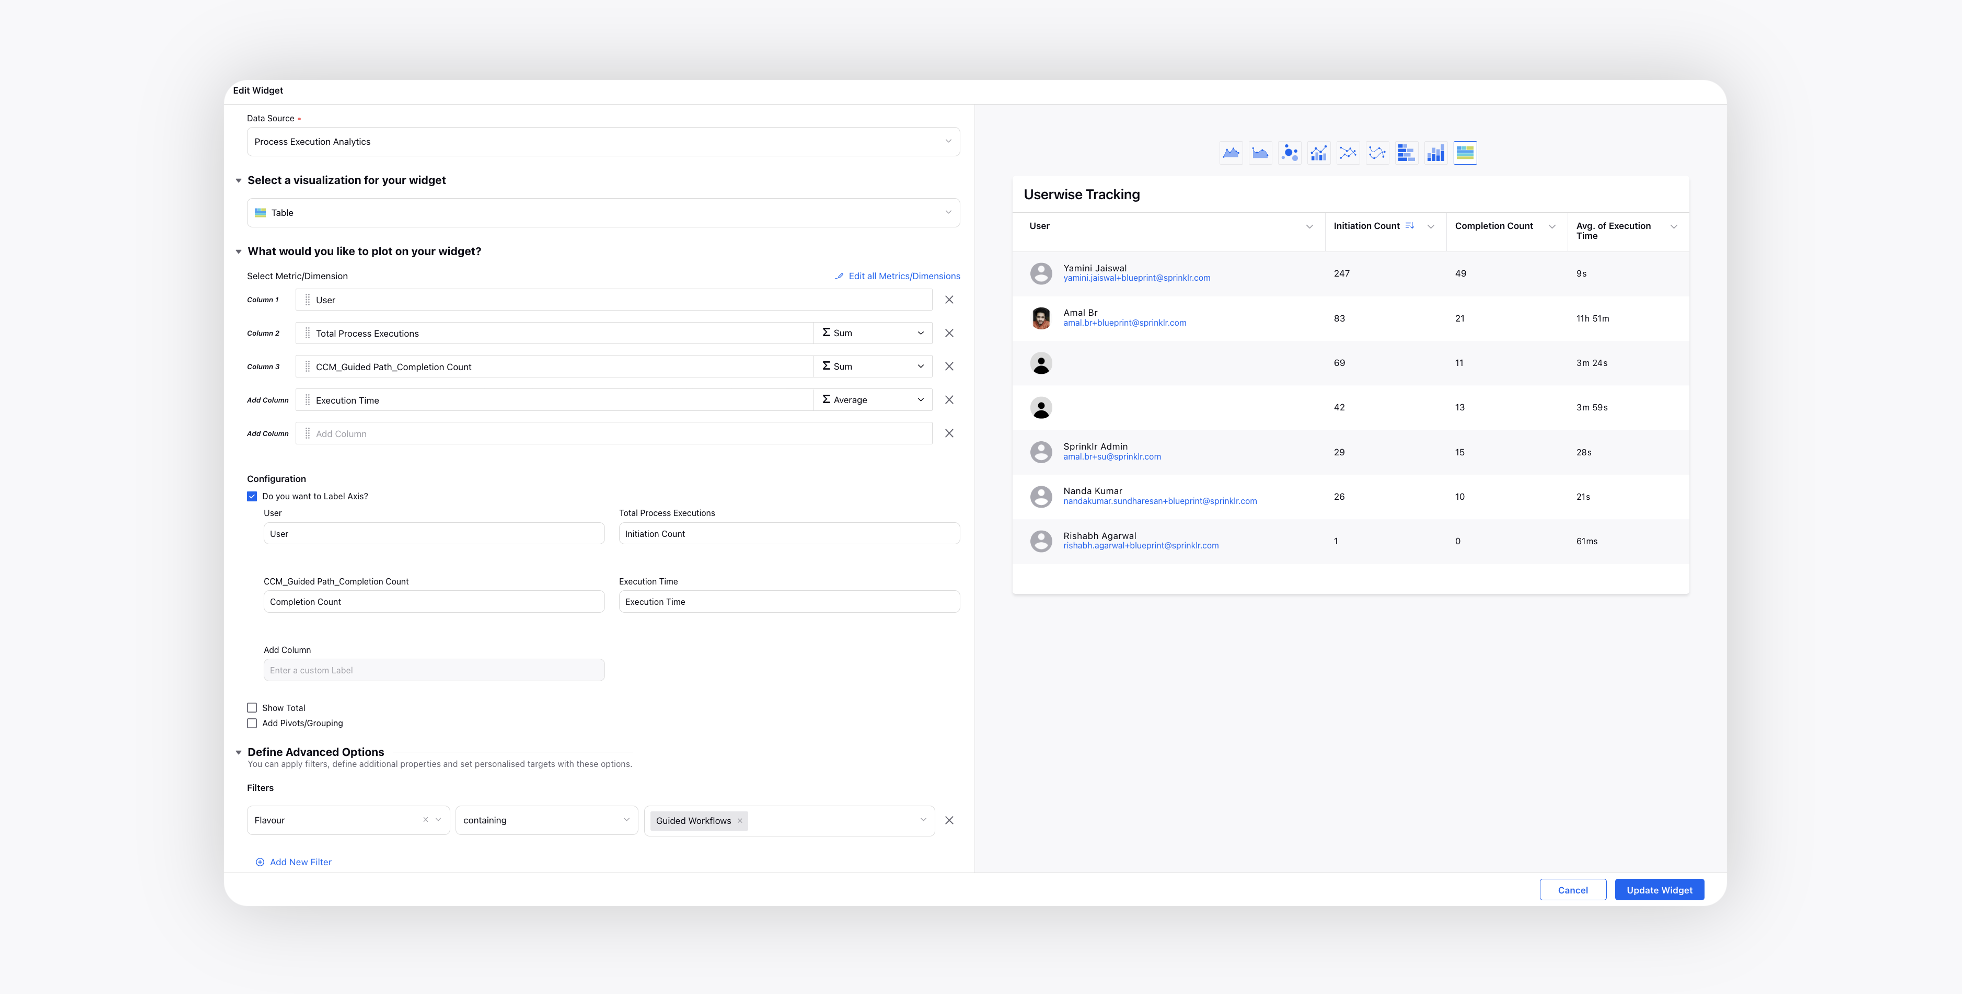
Userwise Tracking
Create a Table widget and choose the Data Source as Process Execution Analytics.
Select the Total Process Executions, CCM_Guided Path_Completion Count, Execution Time metrics with User dimension. Add the Flavour filter as Guided Workflows.
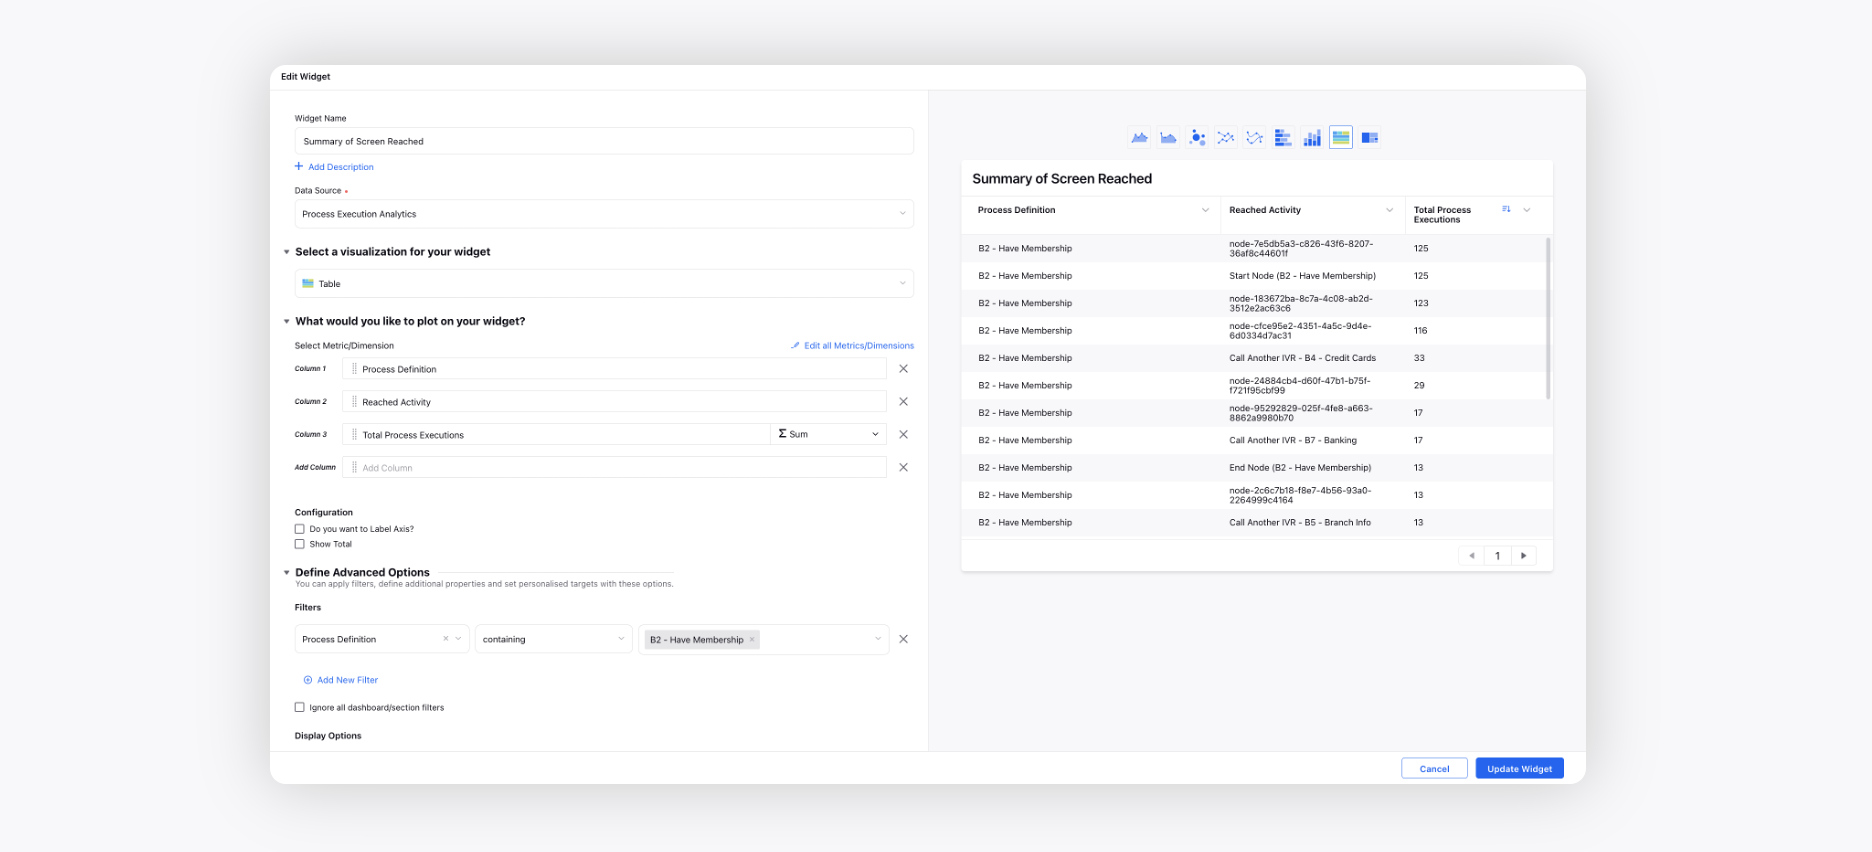
Summary of Screen Reached
Create a Table widget and choose the Data Source as Process Execution Analytics.
Select the Total Process Executions metric with Process Definition and Reached Activity dimensions. Add the Process Definition filter as B2 - Have Membership.
Guided Workflow Trend
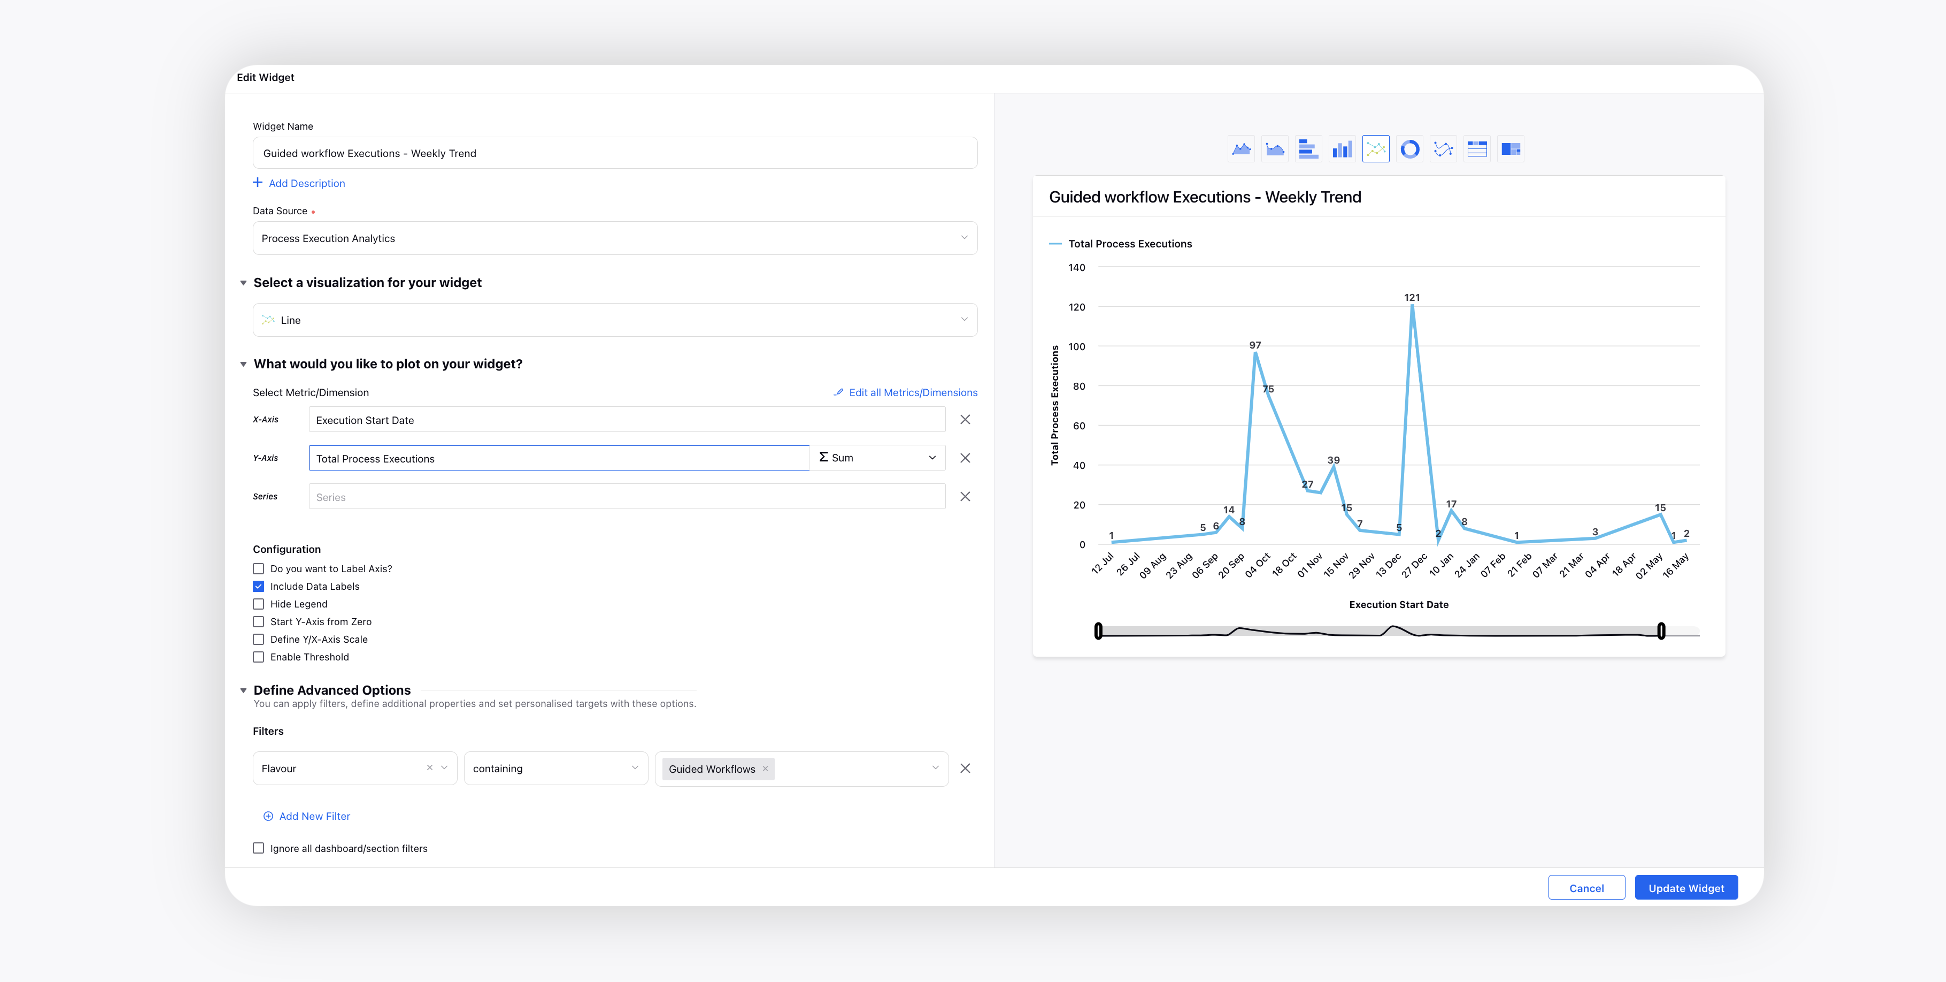
Guided Workflow Executions - Weekly Trend
Create a Line widget and choose the Data Source as Process Execution Analytics.
Select the Total Process Executions metric with Execution Start Date dimension. Add the Flavour filter as Guided Workflows.
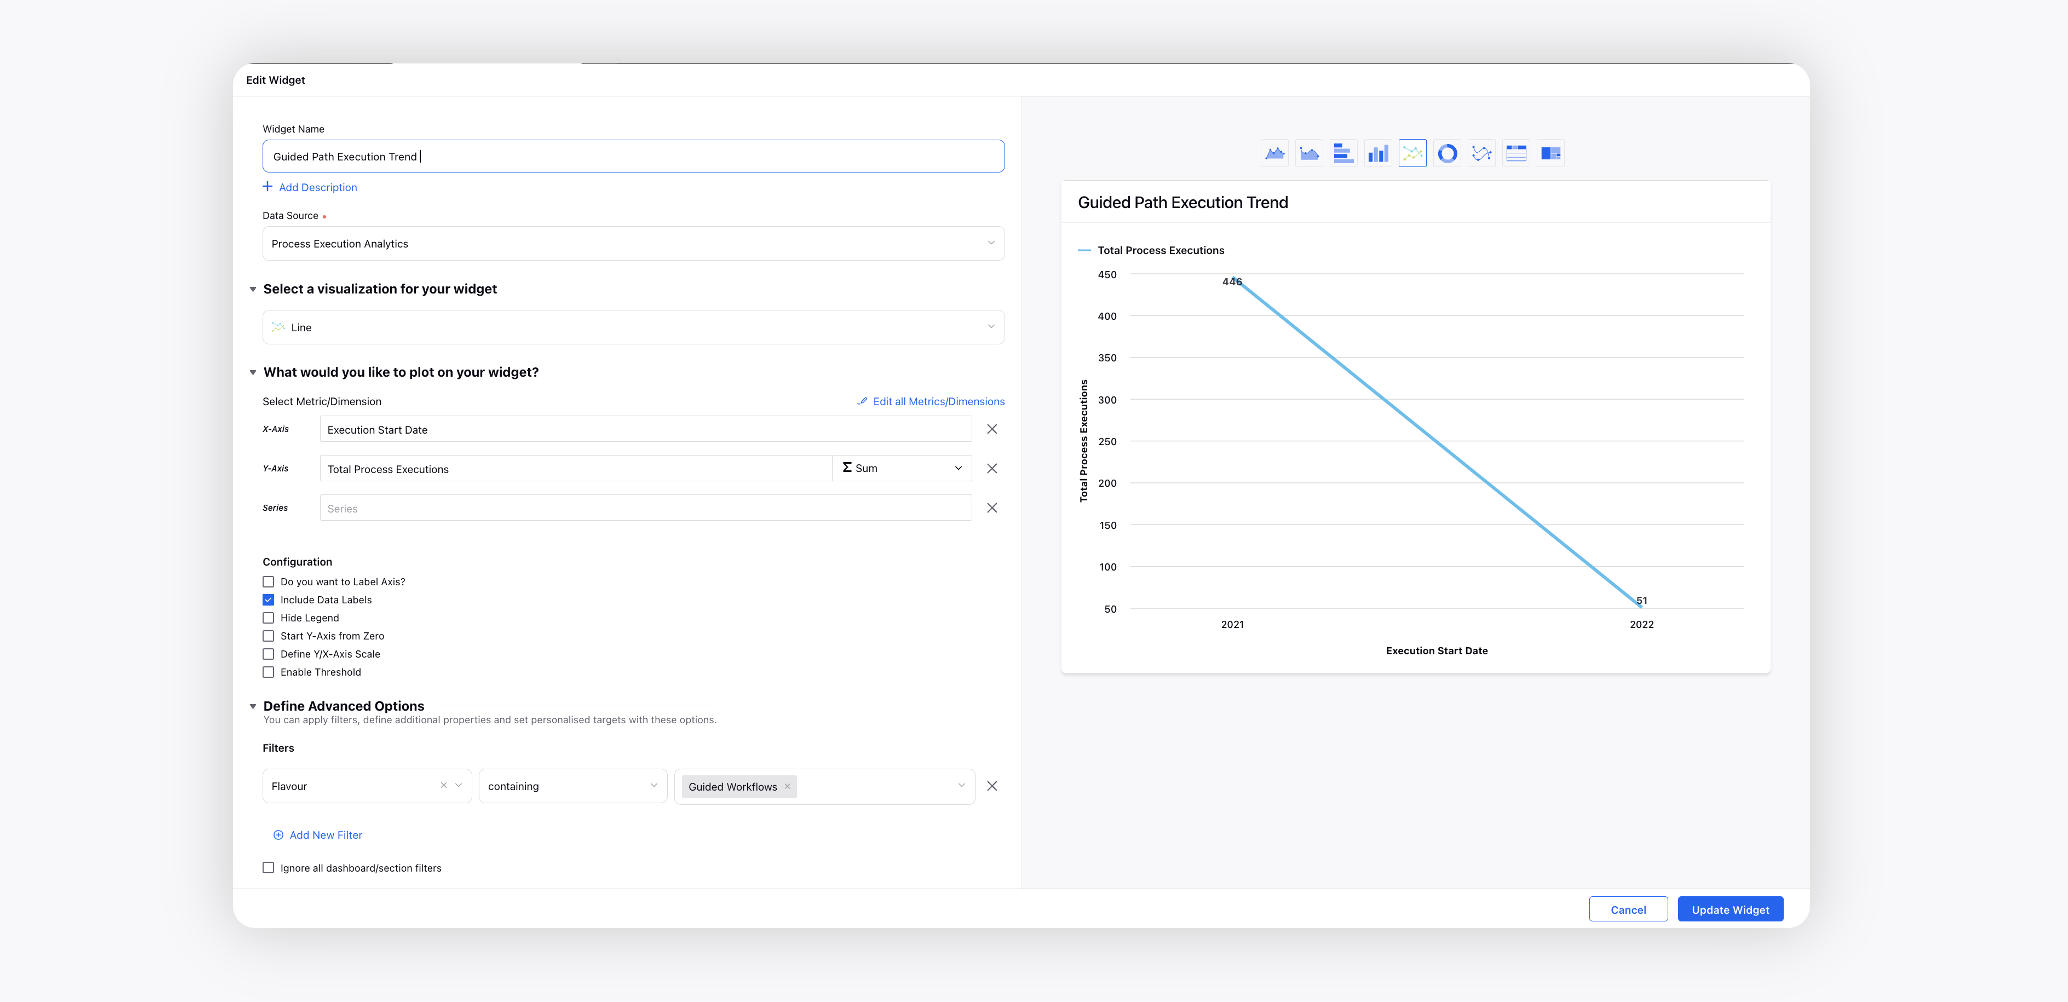
Guided Path Execution Trend
Create a Line widget and choose the Data Source as Process Execution Analytics.
Select the Total Process Executions metric with Execution Start Date dimension. Add the Flavour filter as Guided Workflows.
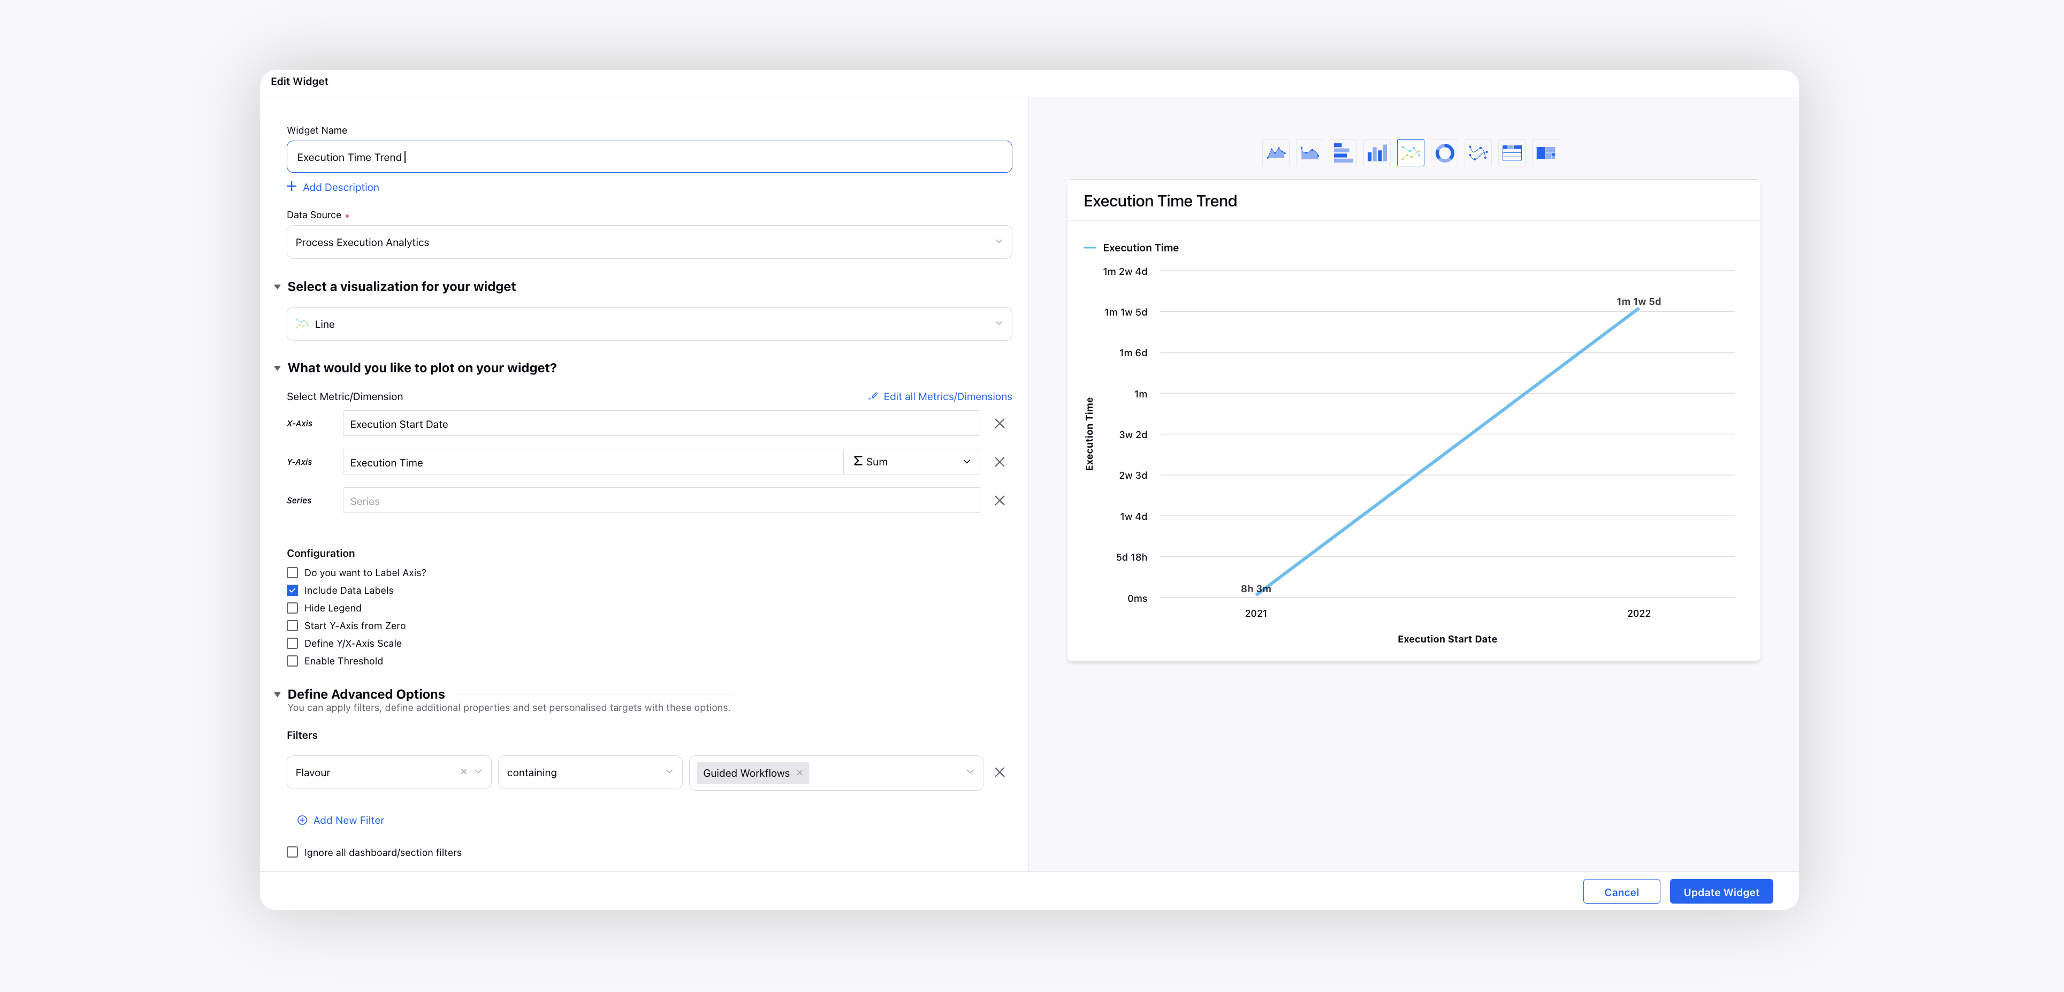
Execution Time Trend
Create a Line widget and choose the Data Source as Process Execution Analytics.
Select the Execution Time metric with Execution Start Date dimension. Add the Flavour filter as Guided Workflows.