Reporting on QM
Updated
The standard Quality Management reporting dashboard displays a range of relevant Quality metrics and KPIs that allow Quality managers and supervisors to look at agent quality performance and extract post-call data in order to train the agents better.
Standard Quality Management Widgets
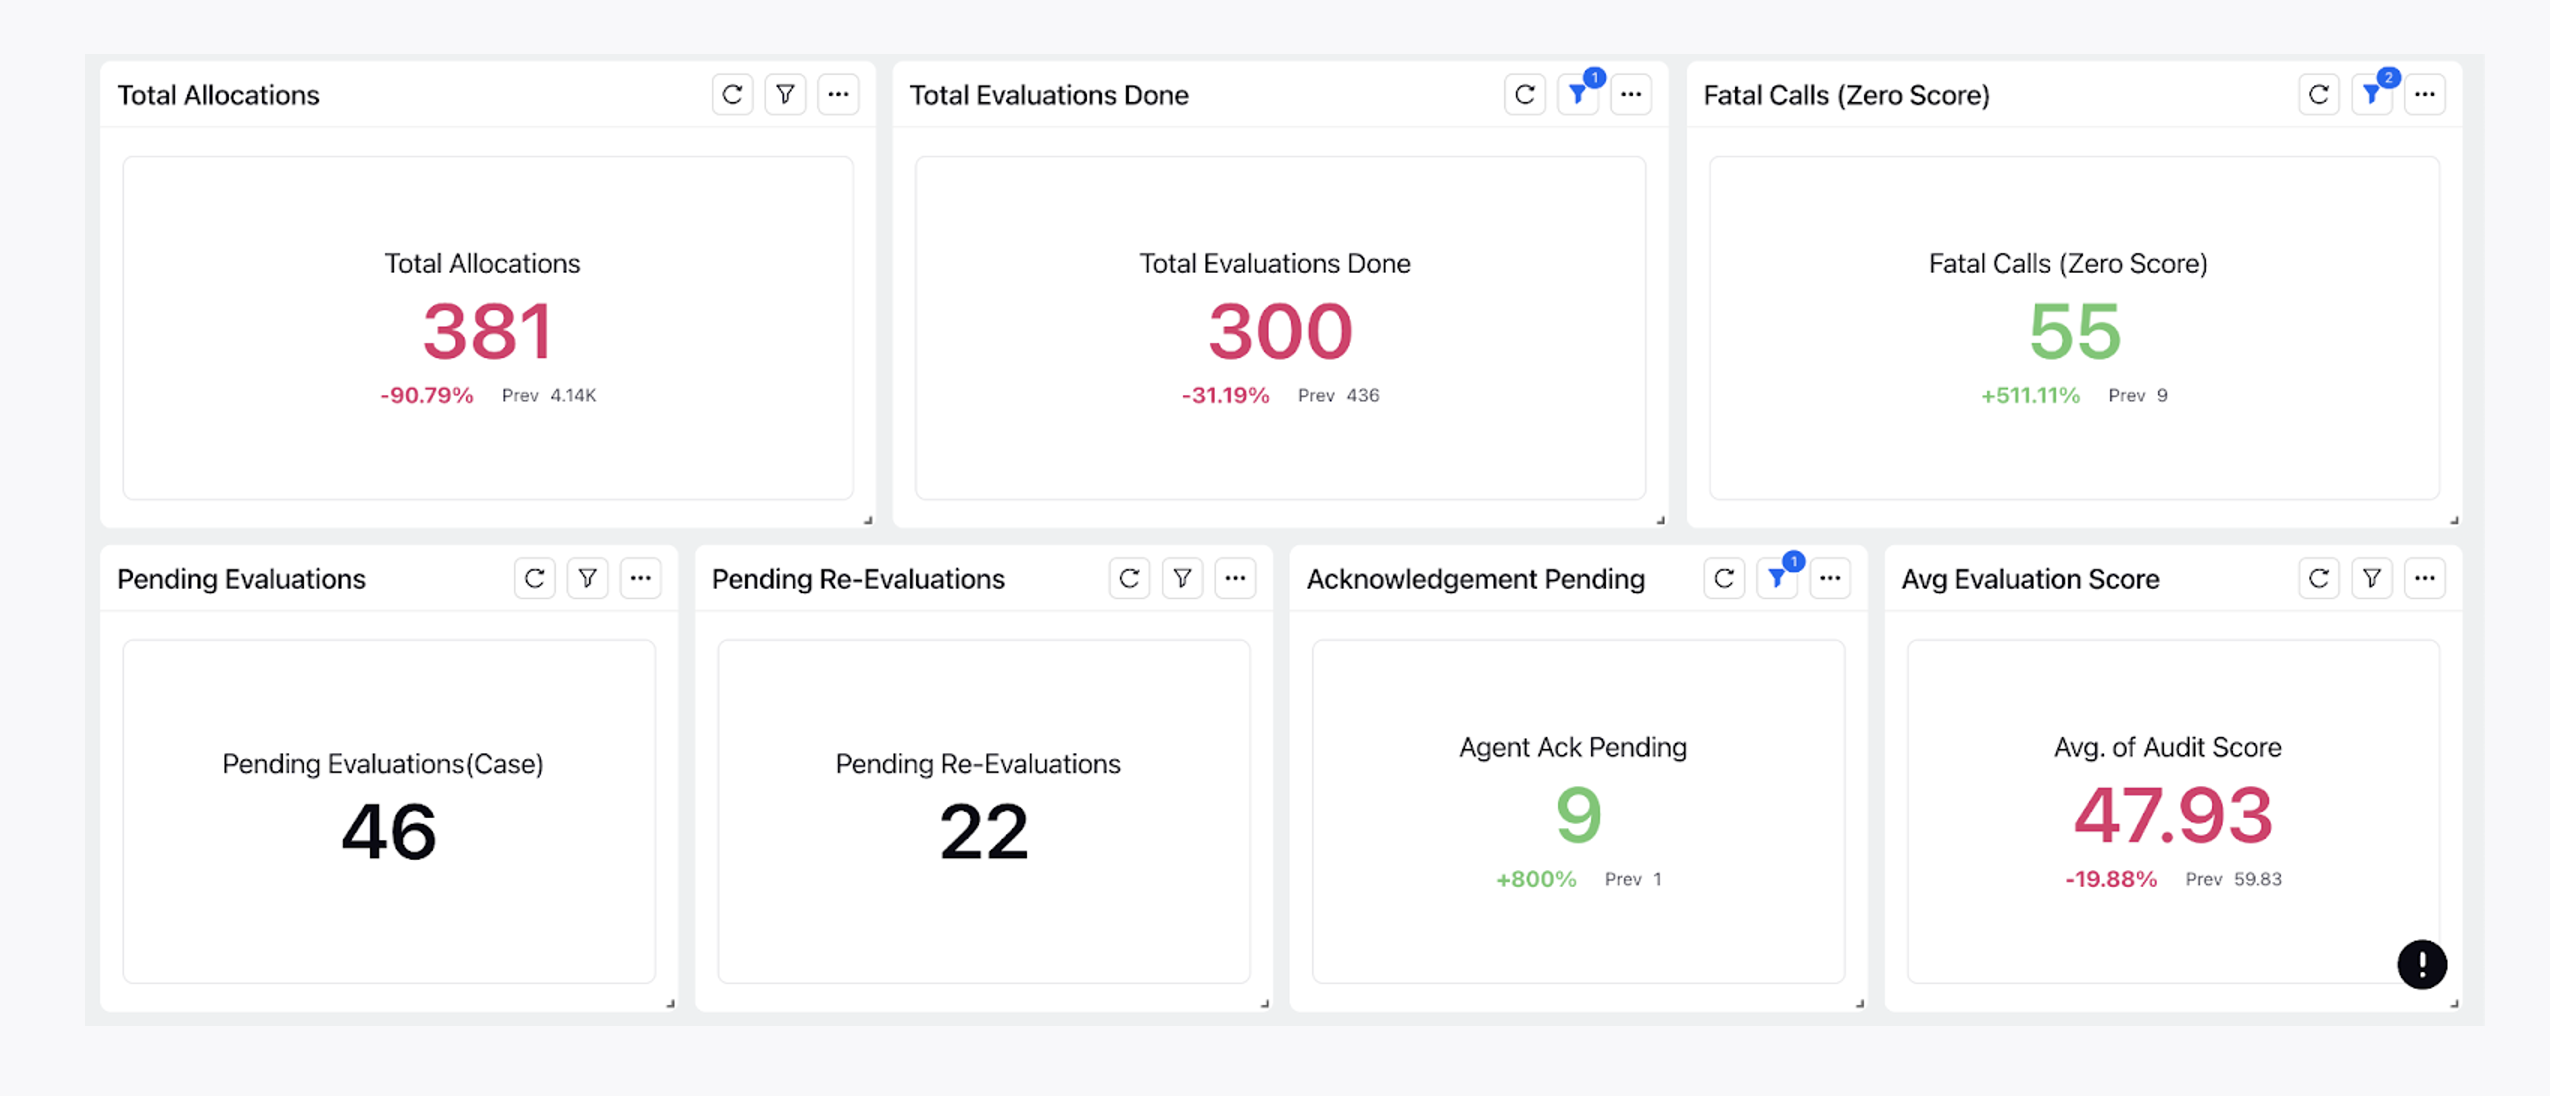
Top QM Metrics
Widget Name | Metric Name | Filters Applied |
Total Allocations | Total Manual Evaluations | _ |
Total Evaluations Done | Total Manual Evaluations | Audit Status = Completed, Re-Evaluated, Agent Ack. Pending |
Fatal Calls | Total Manual Evaluations | Evaluation Score = 0 |
Pending Evaluations | Pending Evaluations(case) | _ |
Pending Re-Evaluations | Pending Re-Evaluations | _ |
Avg. Evaluation Score | Evaluation Score | _ |
Avg. Evaluation Time | Evaluation Time | _ |
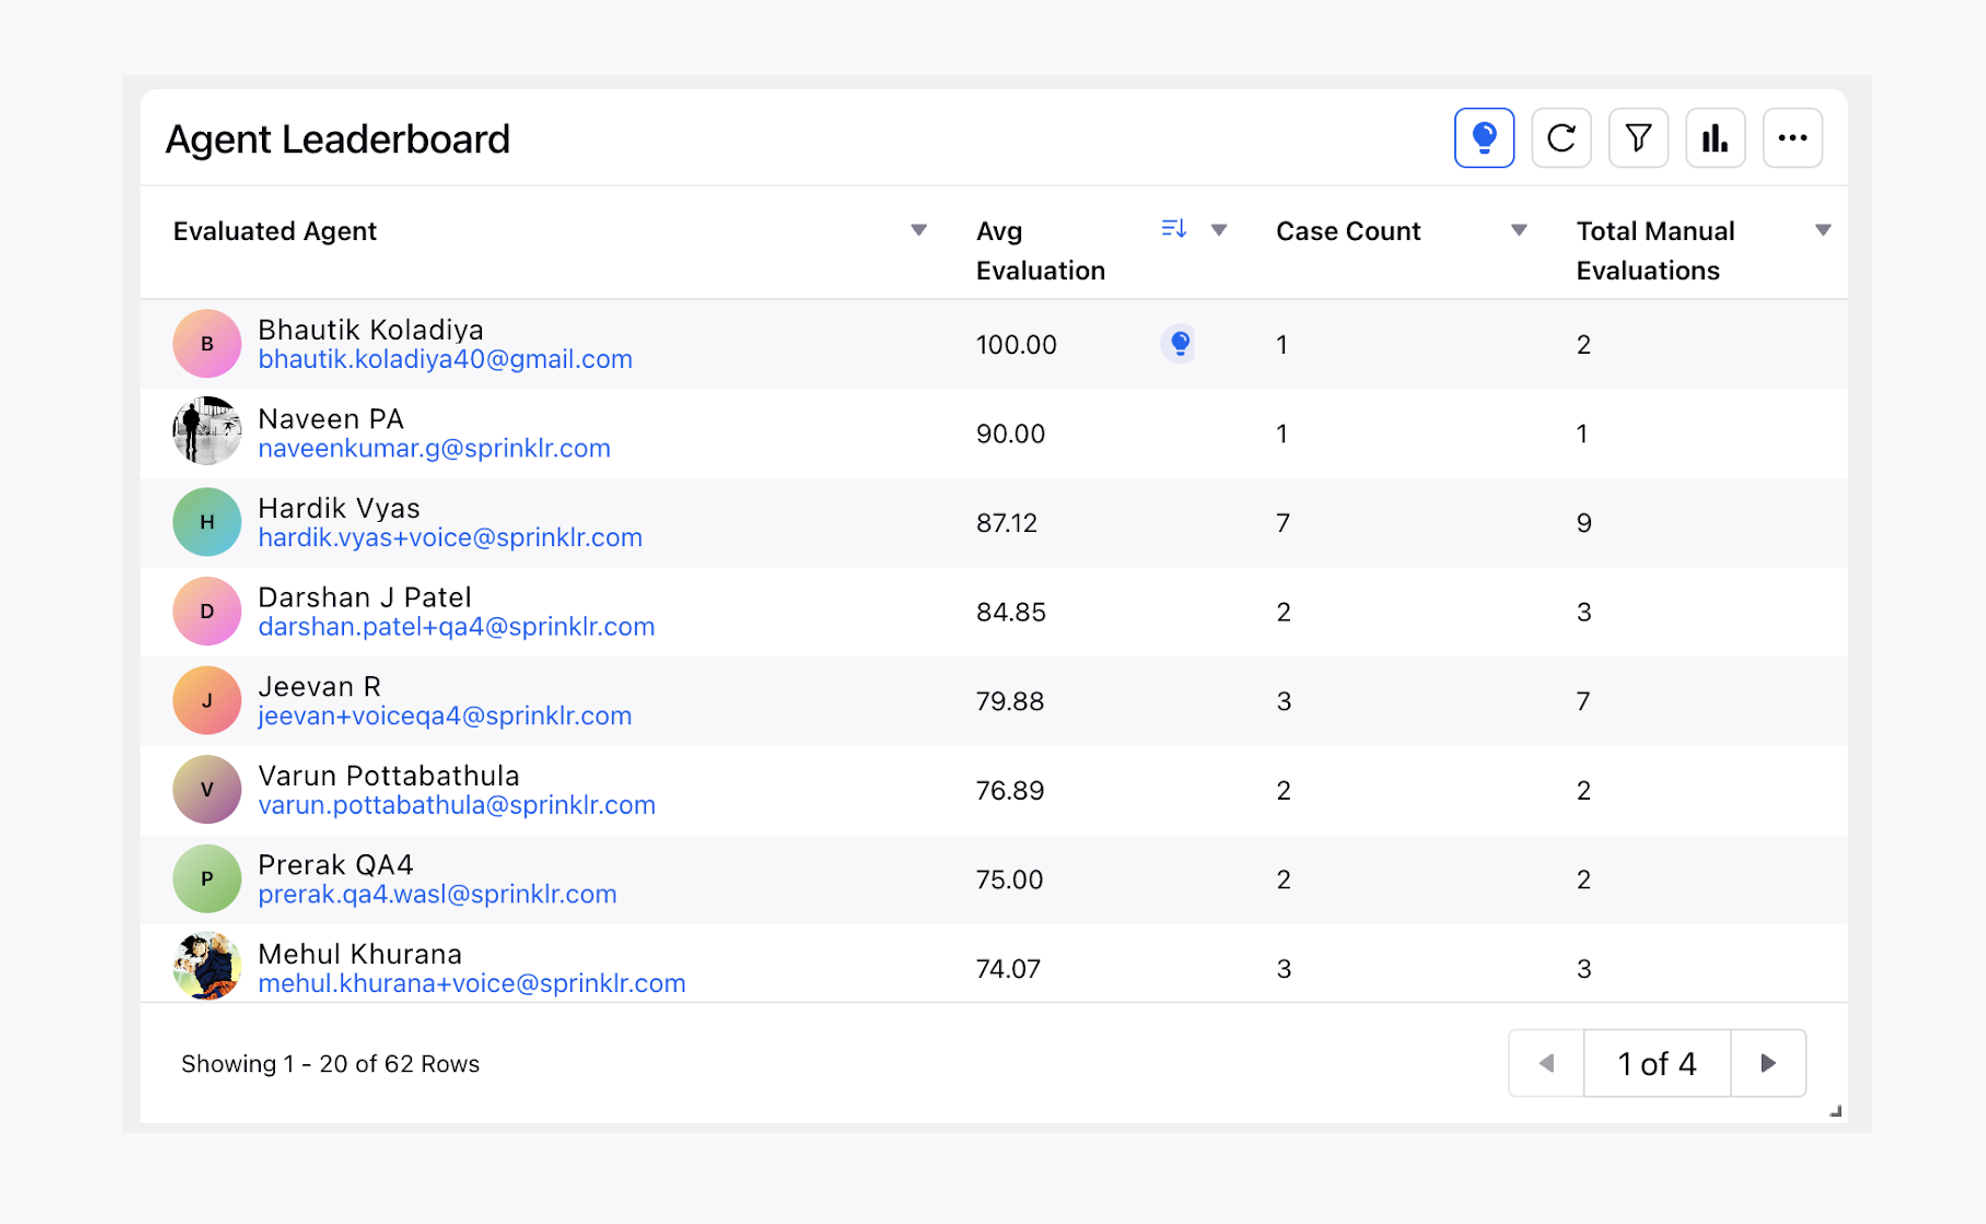
Agent Leaderboard
Agent Leaderboard can help us to identify who are my top performing agents. We can filter out based on the Evaluation Score if we want to consider agents falling in the low score bucket.
Metric Name |
Evaluated Agent |
Evaluation Score |
Case Count |
Total Manual Evaluations |
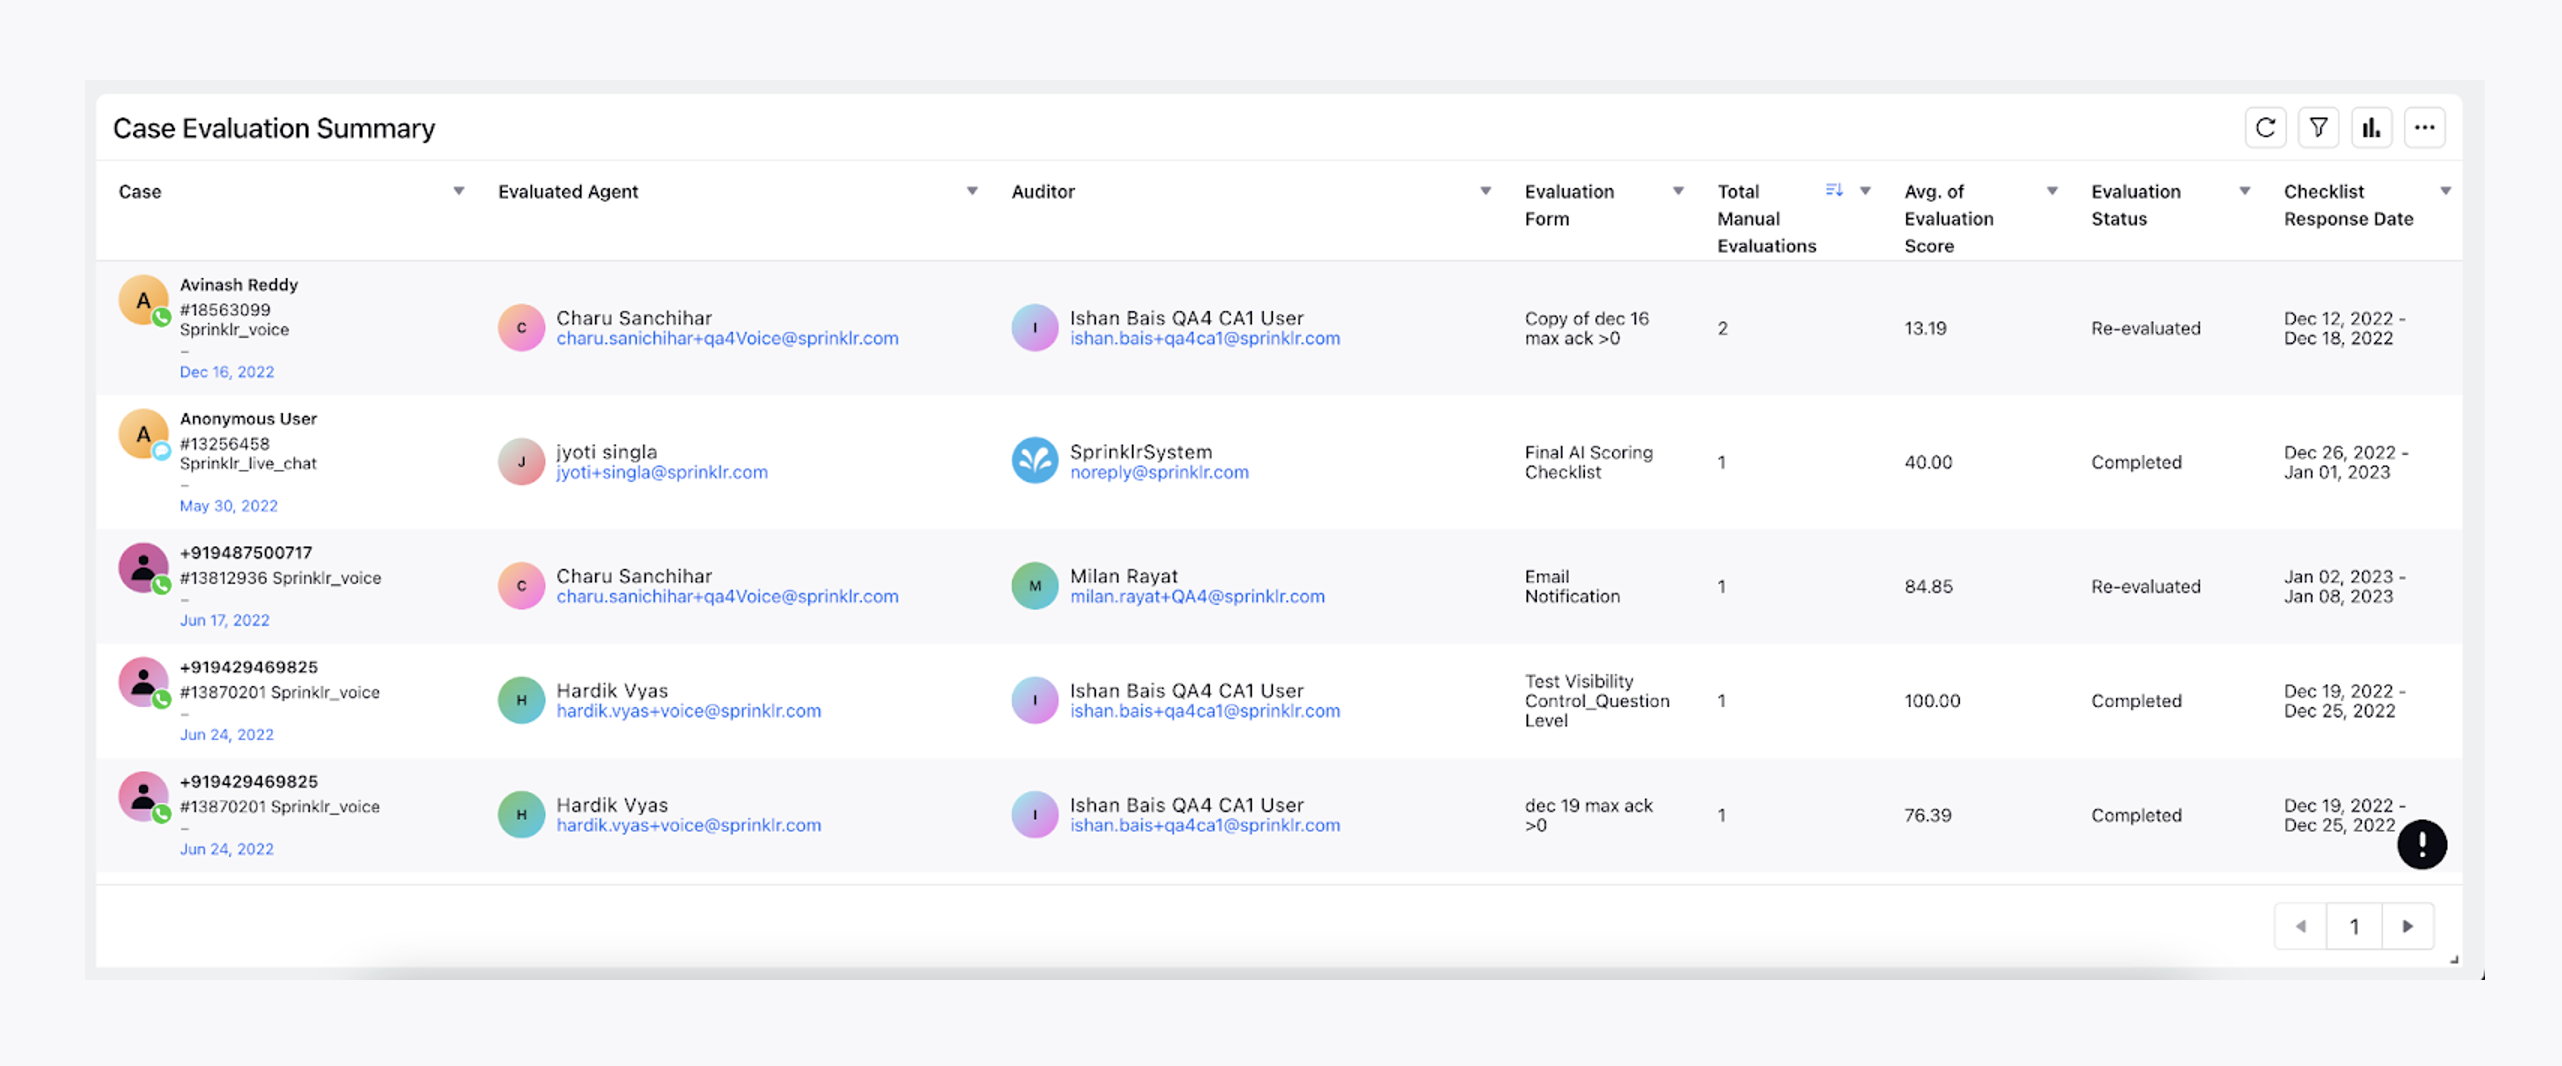
Case Evaluations Summary
This is a high level summary for the audit evaluations. Using this only Zero Scoring cases summary can be made by applying a Filter of Evaluation Score = 0.
Column Name | Metric Name |
Case | Case |
Evaluated Agent | For User |
Auditor | User |
Evaluation Form | Checklist |
Total Manual Evaluations | Checklist Response Count |
Evaluation Status | Audit Status |
Checklist Response Date | Checklist Response Date |
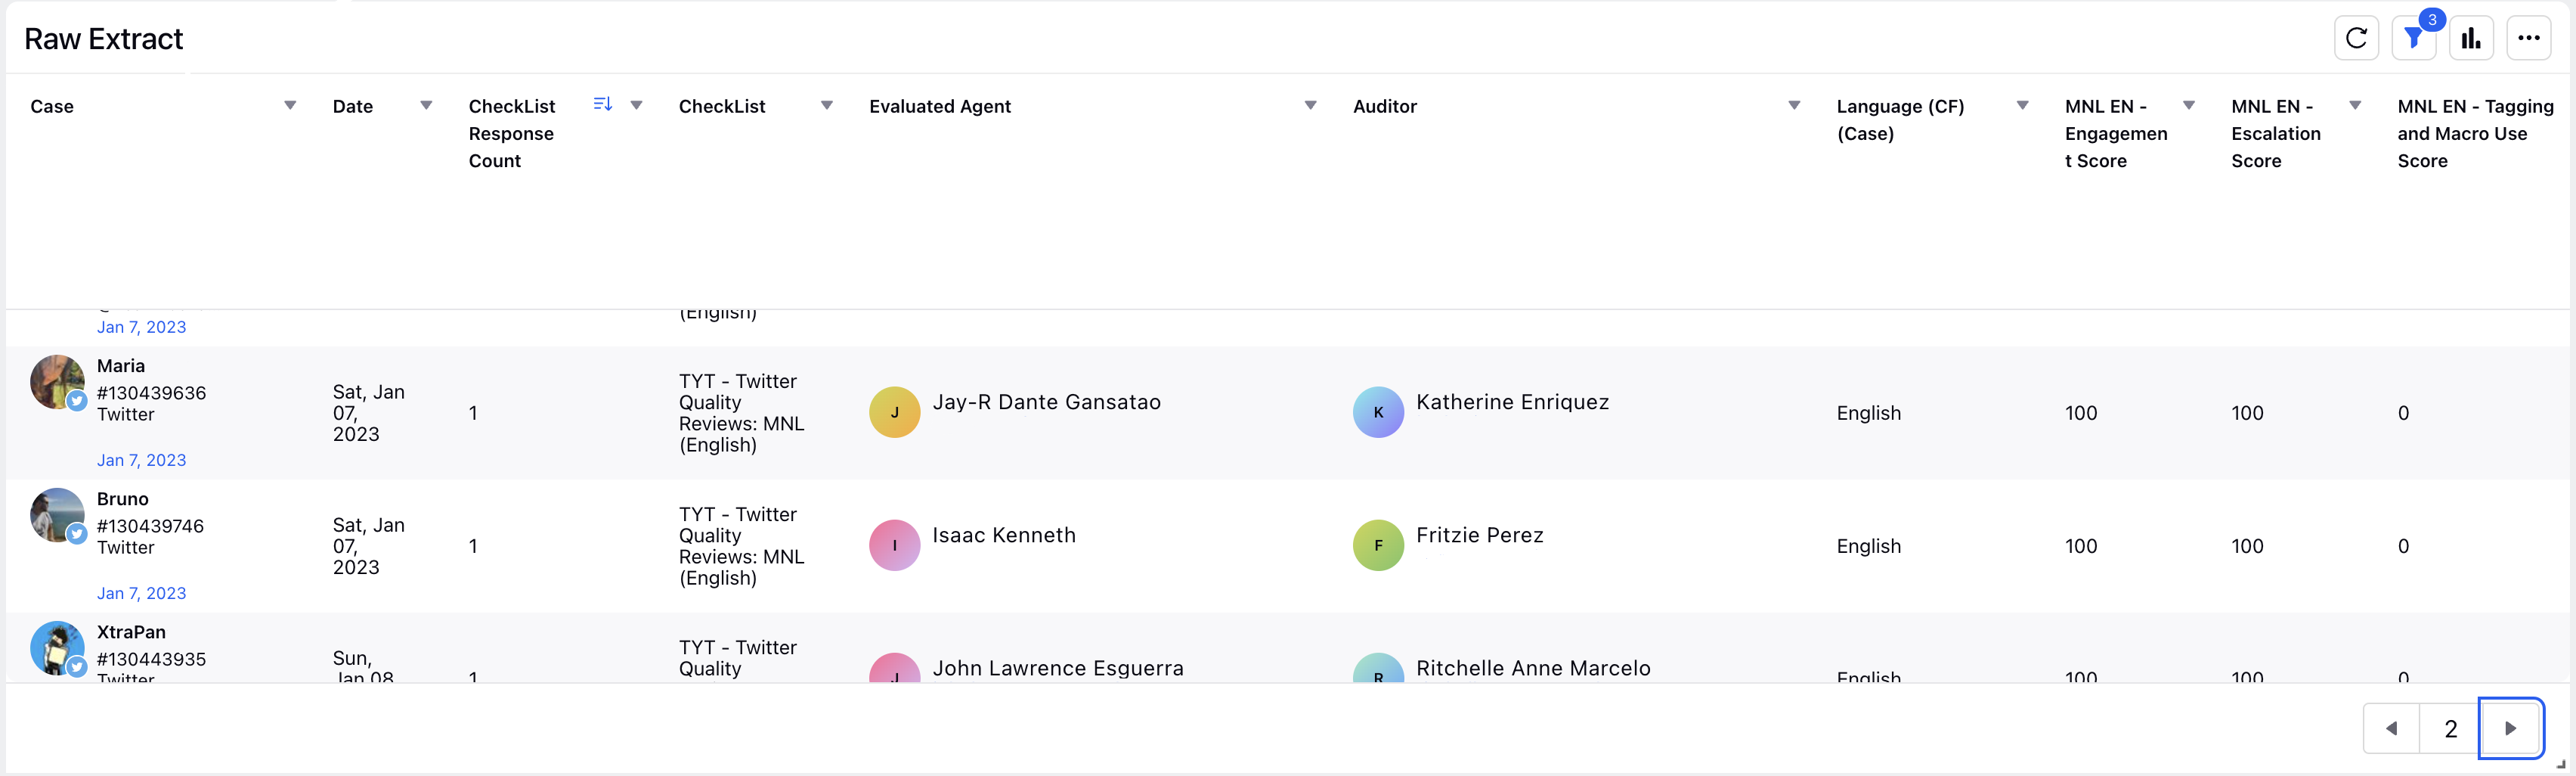
Raw Extract Dump
This is the dump of all the evaluations done on the tool. Here all the case level fields along with individual parameter reporting can be viewed.
Here are some standard metrics that are used.
Column Name | Metric Name |
Case | Case |
Date | Checklist Response Date |
Auditor | User |
Checklist | Checklist |
Evaluated Agent | Evaluated Agent |
Auditor | Auditor |
Checklist Response Count | Checklist Response Count |
Language(CF) | Case Level Custom Fields |
MNL EN - 1. Followed Engagement guidelines Score | Checklist Parameter “MNL EN - 1. Followed Engagement guidelines” Score |
Similar to Checklist Parameter Score individual Responses can also be plotted using the metric <Checklist_Parameter_Name>.
Using this only Zero Scoring cases Raw extract summary can be made by applying a Filter of Evaluation Score = 0.
Zero Call Summary
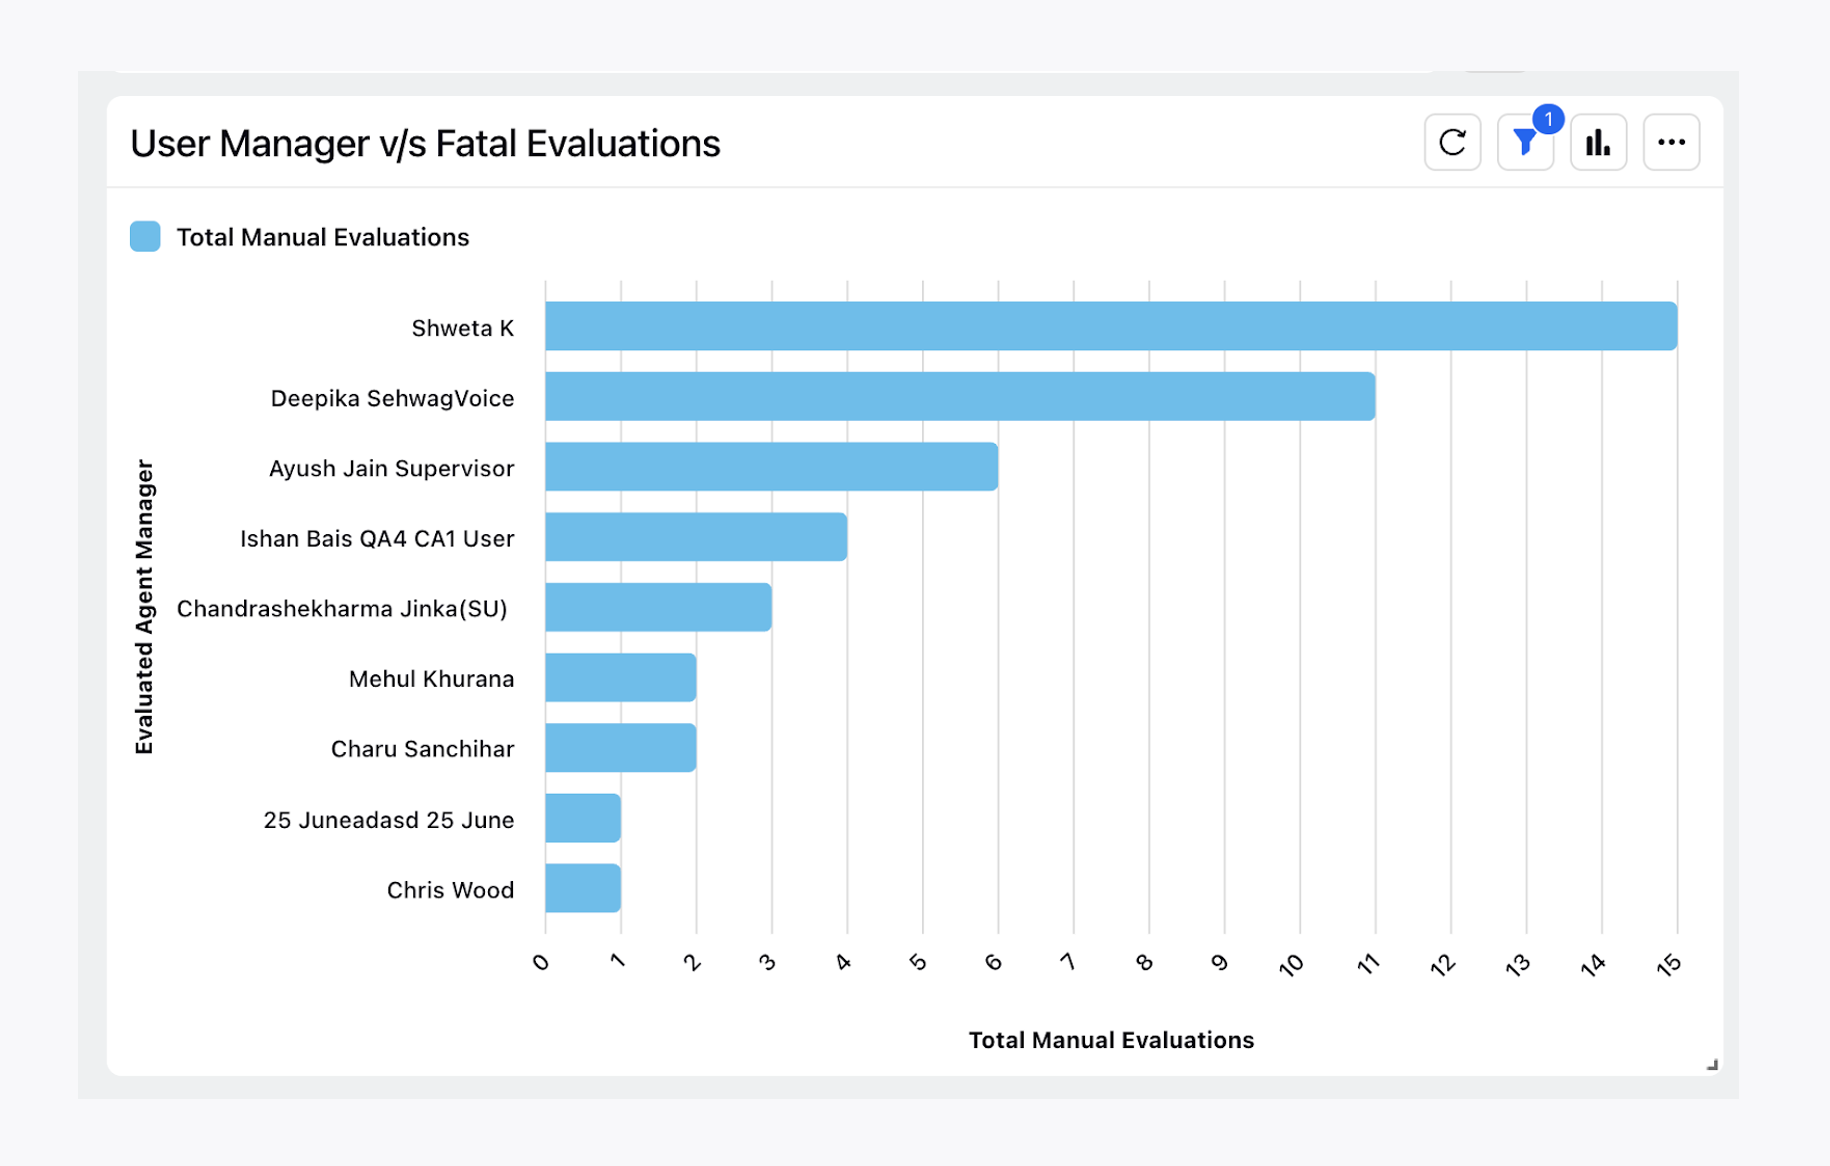
Fatal Cases at a Manager Level
This can be used to analyze the agents under which managers are performing very badly.
X-Axis = Total Manual Evaluations
Y-Axis = Evaluated Agent Manager
Just like this Fatal Cases can be identified at the auditor level also.
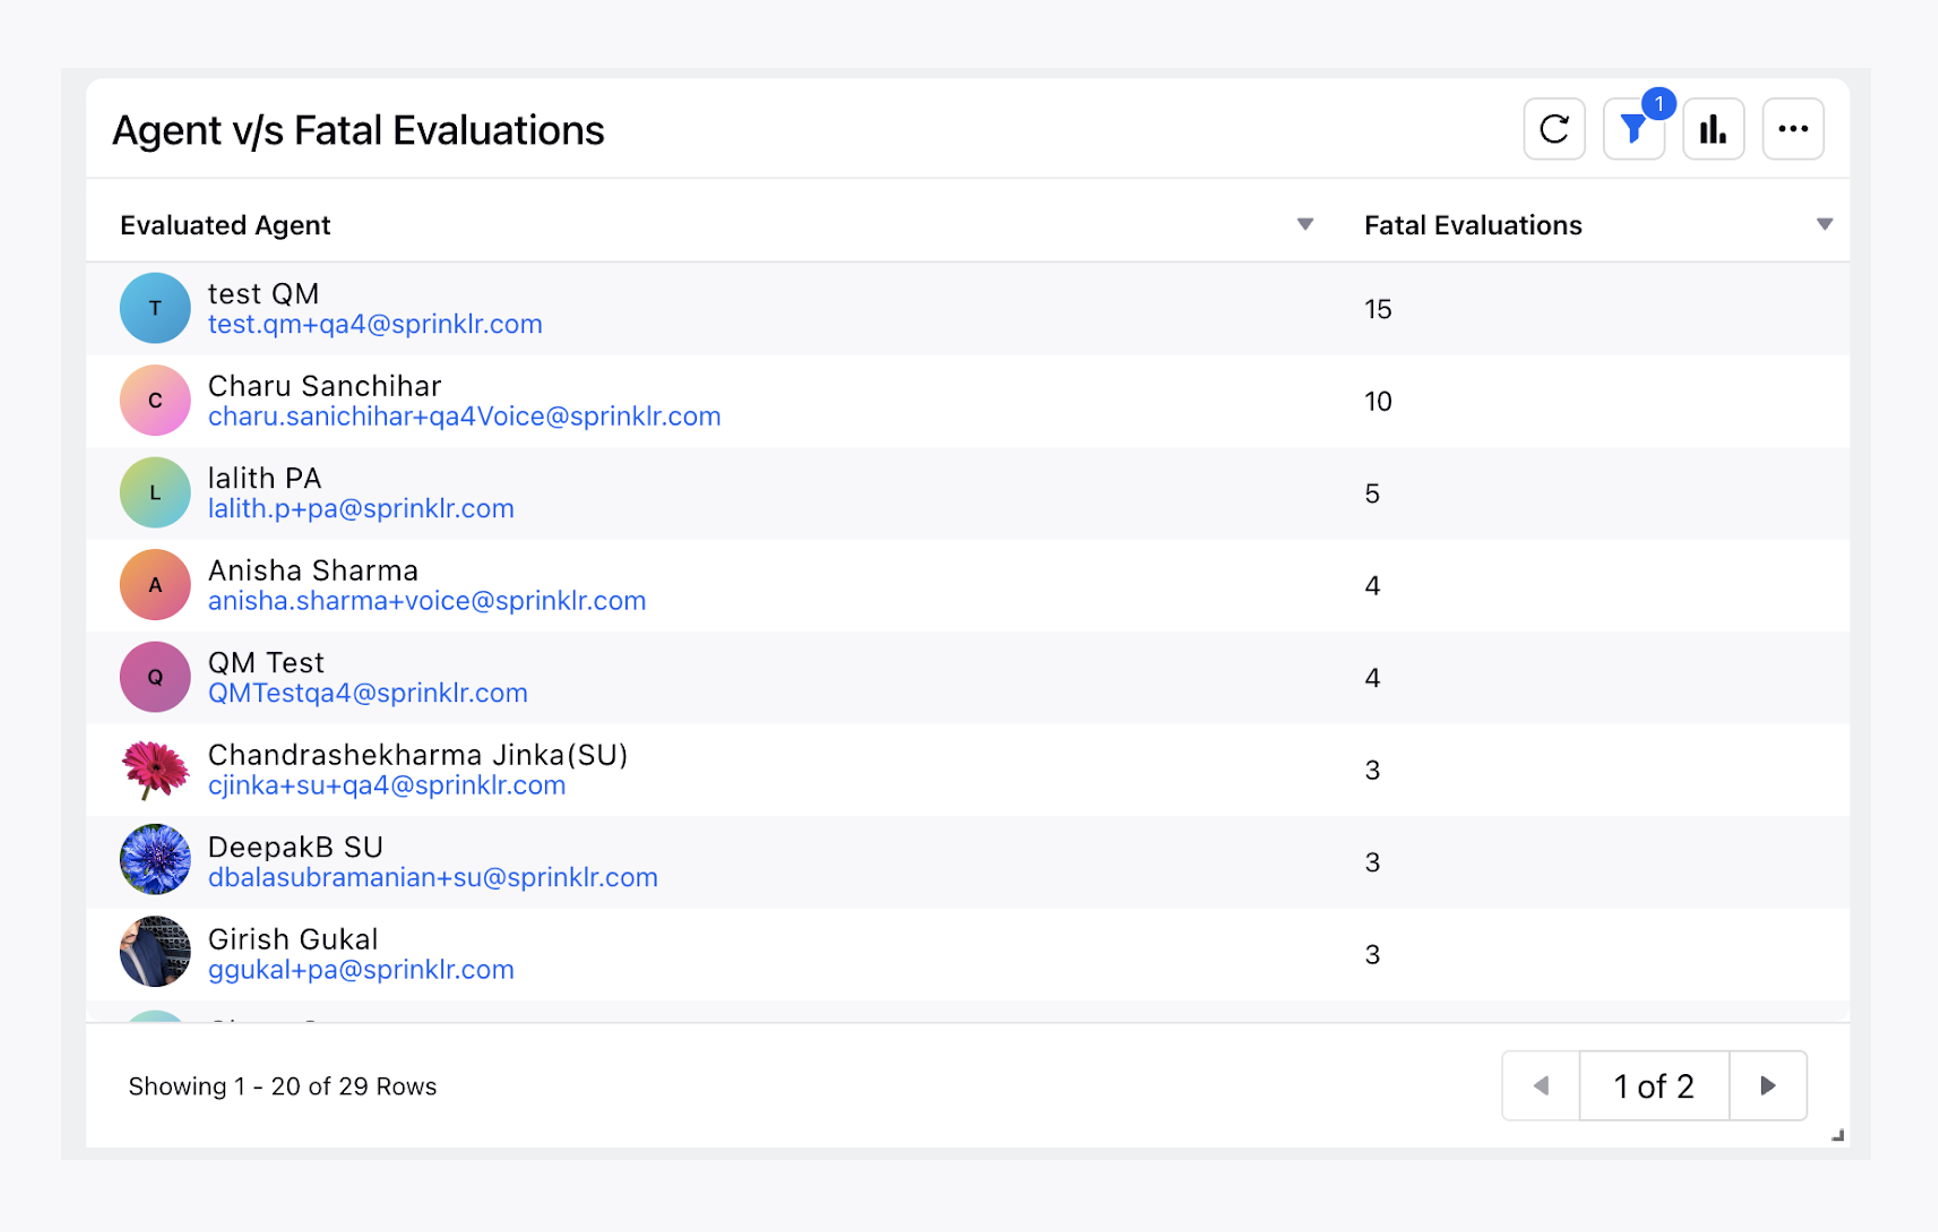
Zero Calls at Agent Level
To get insights on which agents are performing very badly.
Column Name | Metric Name | Filters |
Evaluated Agent | Evaluated Agent | _ |
Fatal Evaluations | Total Manual Evaluations | Evaluation Score = 0 |
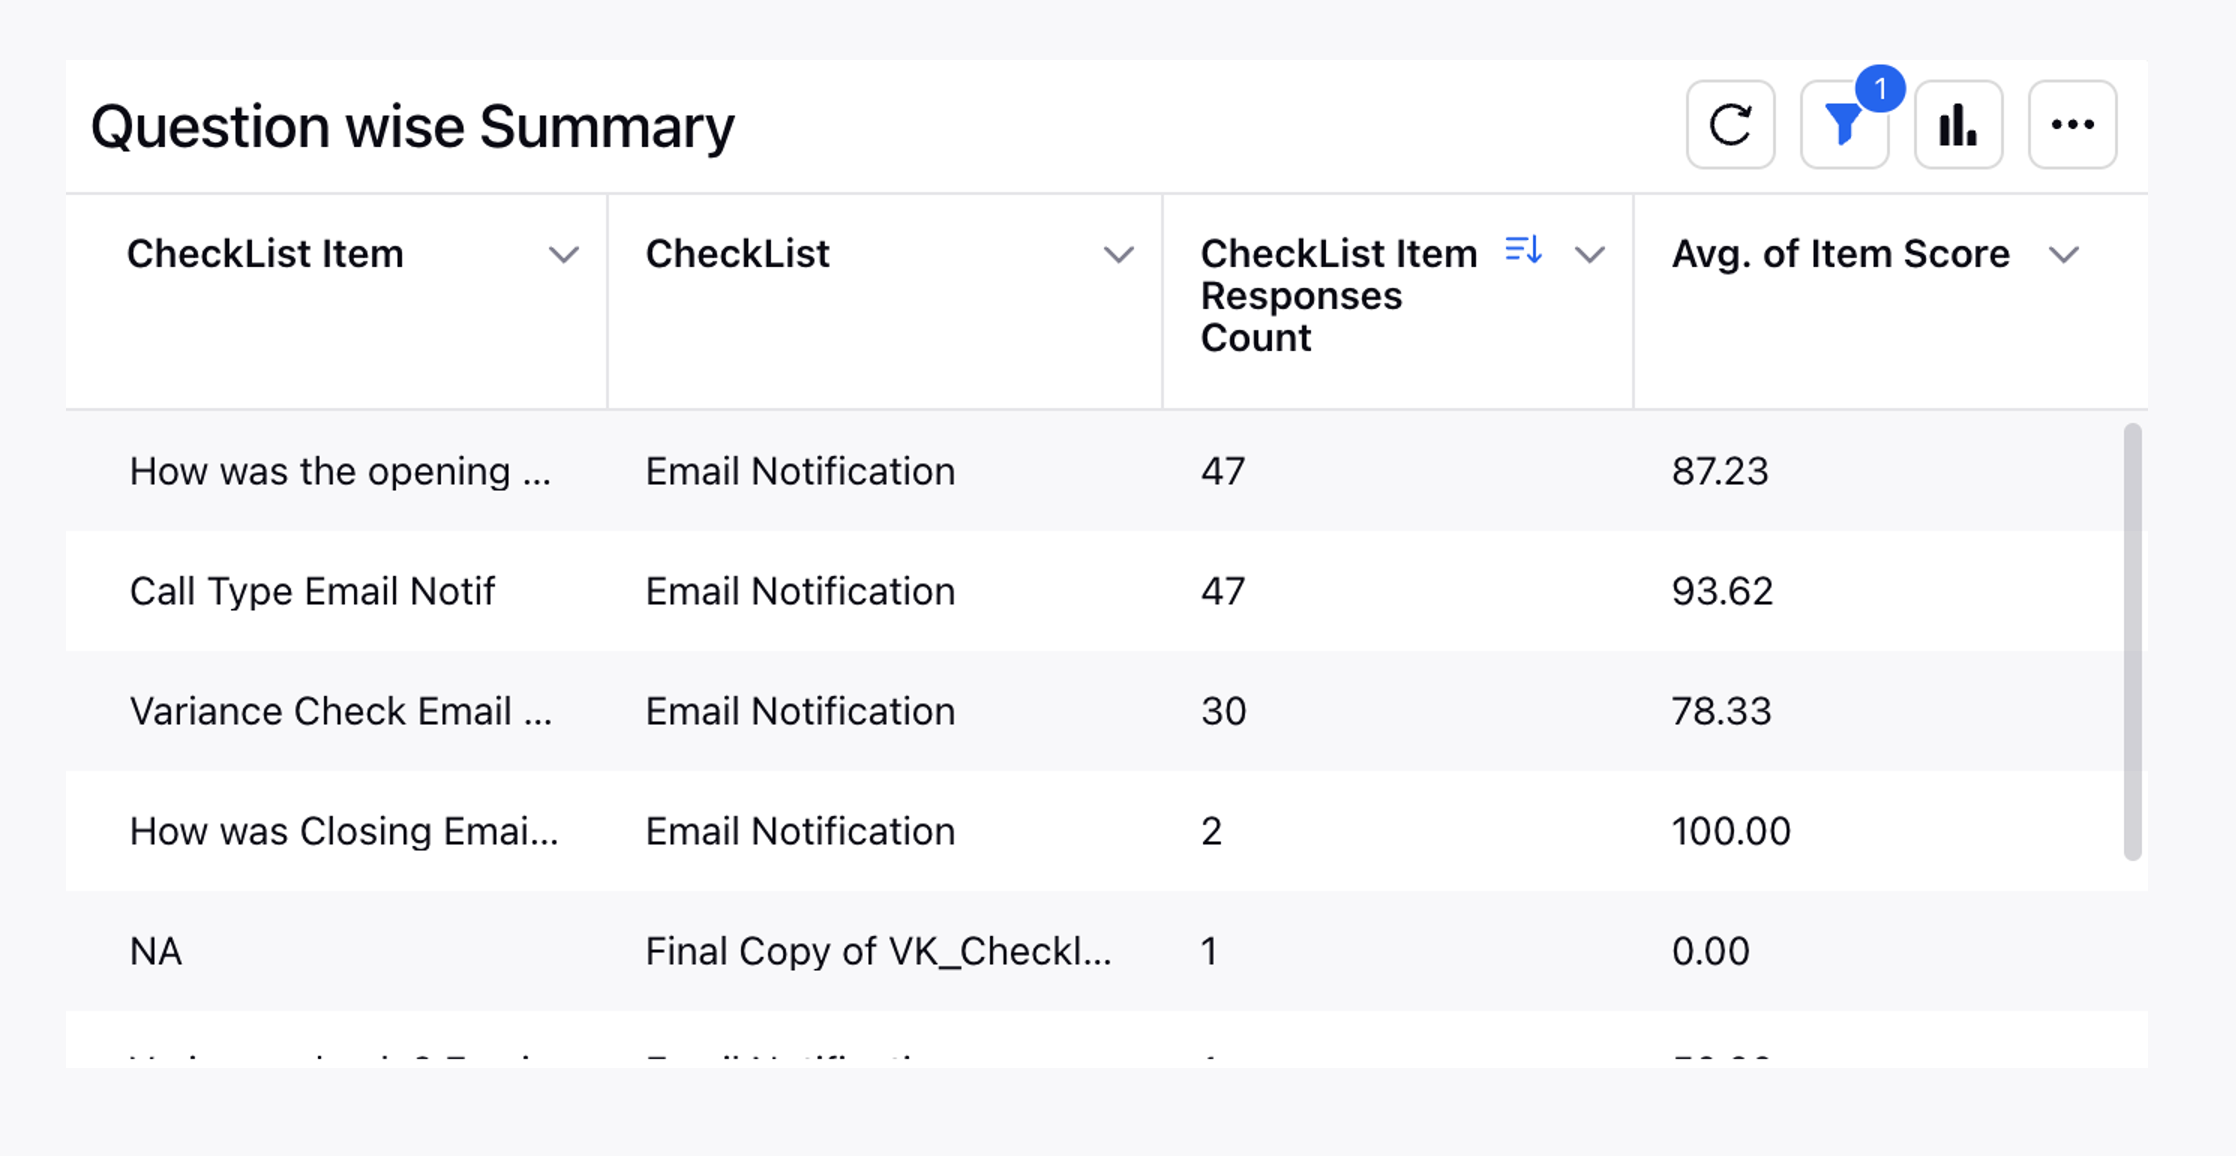
Low Performing Questions
This report helps to analyze which checklist parameters are the least scored by agents when audited by QM’s.
Column Name | Metric Name |
Checklist Item | Checklist Item |
Checklist | Checklist |
Checklist Item Response Count | Checklist Item Response Count |
Avg. Score | Evaluation Score |
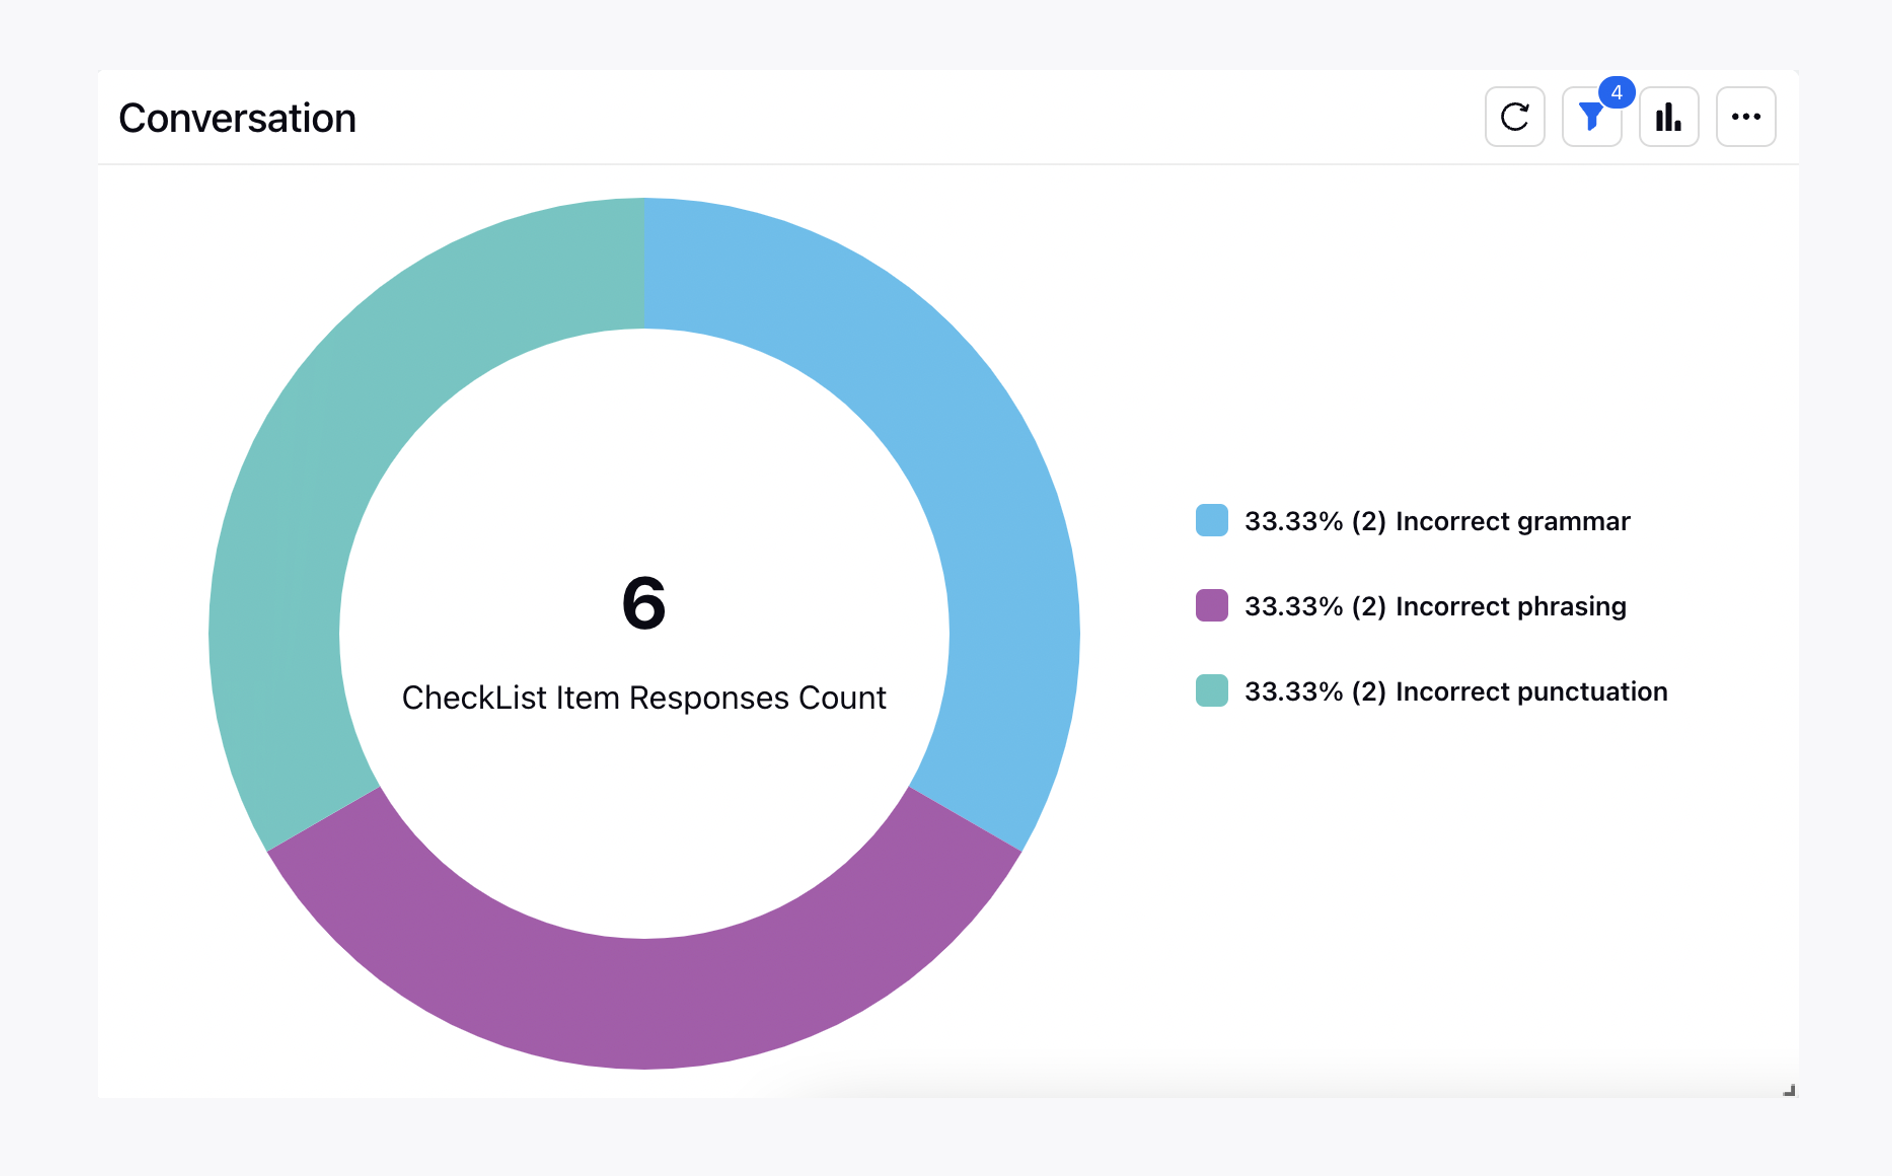
Checklist Parameter Distribution
Checklist Parameters Distribution is used to show how the checklist parameters responses are split. Generally a pie chart gives the best visual representation.
Wedge/Value = Checklist Response
Value = Checklist item response Count
Filters = <Checklist _Parameter_Name>
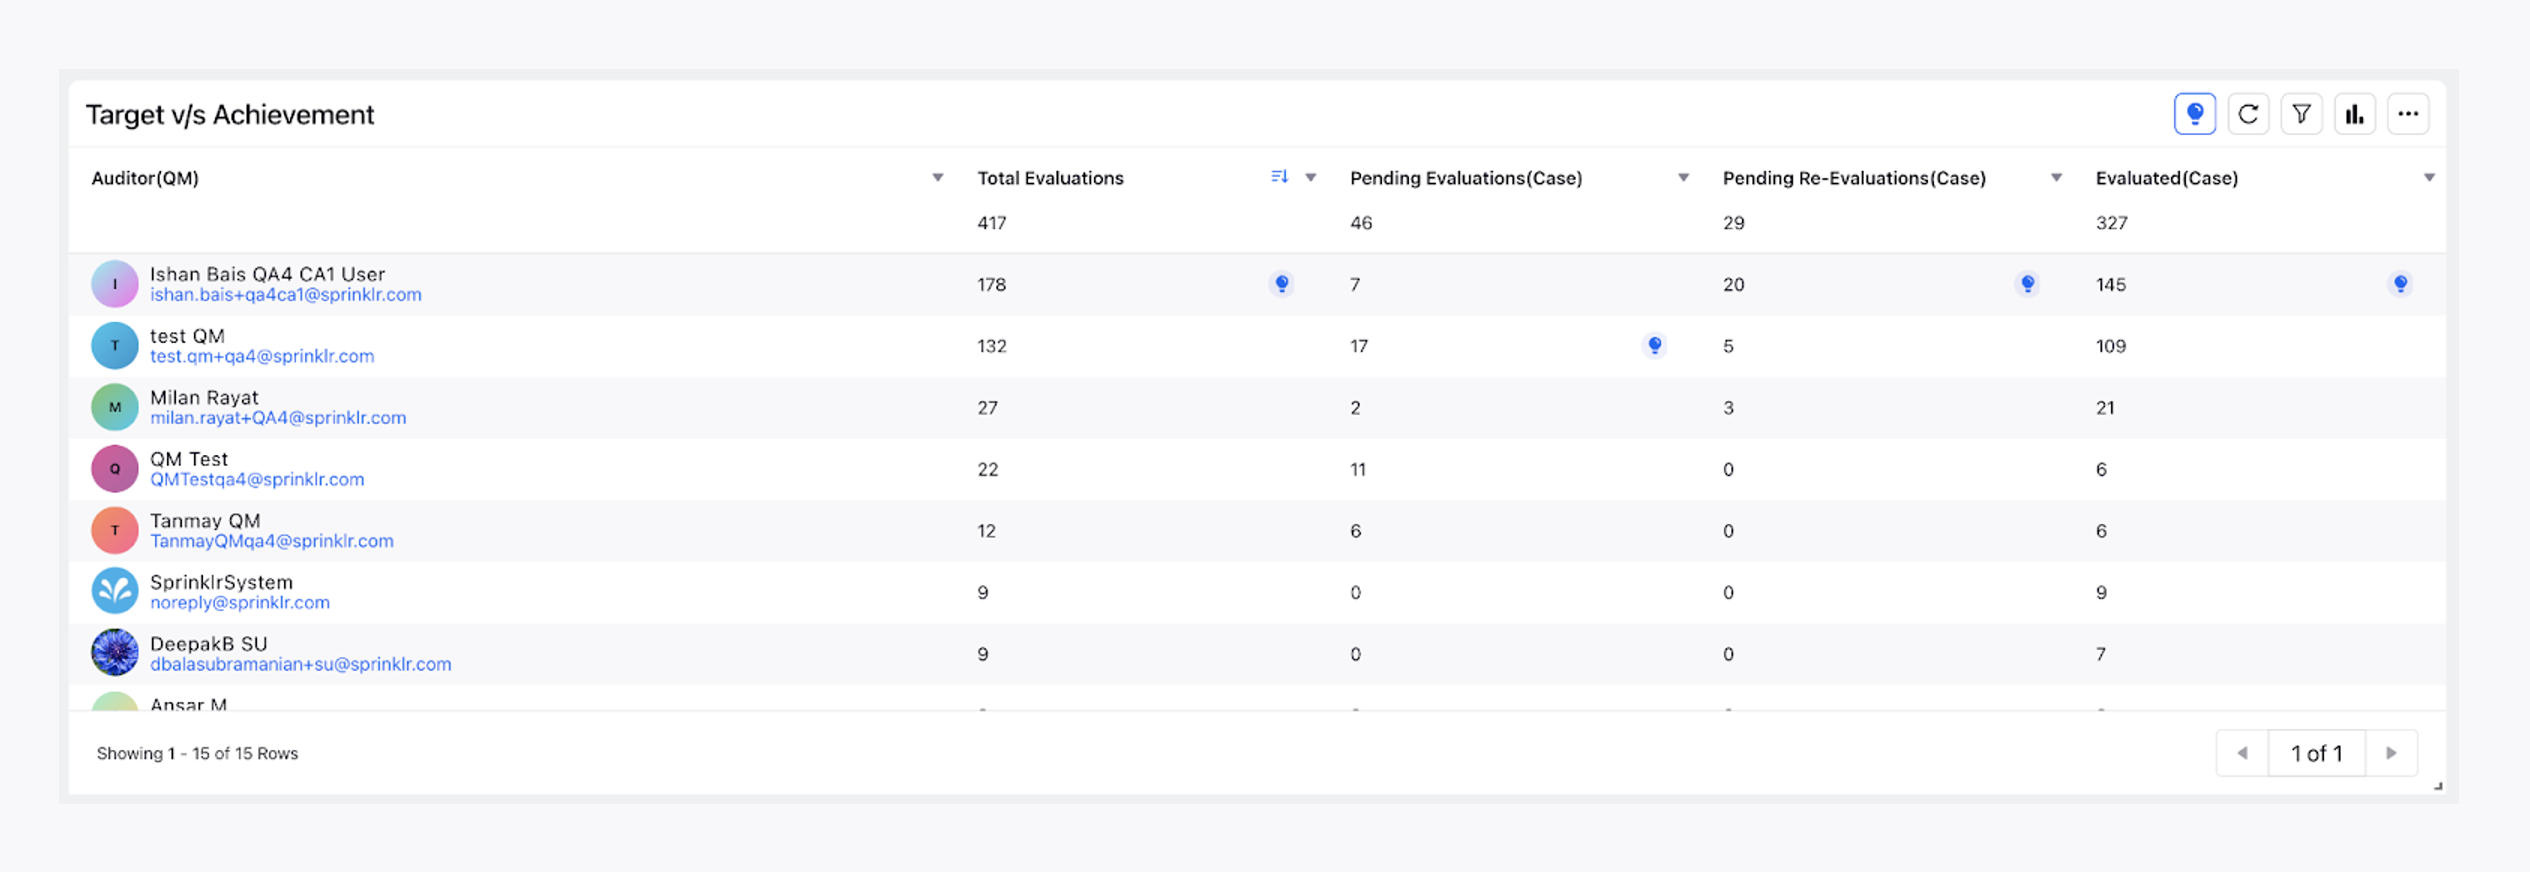
Target V/s Achievement
As a Supervisor if we want to look at how the QM’s are performing, we can use this widget through which we will be able to understand how much evaluations are auditors completing on daily, Weekly or Monthly basis.
Column Name | Metric Name |
Auditor(QM) | Checklist Item |
Total Evaluations | Total Manual Evaluations |
Pending Evaluation(Case) | Pending Evaluation(Case) |
Pending Re-evaluations(Case) | Pending Re-evaluations(Case) |
Evaluated(Case) | Evaluated(Case) |
Agent Acknowledgement Pending | Agent Acknowledgement Pending |
Like at an Auditor level we can also create at the agent level Target v/s achievement.
Detailed Total Allocations
In order to see a detailed view of all the cases that are assigned to all the Quality Managers the following widget can be helpful as it gives the breakdown of important case parameters.
Column Name | Metric Name |
Case | Case |
Case Creation Time | Case Creation Time |
Total Manual Evaluations | Total Manual Evaluations |
Evaluated Agent | Evaluated Agent |
Auditor(QM) | Auditor(QM) |
Evaluated agent Manager | Evaluated agent Manager |
Evaluation Status | Evaluation Status |
Case Count | Case Count |
Areas of Improvement
A Quality Manager should be able to look at the different categories in which their agents are lacking. This report helps to look at the parameters where the agents are not performing well.
Column Name | Base Metric Name |
Agent | For User |
Checklist Parameters | Checklist Item |
Evaluation score | Item Score |
Acknowledgement Summary
Similar to Target v/s Achievement if a QM wants to look at how many evaluations are present for agent acknowledgement and what the distributions at an agent, auditor and Manager level or even look at the count of evaluations which are getting auto acknowledged this report can help.
Column Name | Base Metric Name | Custom Metric Definitions |
Agent | For User | _ |
Team Lead | User Manager | _ |
Submitted Evaluations | Checklist Response Count | _ |
Completed Evaluations | Checklist Response Count | Metric - Checklist Response Count, with a filter of Audit Status as Completed and Re-evaluated |
Ack. Pending | Checklist Response Count | Metric - Checklist Response Count, with a filter of Audit Status as Agent Acknowledgement Pending |
% Ack. Pending | Checklist Response Count | % of Checklist Response Count with a filter of Audit Status as Agent Acknowledgement Pending |
Ack. Expired | Checklist Response Count | Metric - Checklist Response count, with a filter of Evaluation Acknowledged By = Sprinklr System |
Different Date Range Filters
A QM widget can work on different Date filters, but the most frequently used are listed below.
Assigned for Evaluation At - This date range will filter the widgets based on when evaluations are assigned for Evaluations.
Checklist Response Date - This date range will filter the widgets based on when evaluation was filled on the case.
Evaluation Submitted Date - This date range will filter the widgets based on when evaluation was filled on the case.
Evaluation Completed At - This date range will filter widgets based on when evaluations got completed i.e their status became Completed or Re-evaluated.
Audit Modified At - This will filter the widget based on when the audit got modified which can be through editing the audit, change of status.
Filters Used in QM Dashboard
Here are the list of standard dashboard level filters used in QM Dashboard
Metric Name |
Social Network |
Reviewer |
Auditor(QM) |
Evaluation Form |
Evaluation Status |
Evaluated Agent |
Evaluated Agent Manager |
Campaign |
Evaluated Agent Reviewer |
<User_Level_CF> |
<Case_Level_CF> |