Standard Live Chat Reporting Dashboard
Updated
In Care Reporting, you can view various reports on Sprinklr Live Chat to monitor your customer support agents' performance. View some of the common use cases below.
Click the image to view it in the modal view.
Live Chat Website Insights
Widget | Description | Image |
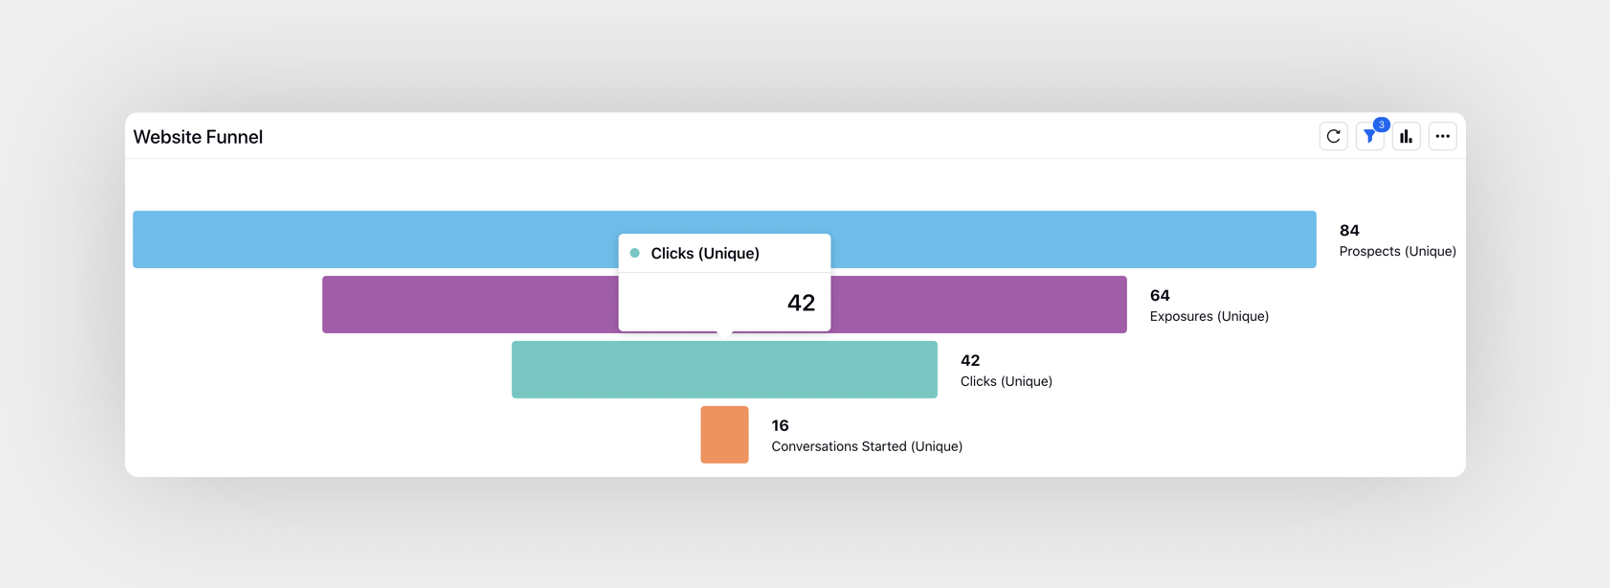
Website Funnel | This widget displays the Unique Livechat Prospects/Unique Livechat Exposures/Unique Livechat Clicked funnel from the total initiated conversations | |
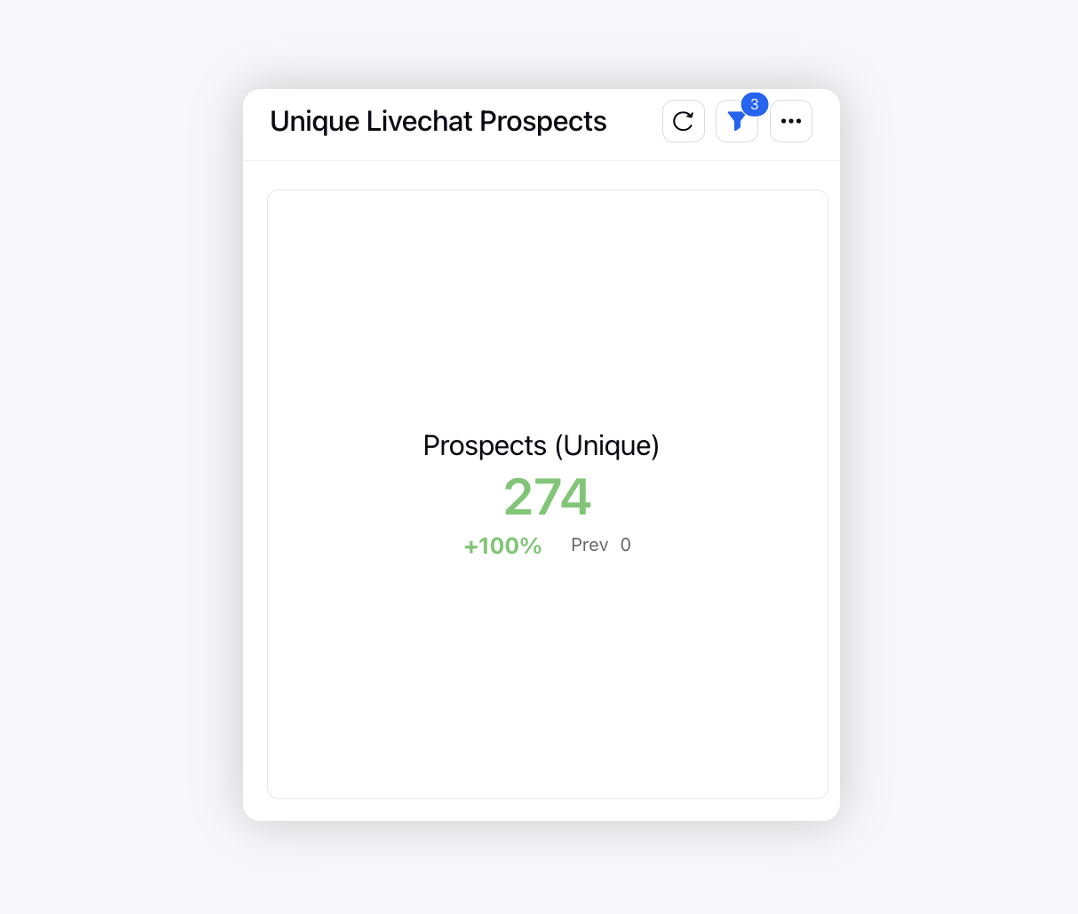
Unique Live Chat Prospects | Number of unique impressions over the live chat | |
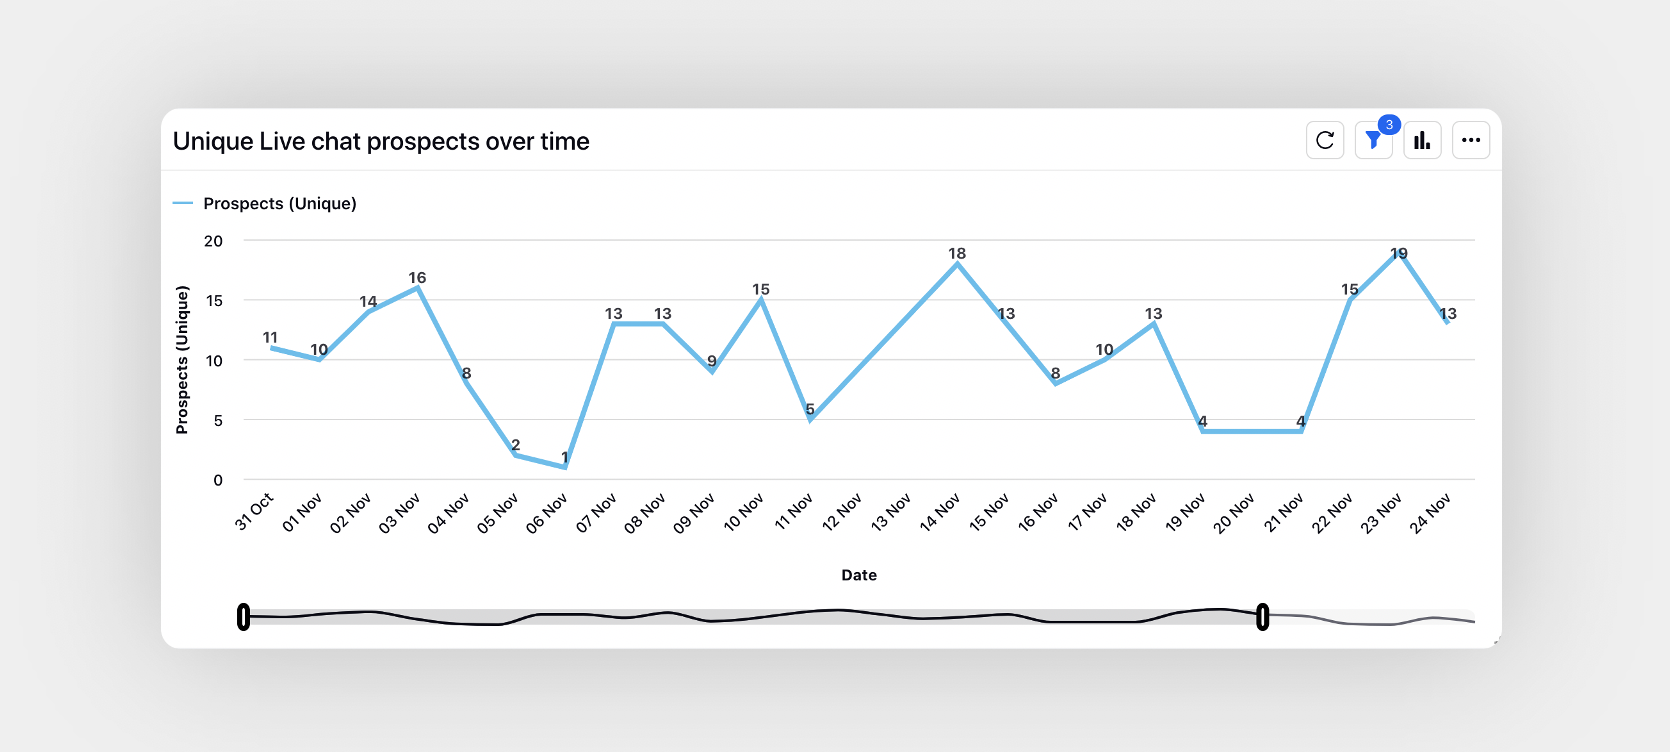
Unique Live Chat Prospects over time | Number of unique impressions over the live chat - day wise segregation | |
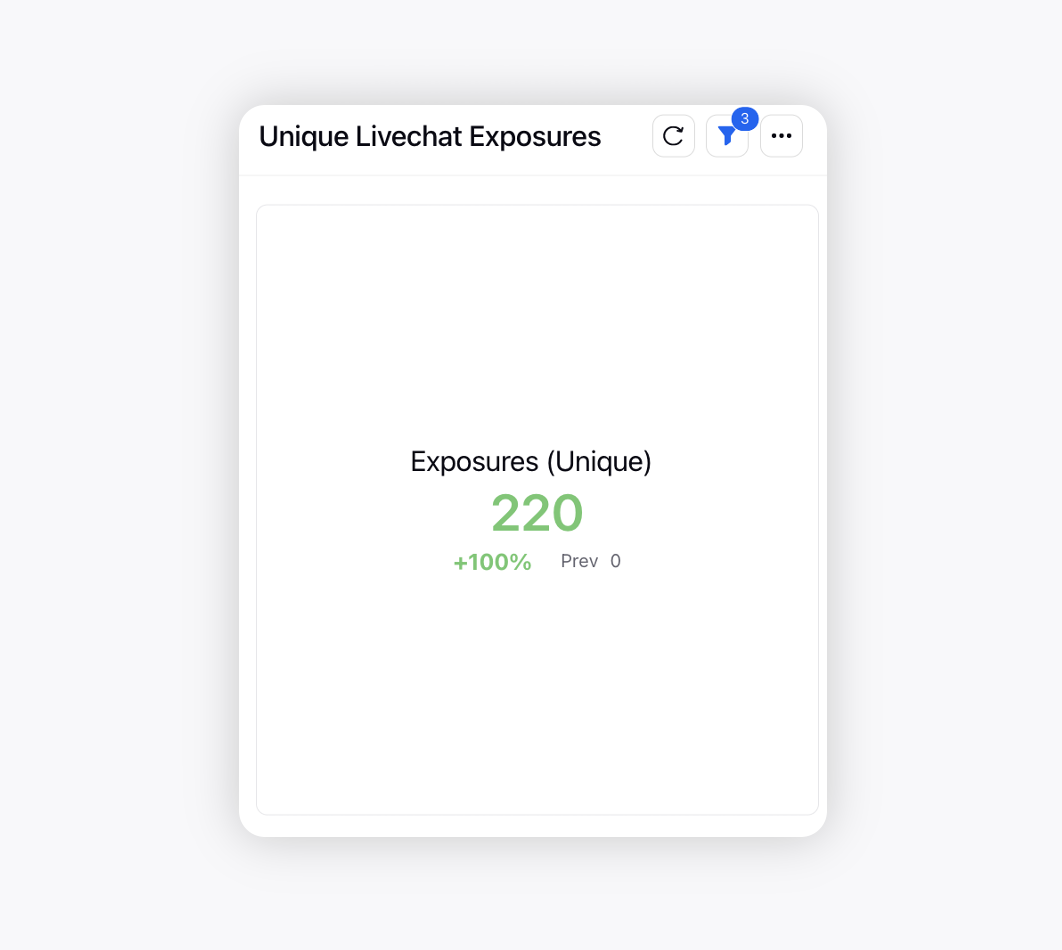
Unique Live Chat Exposures | Number of unique visits (people visiting) on the live chat | |
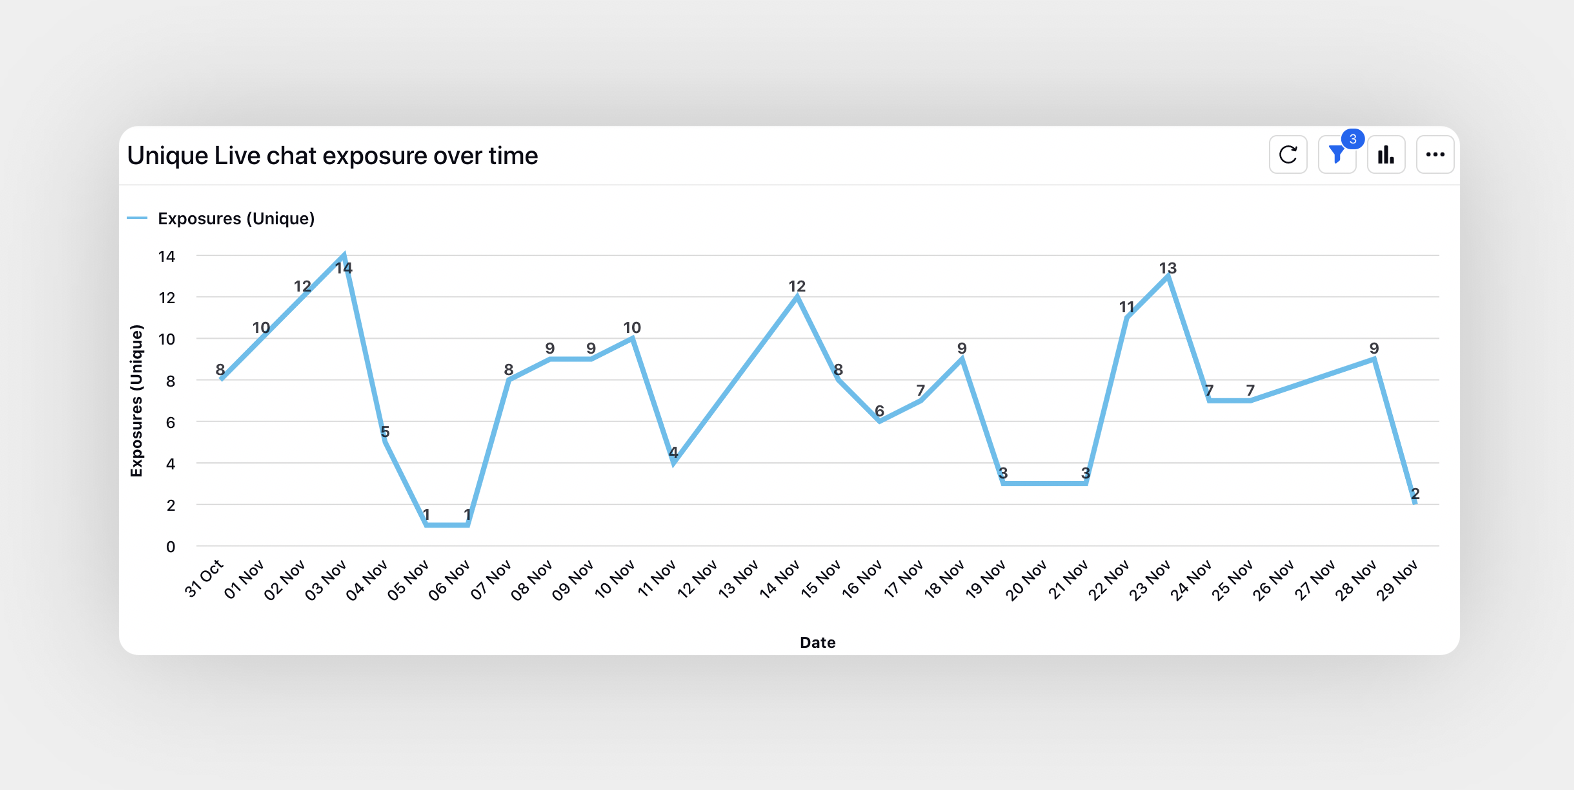
Unique Live Chat Exposures over time | Number of unique visits (people visiting) on the live chat - day wise segregation | |
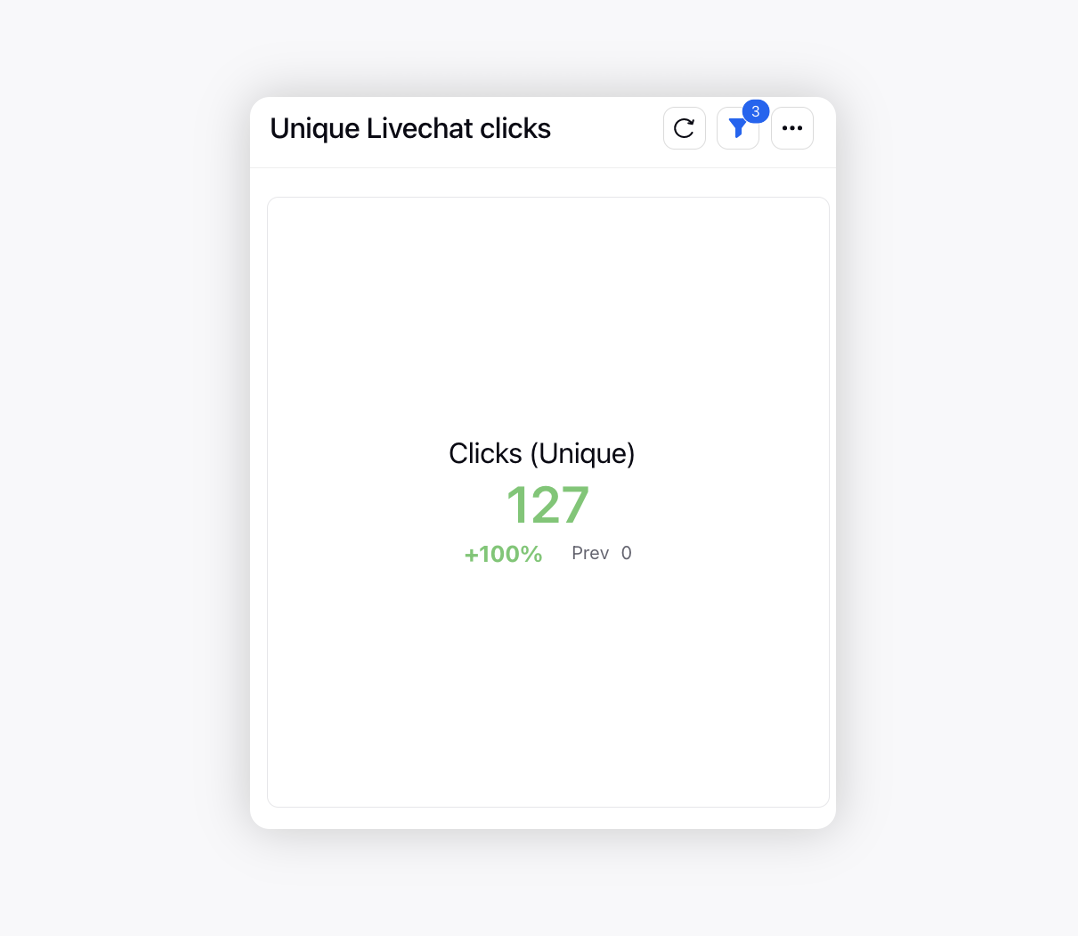
Unique Live Chat Clicks | Number of unique clicks | |
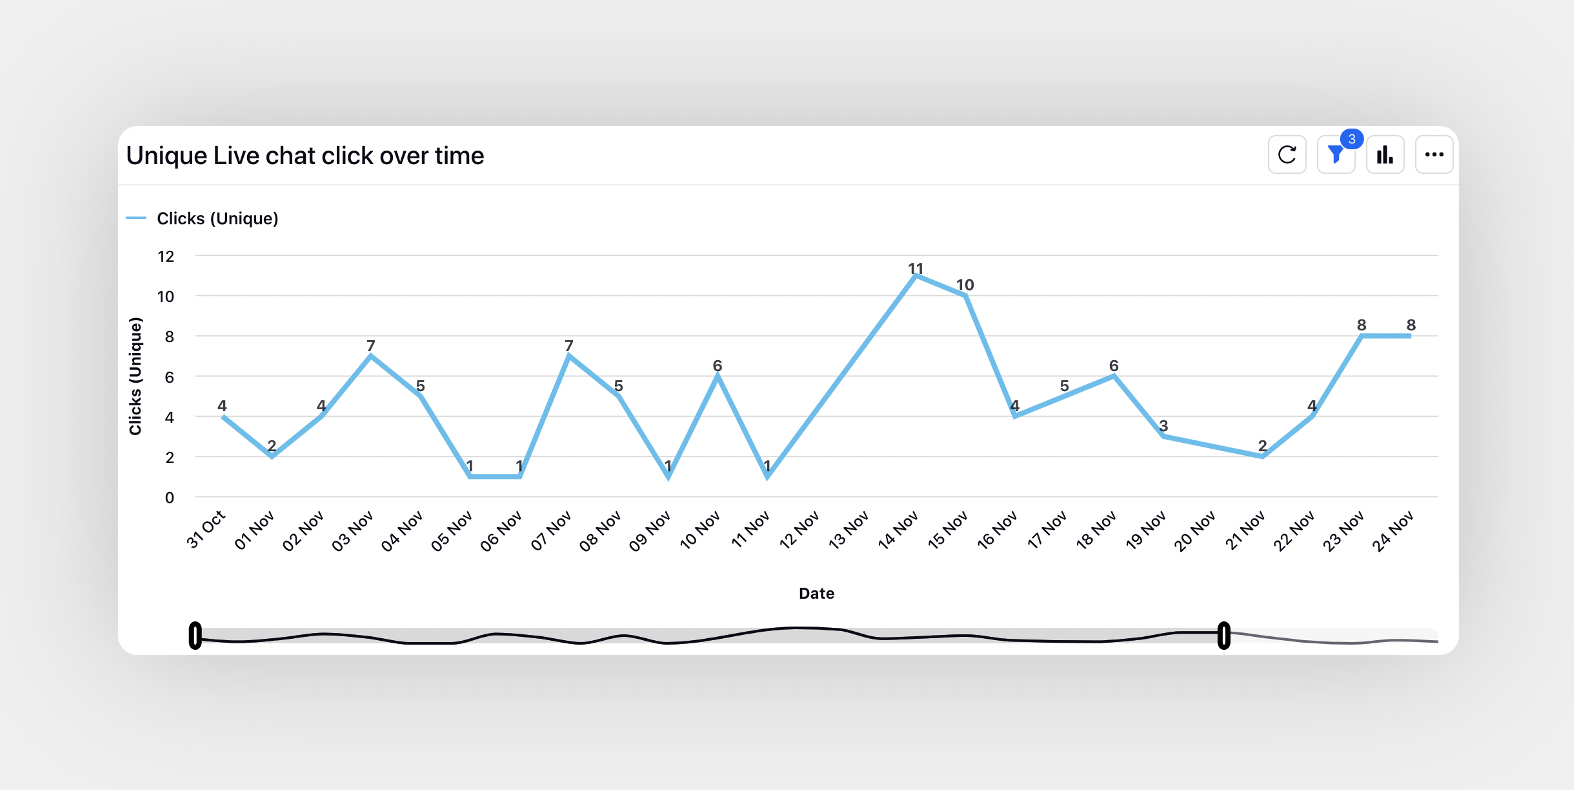
Unique Live Chat Clicks over time | Number of unique visits - day wise segregation | |
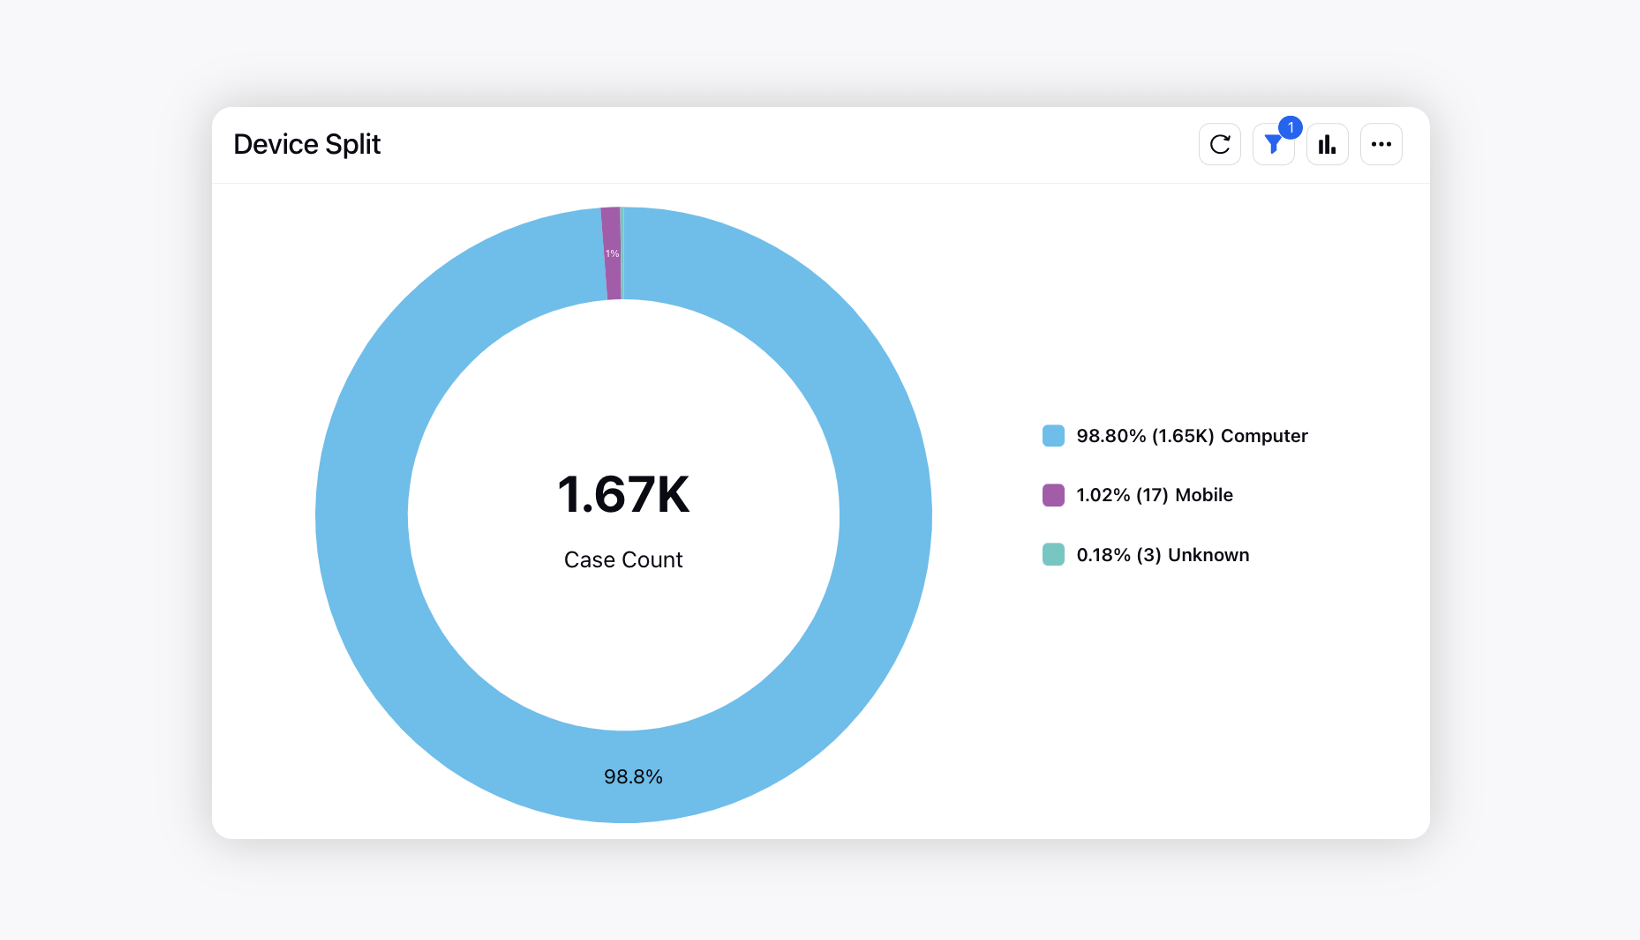
Device Split | Case count per Device being used | |
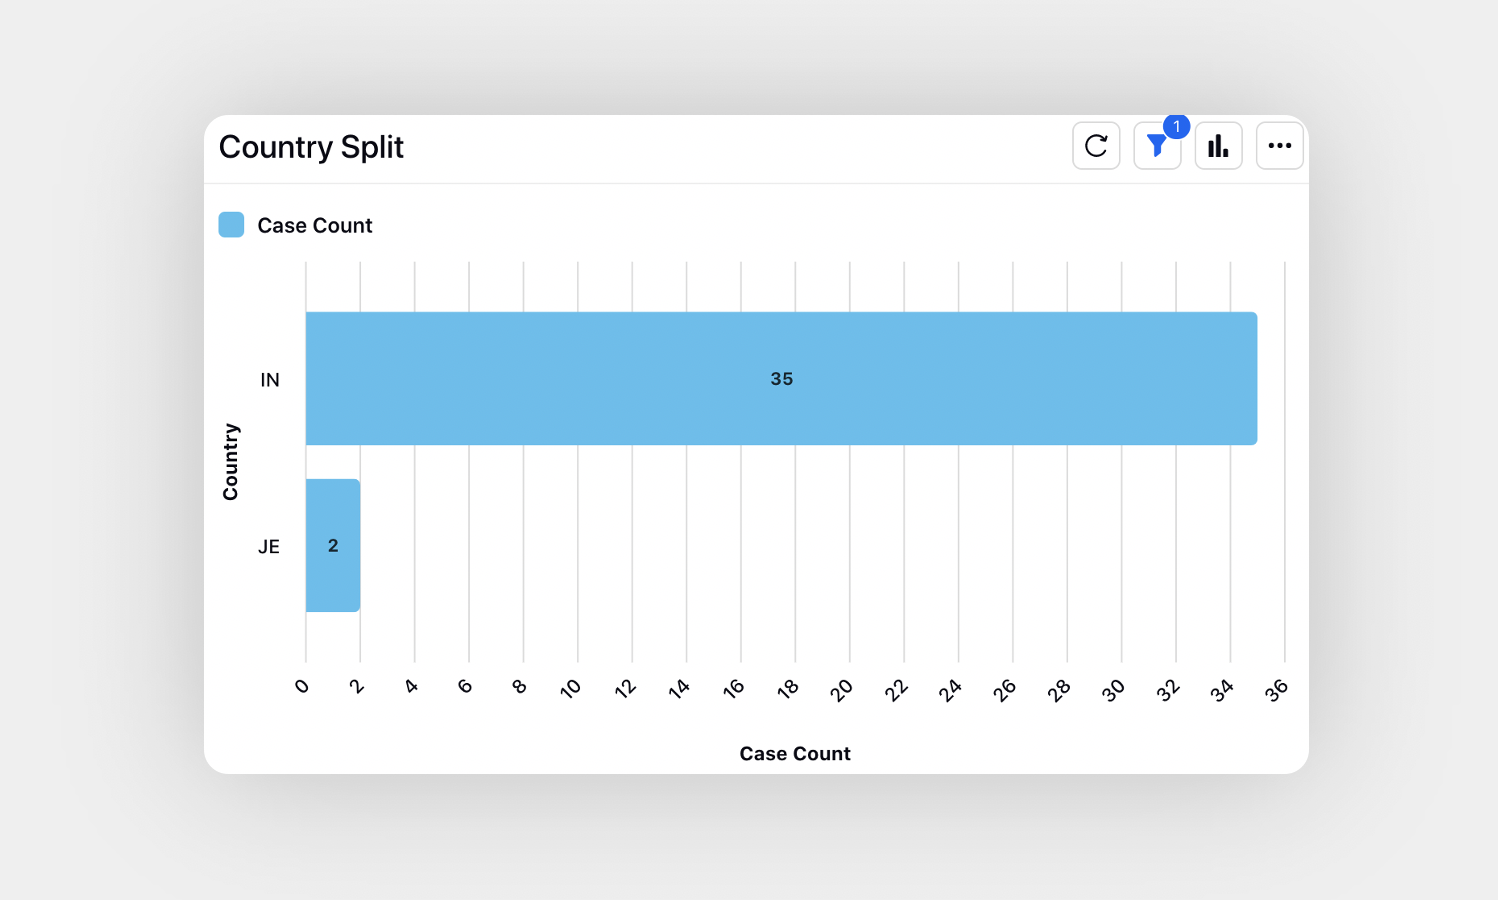
Country Split | Case count on the basis of Country (Dependent on Environement) | |
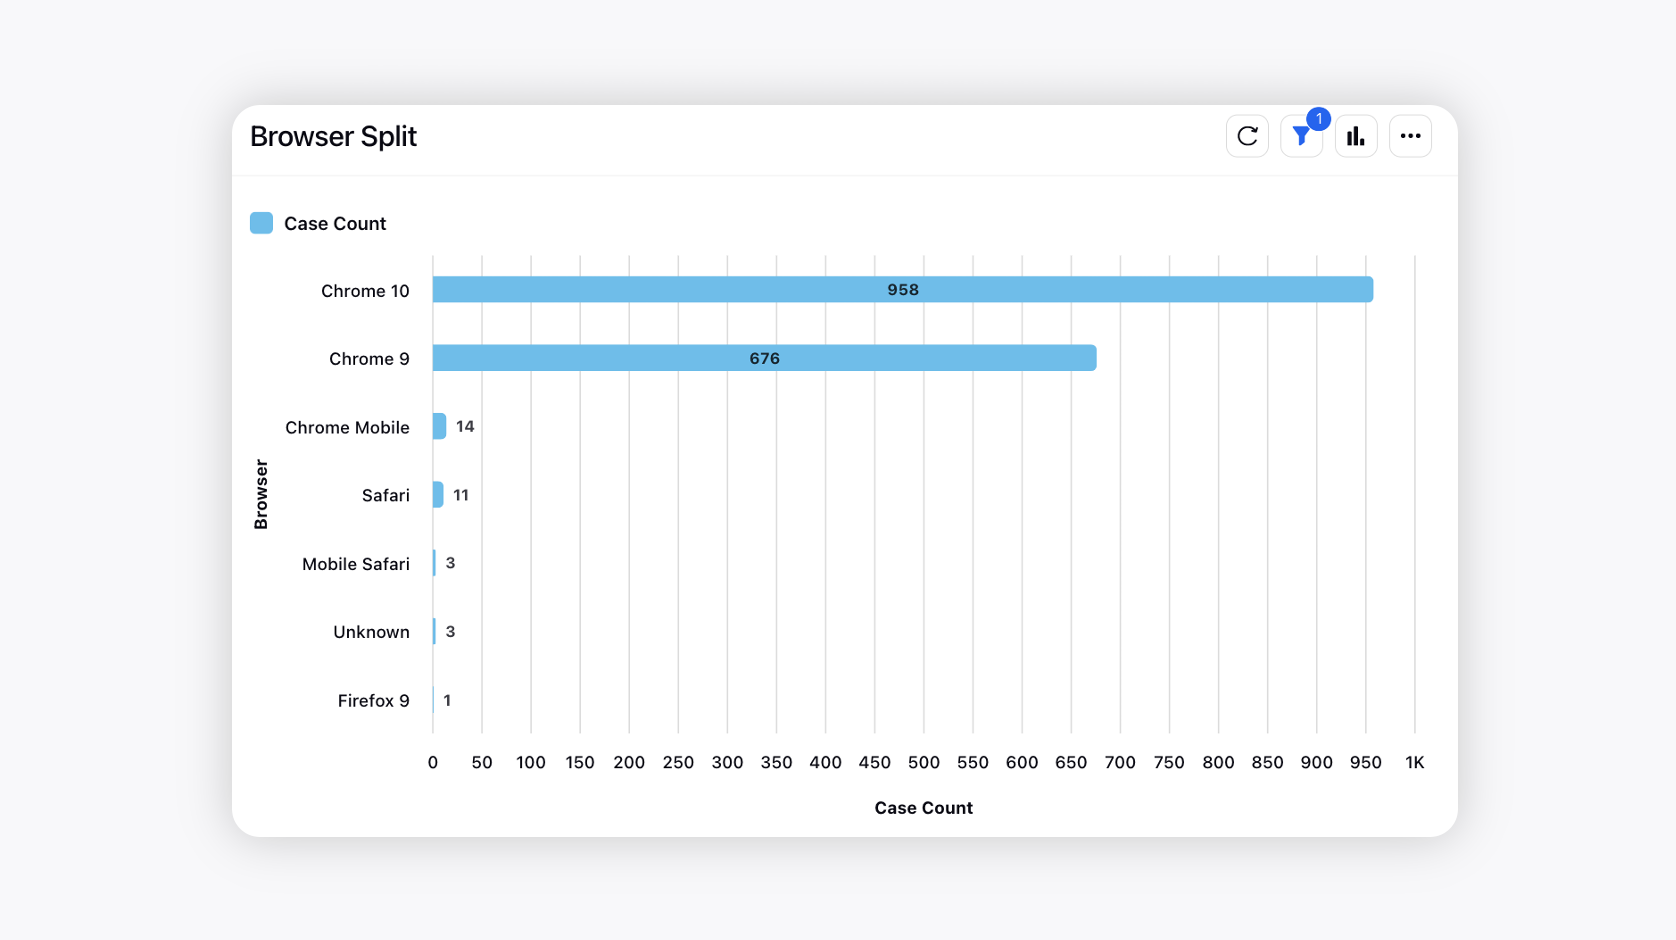
Browser Split | Case count on the basis of Browser (Dependent on Environement) | |
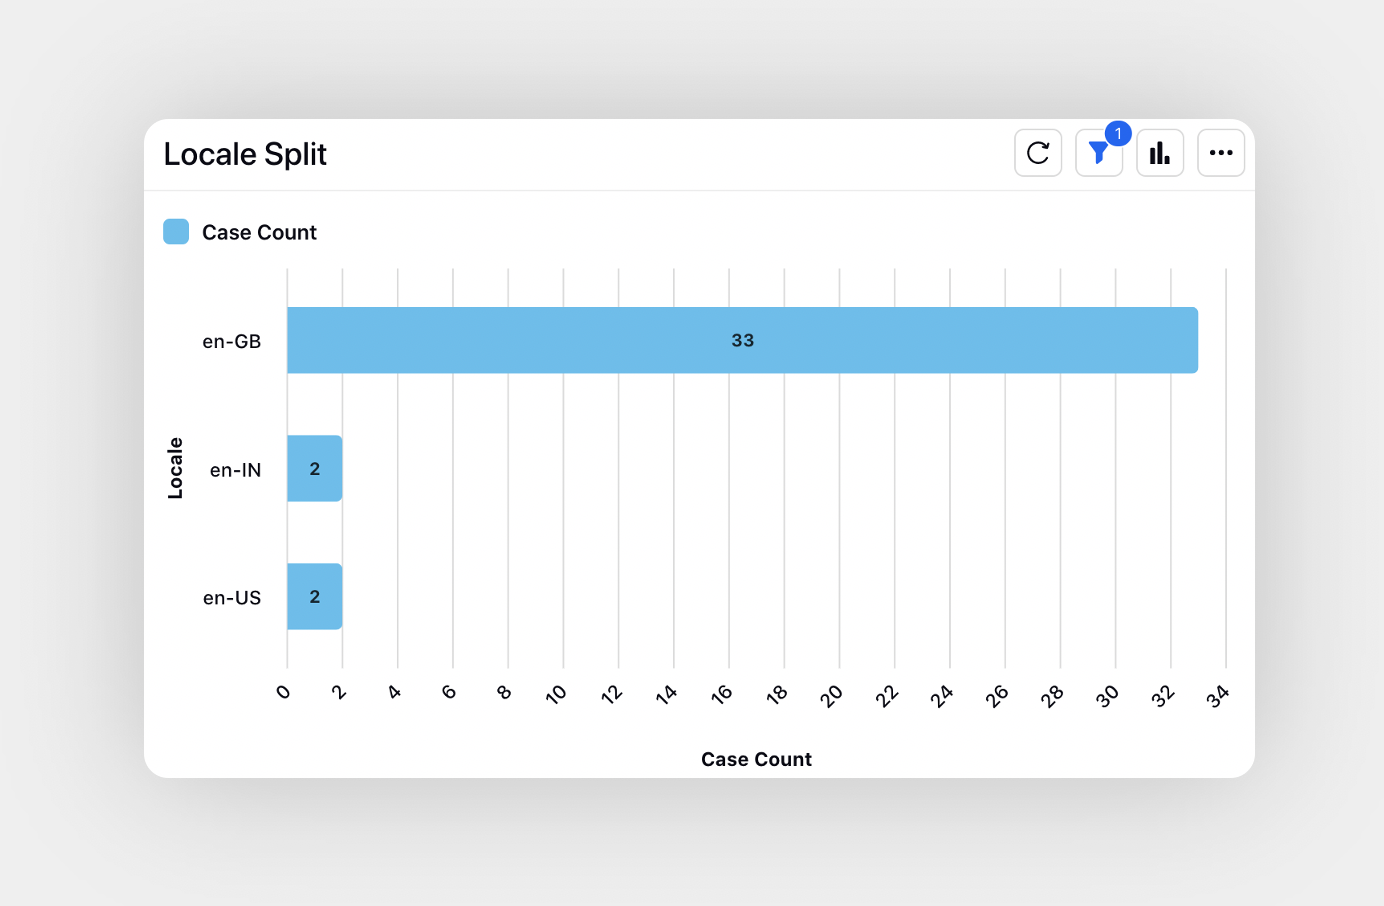
Locale Split | Case count on the basis of Locale (Dependent on Environement) | |
Proactive Prompt Insights
Widget | Description | Image |
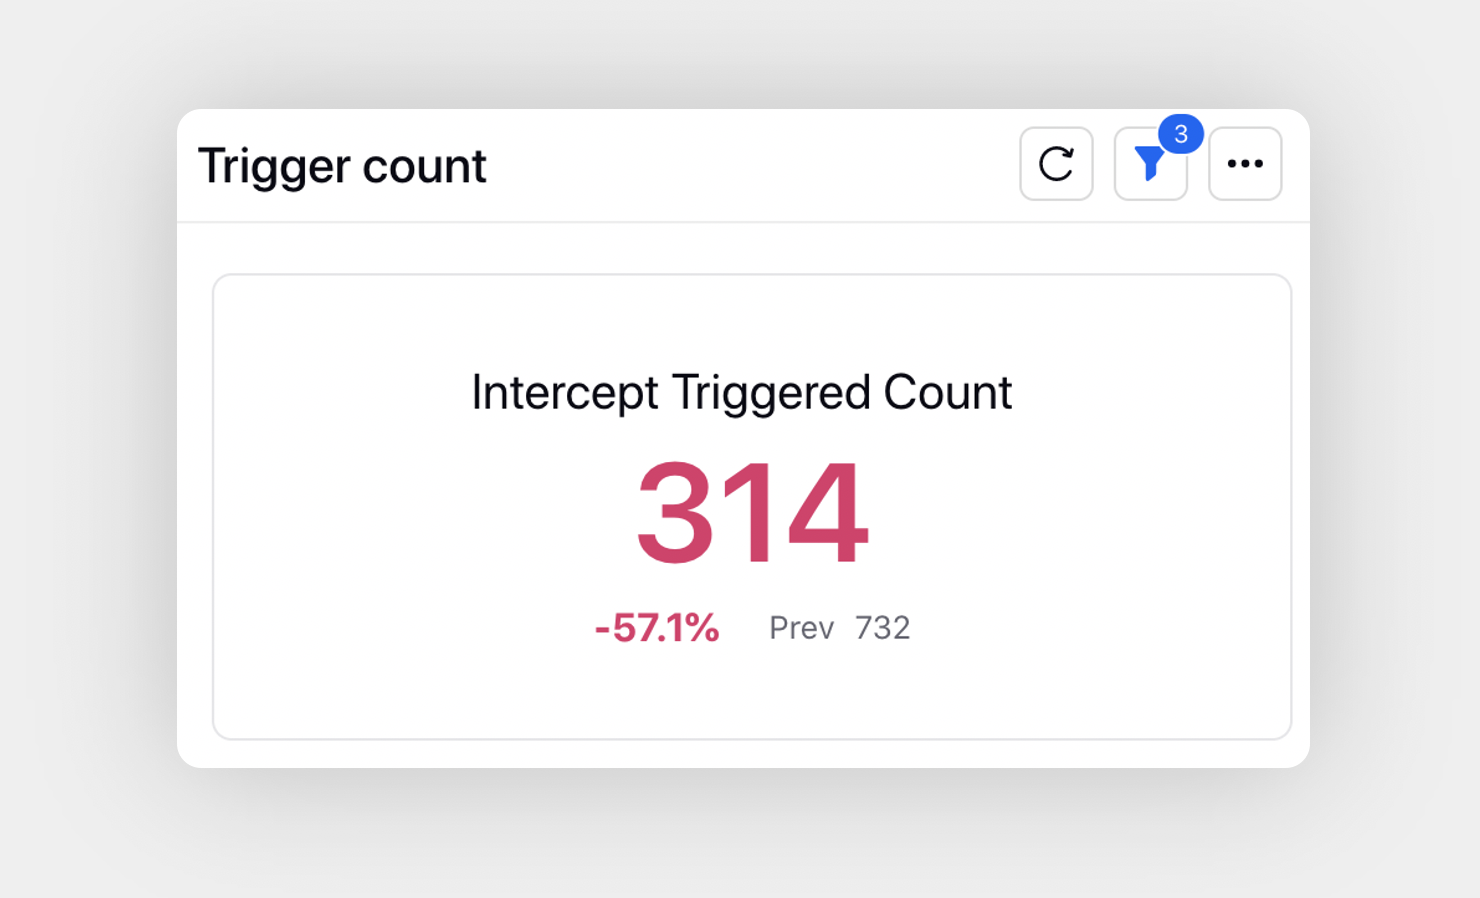
Trigger Count | Number of prompts/intercepts triggered in a chat | |
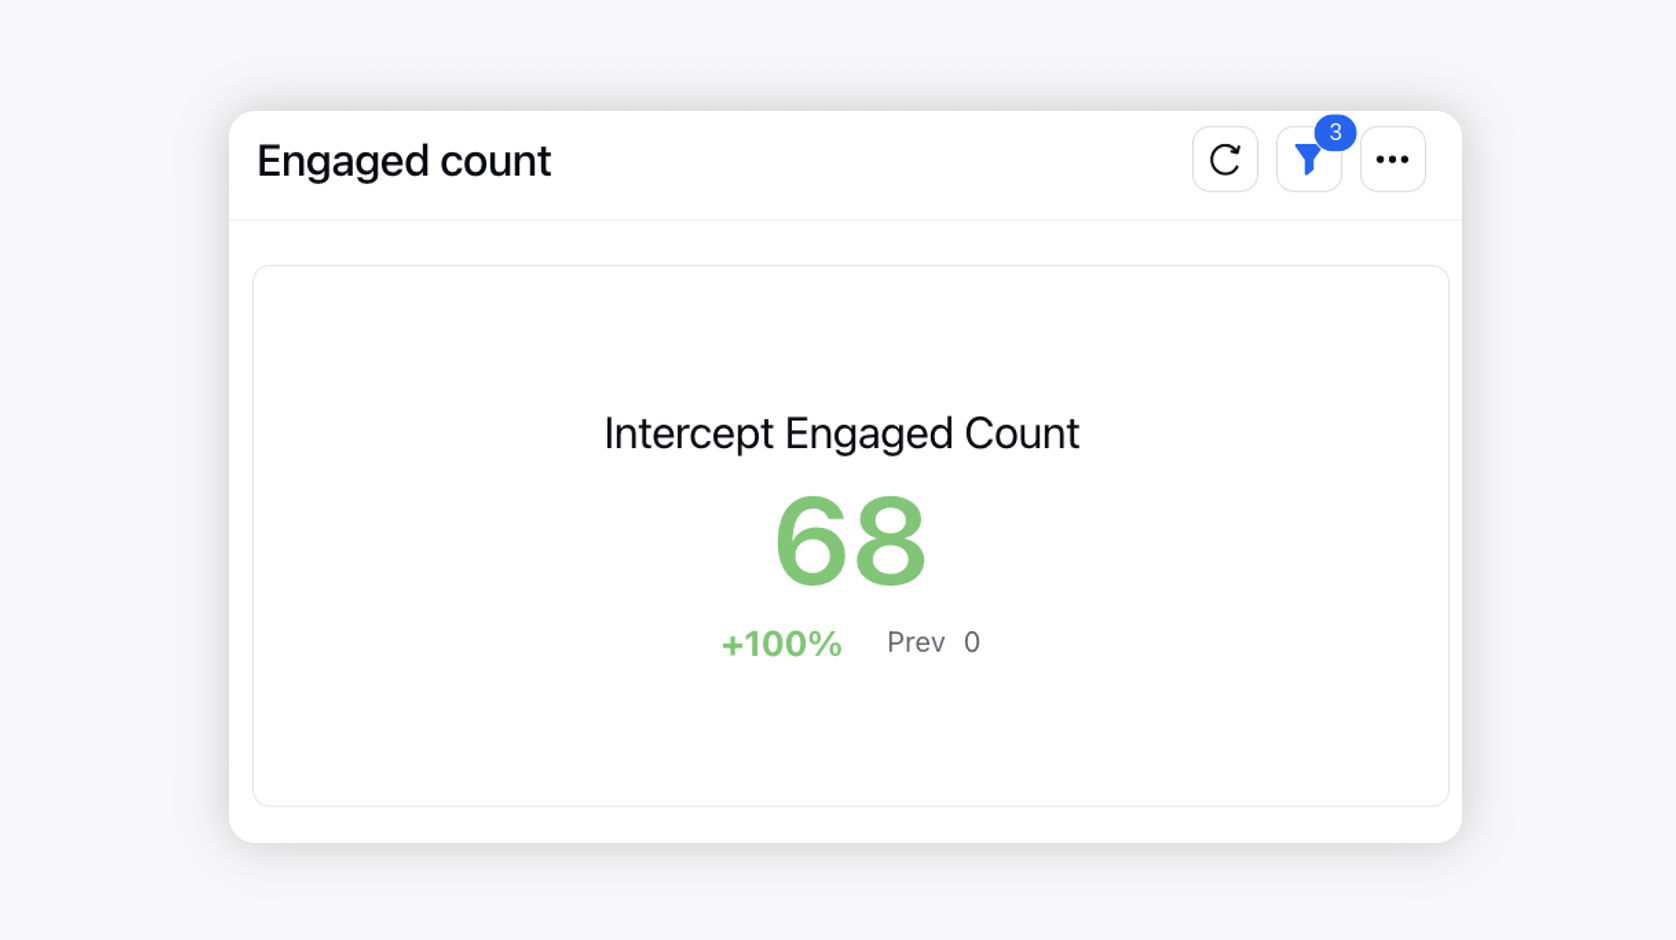
Engaged Count | Number of prompts/intercepts engaged/responded in a chat | |
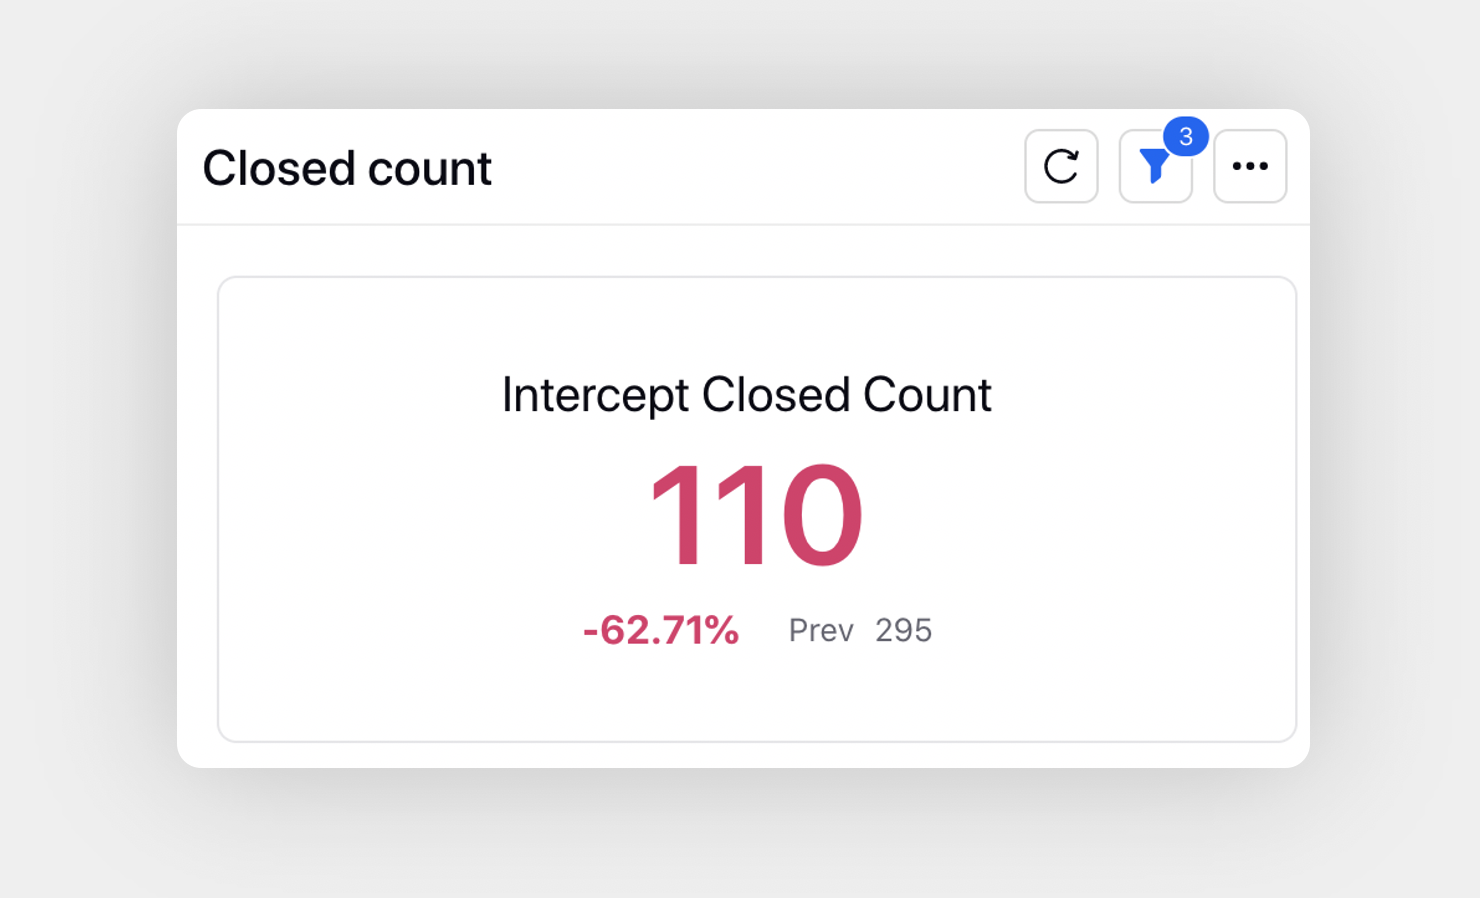
Closed Count | Number of prompts closed in a chat | |
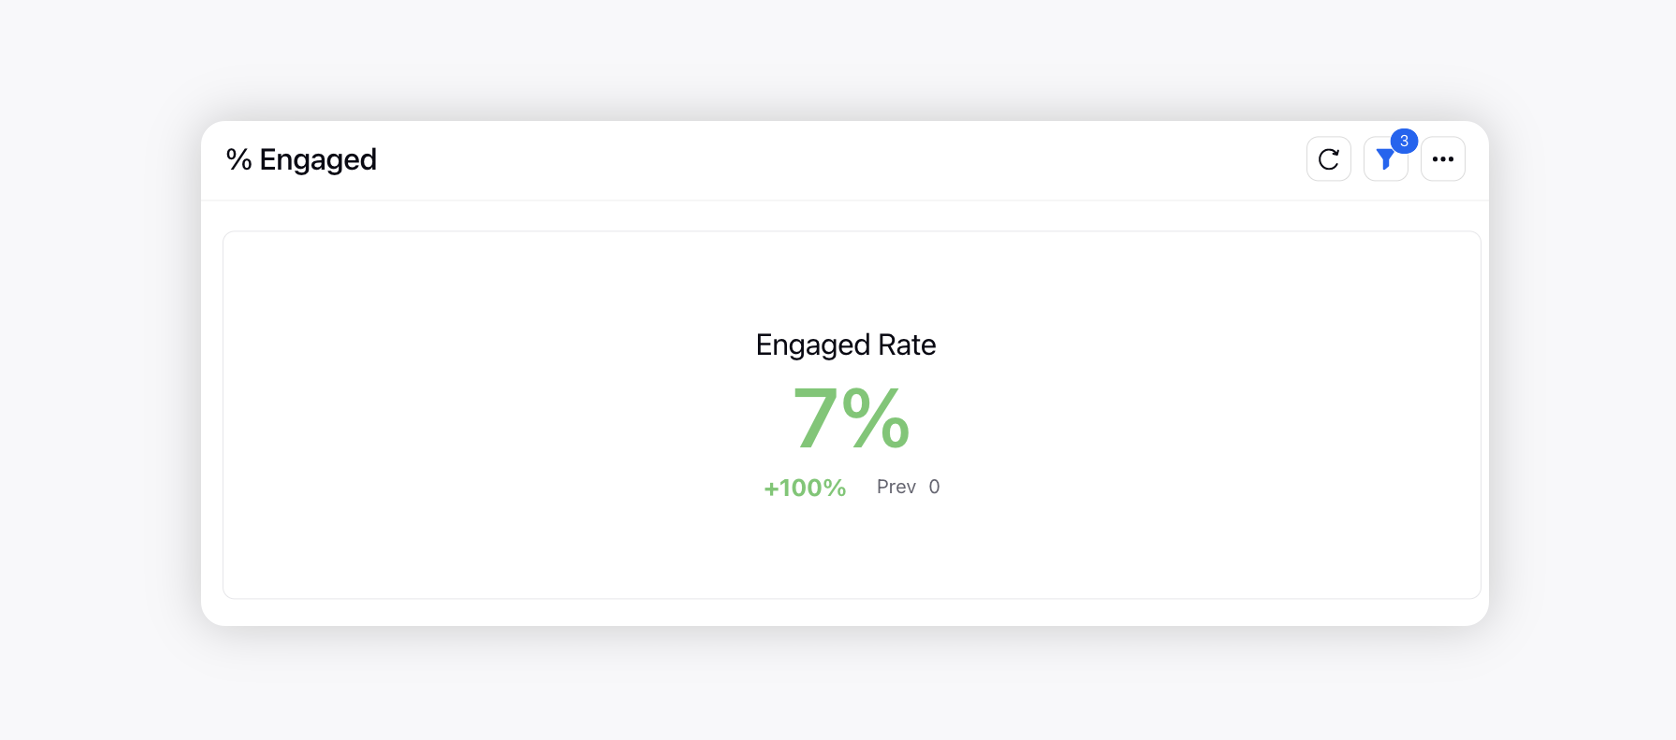
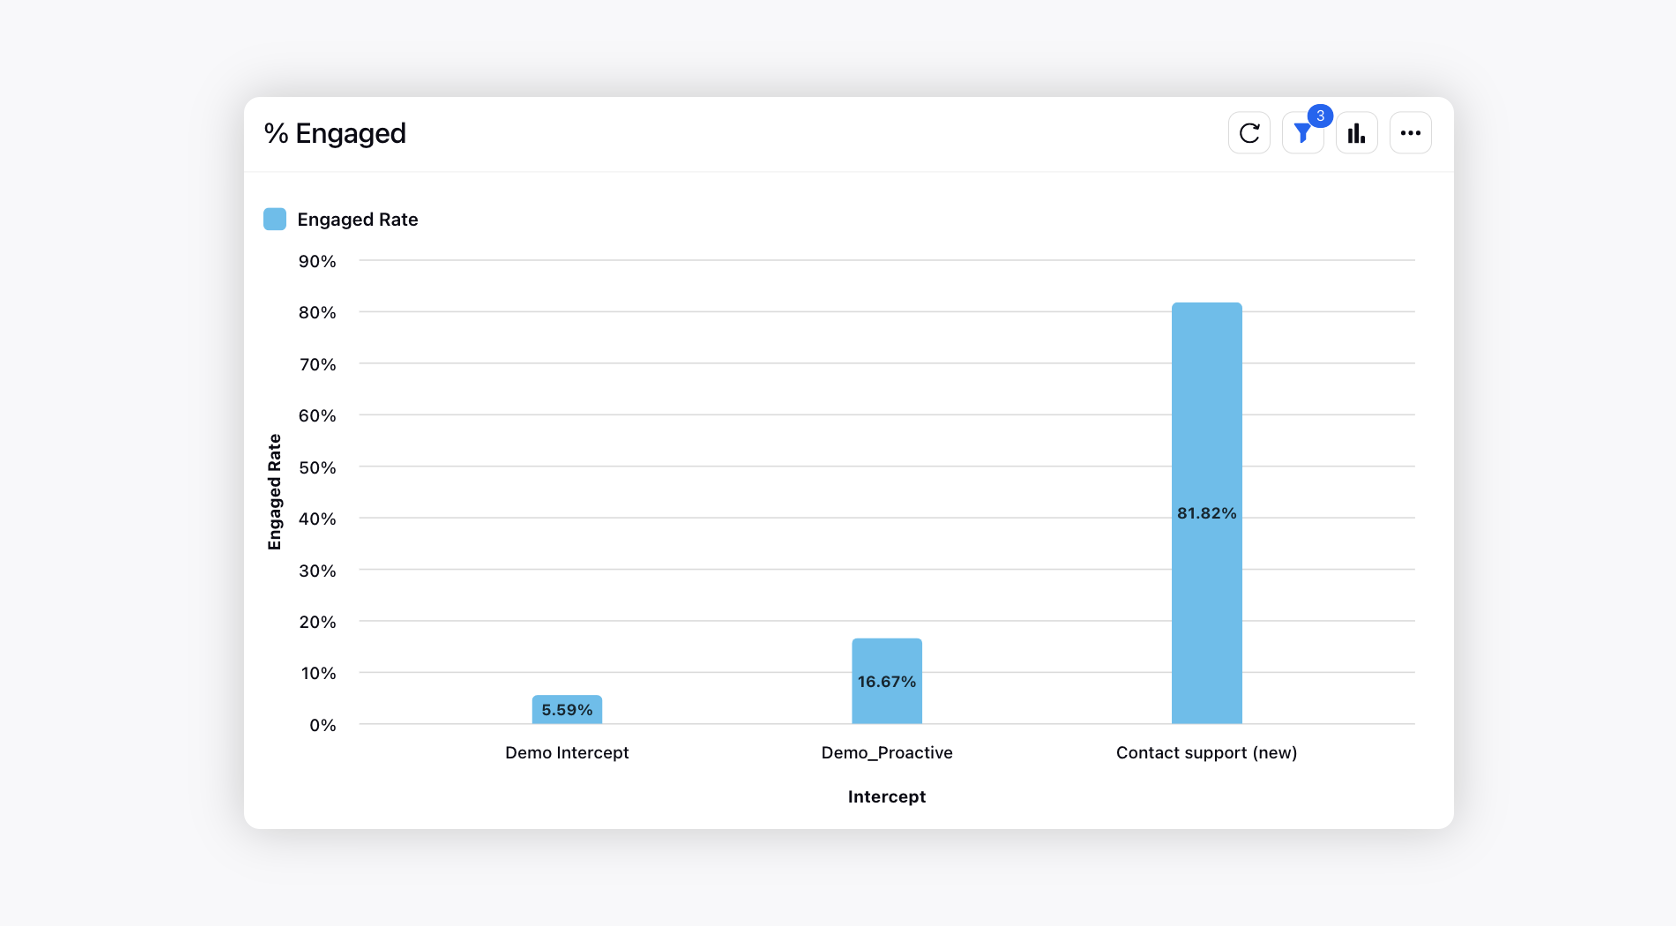
% Engaged | % prompts engaged out of the overall triggered count | |
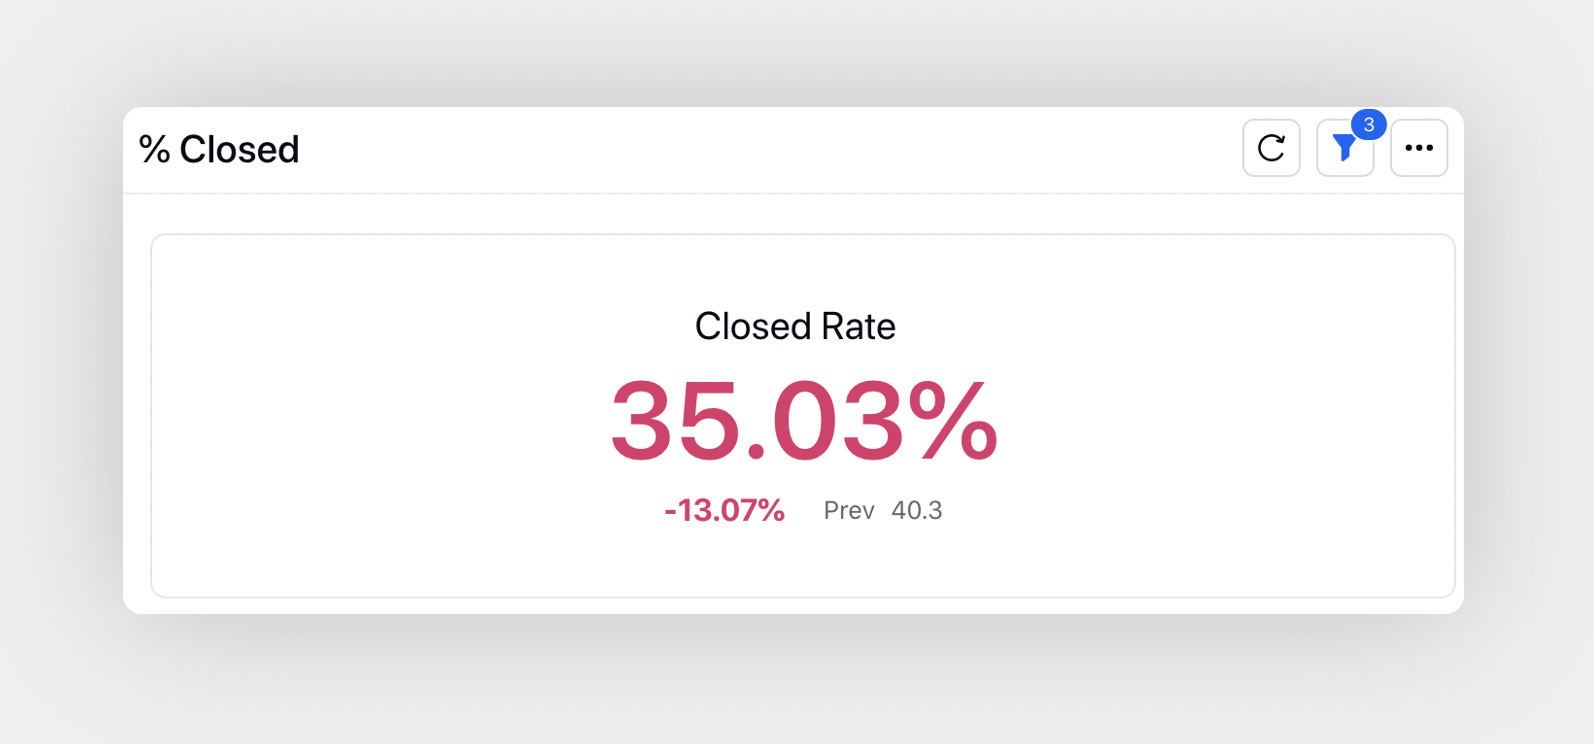
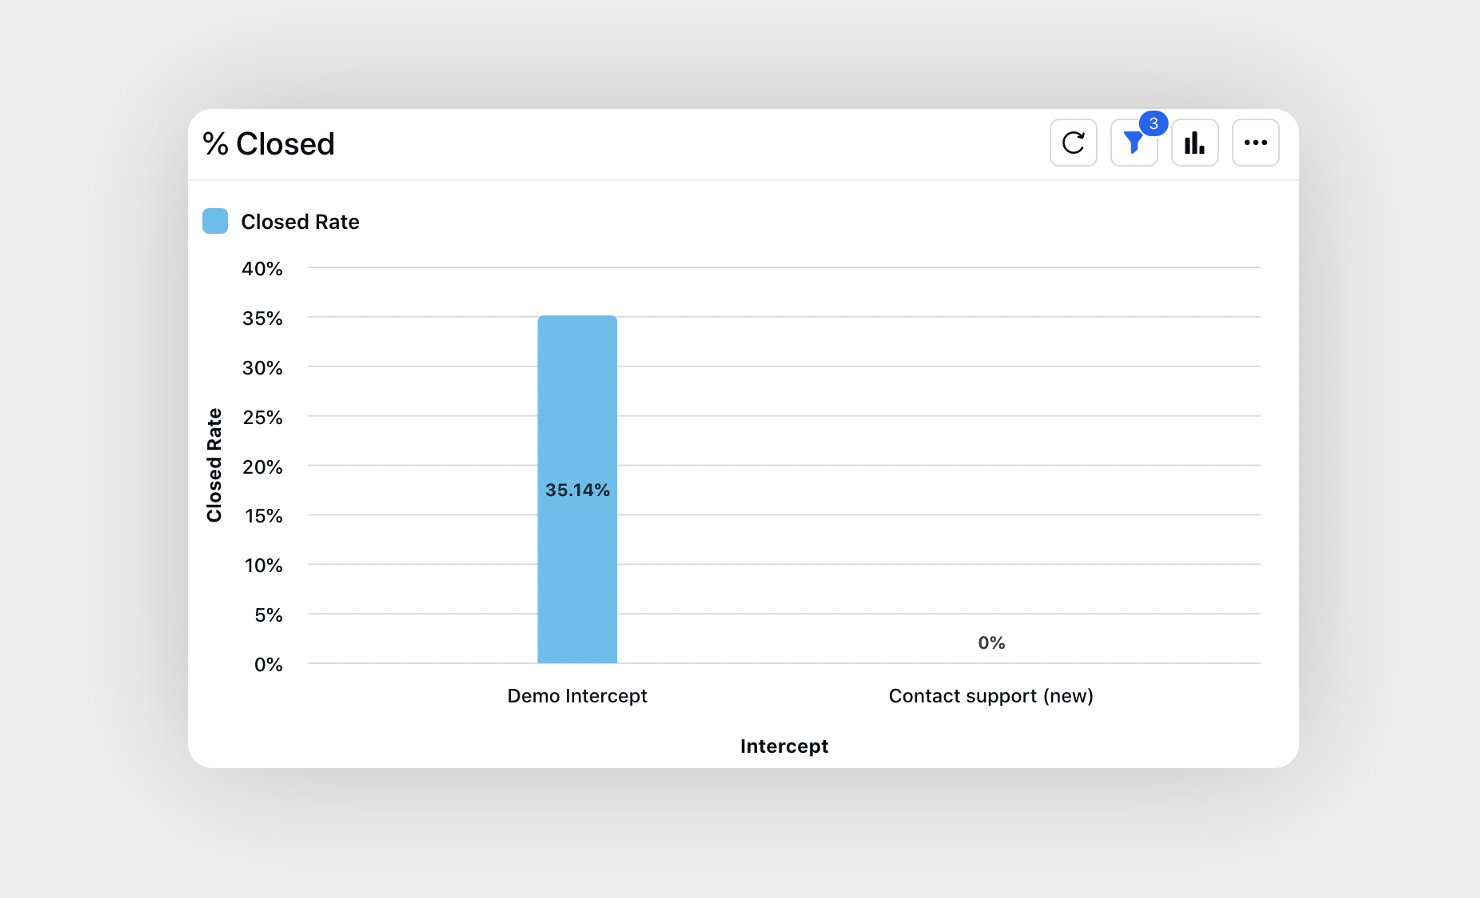
% Closed | % prompts closed out of the overall triggered count | |
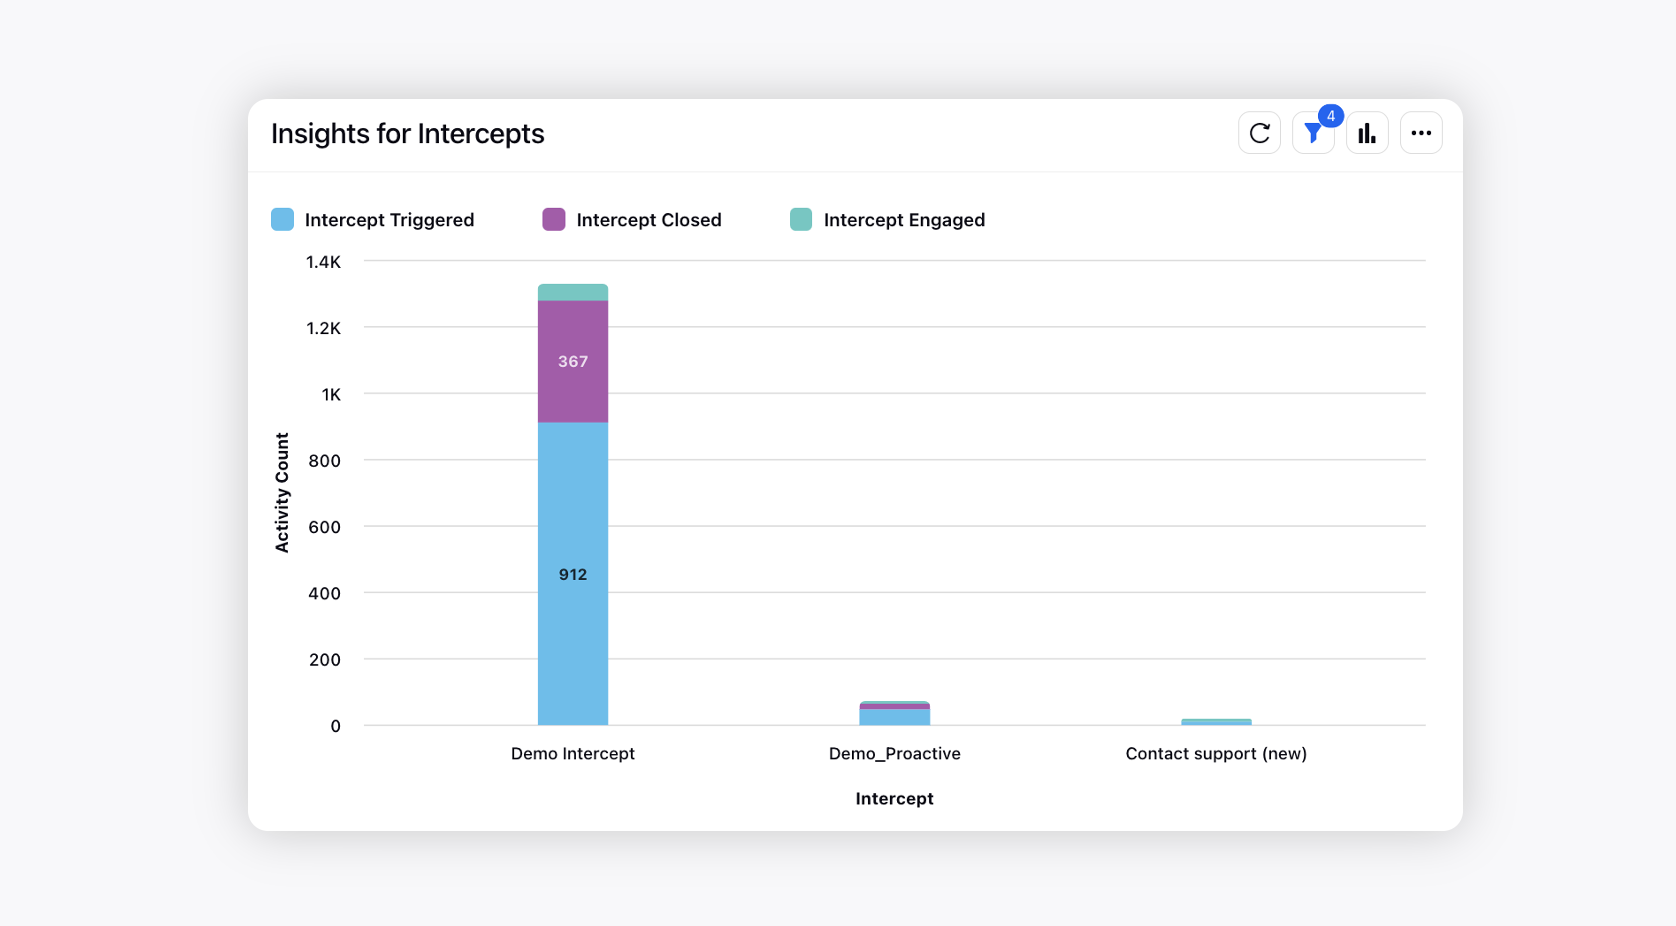
Inisghts for Intercepts | Split of the overall prompts applied based on the activity count | |
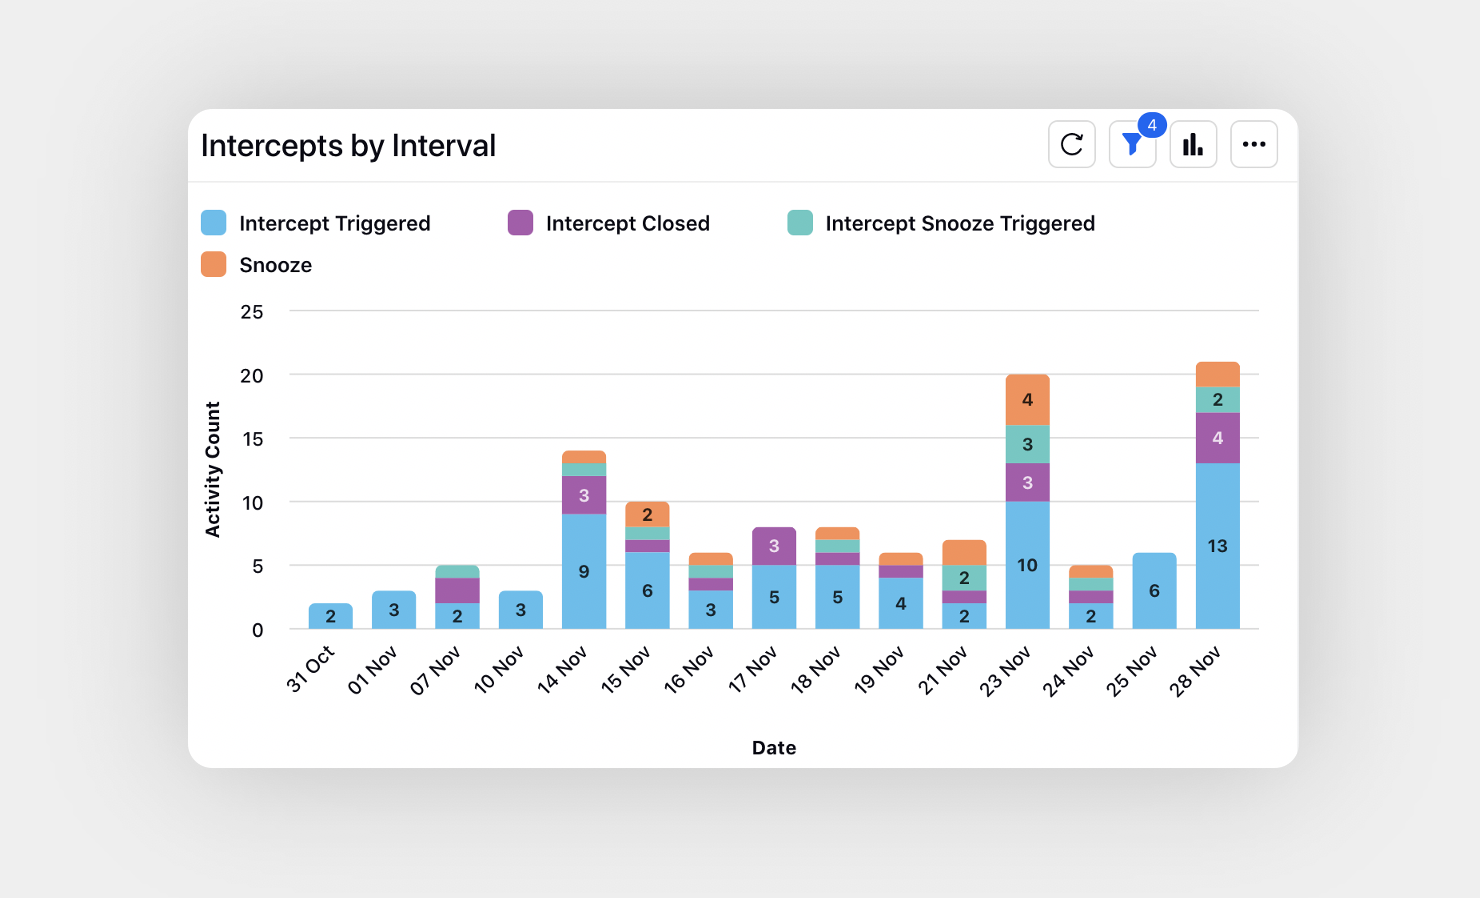
Insights by Interval | Split of the overall prompts applied based on the activity count | |
% Engaged | % engaged - type of prompt split | |
% Closed | % closed - type of prompt split | |
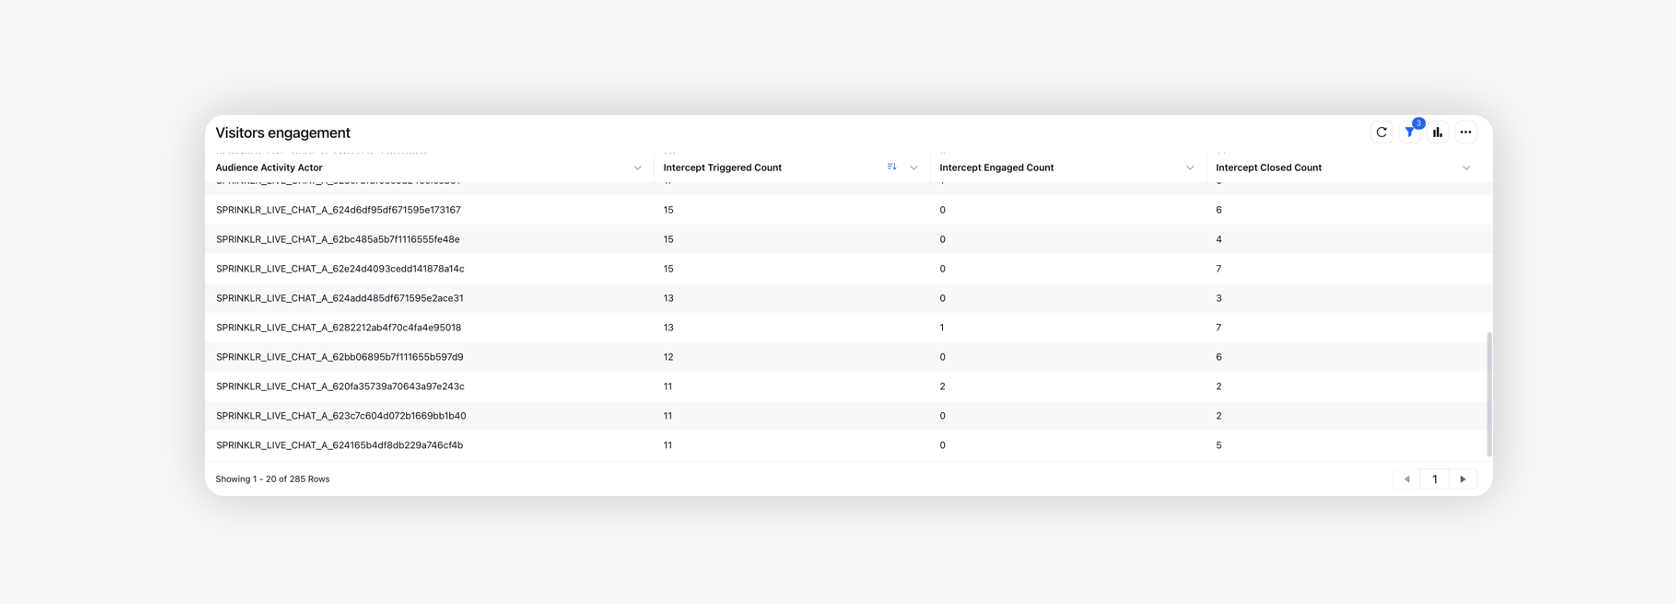
Visitors Engagement | Number of intercepts Triggered > Engaged > Closed funnel in each chat (against each chat ID) | |
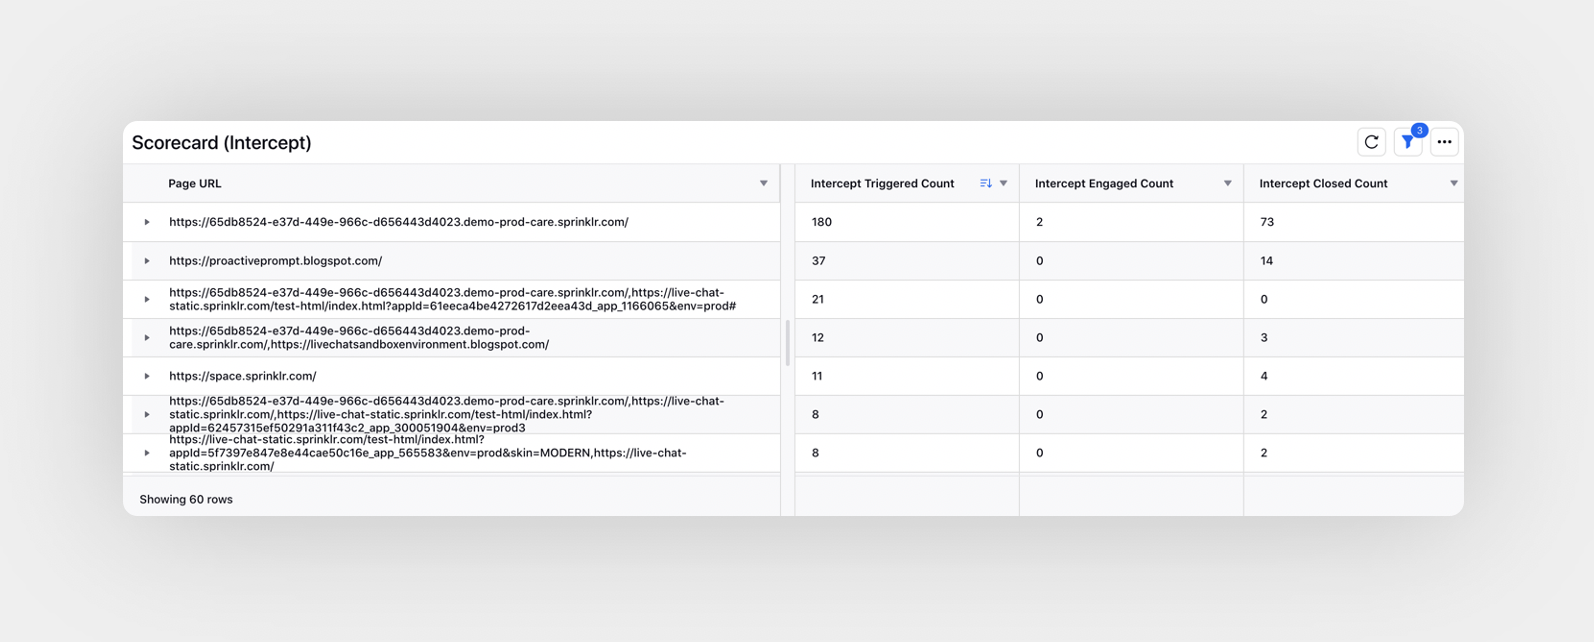
Scorecard (Intercept) | Number of Intercepts Triggered > Engaged > Closed funnel in page URL (against each URL) | |
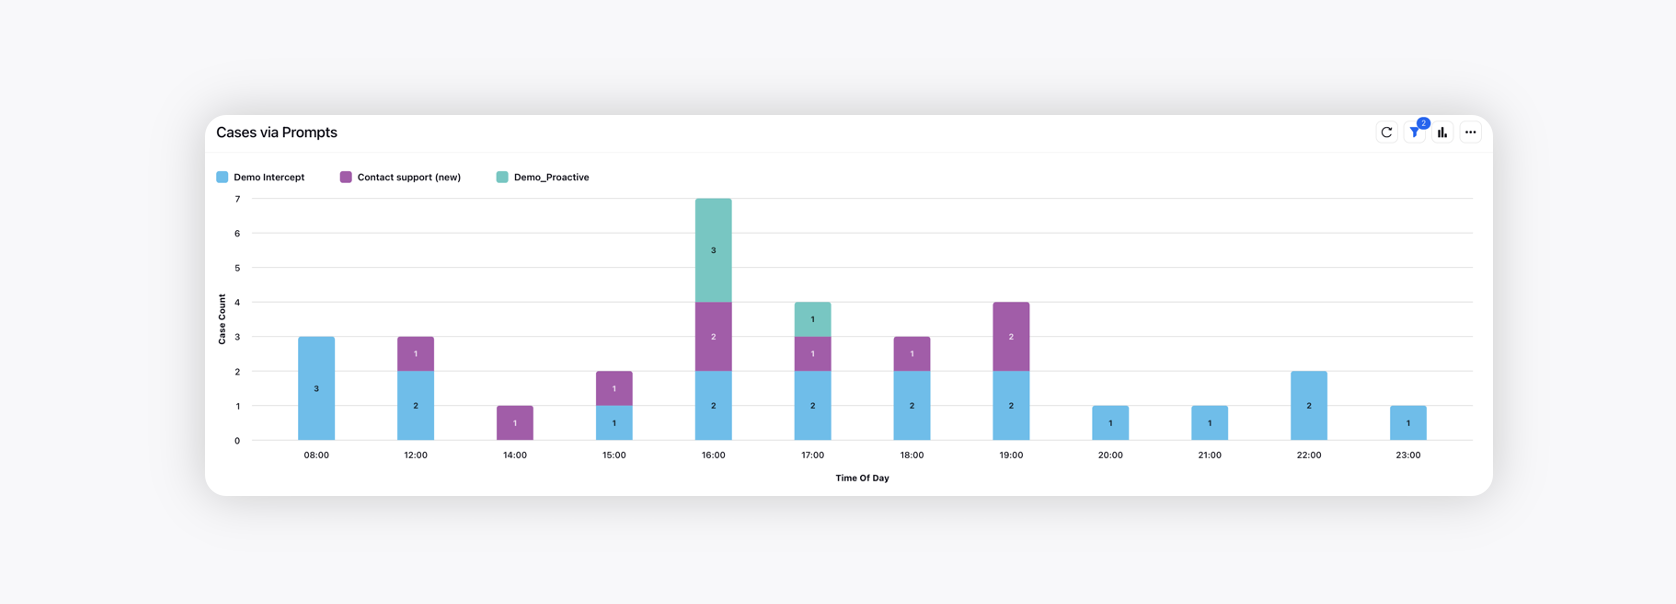
Cases via Prompts | Number of cases those were triggered through prompts across time of the day | |
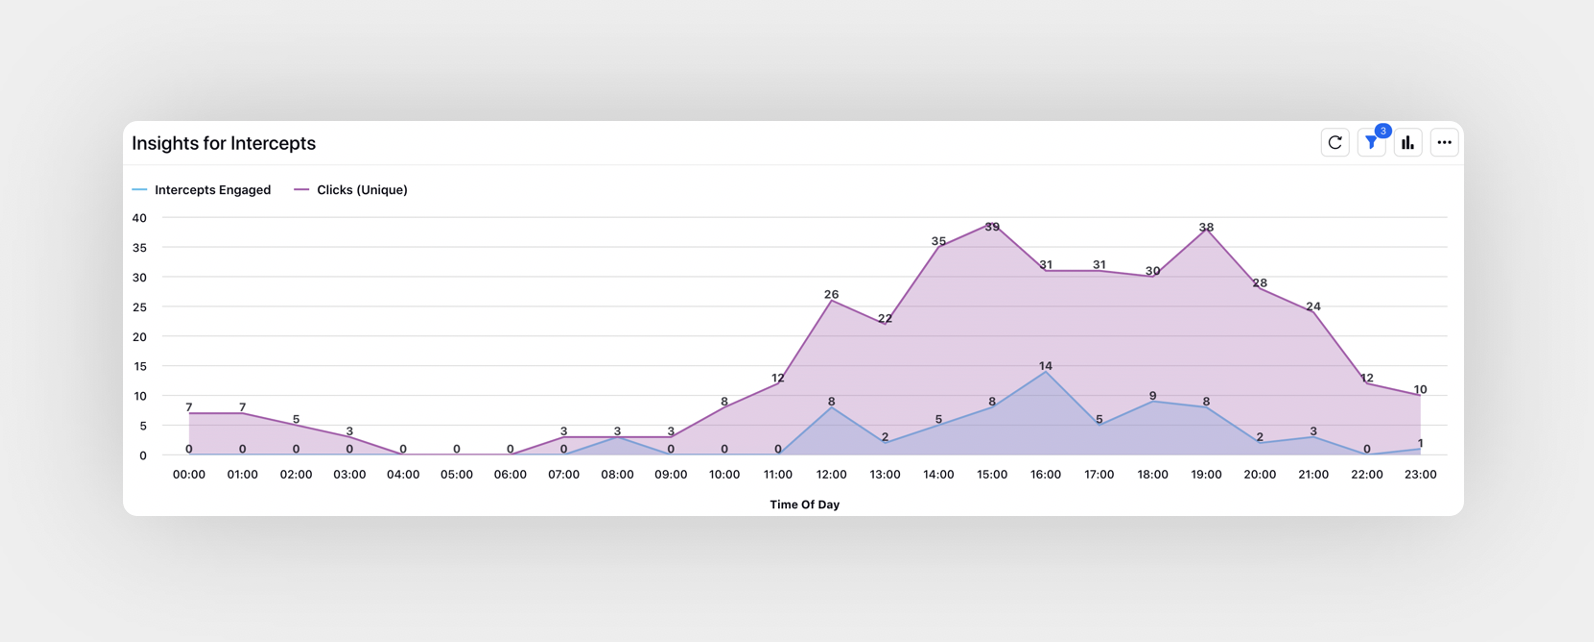
Insights for Intercepts | Number of intercepts engaged w.r.t. unique live chat clicks across time of the day | |
Live Chat Volume
Wigets | Description | Image |
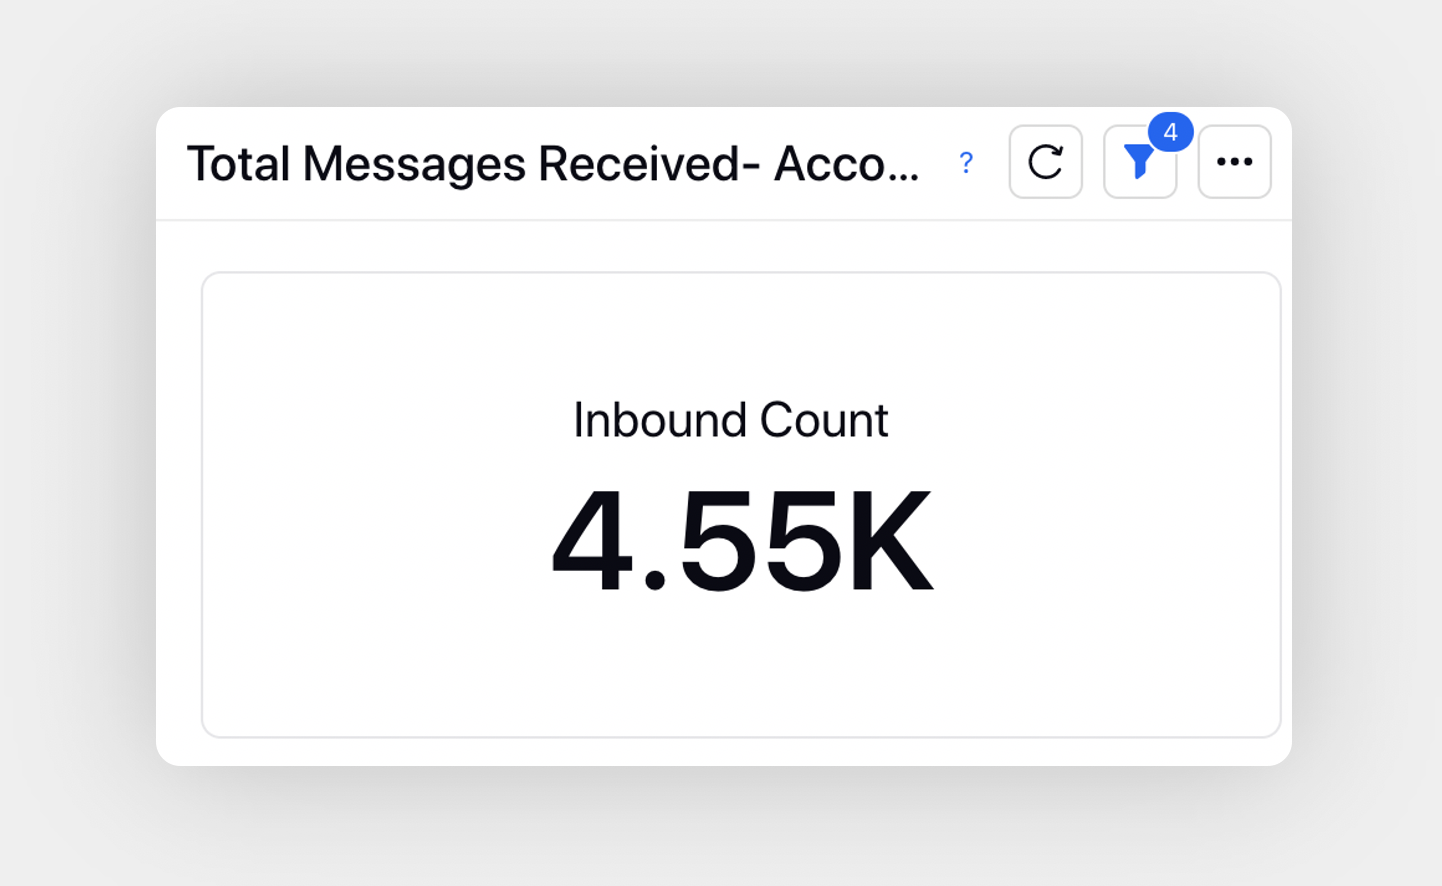
Total Messages Received - Account | The volume of total messages received from all the channels | |
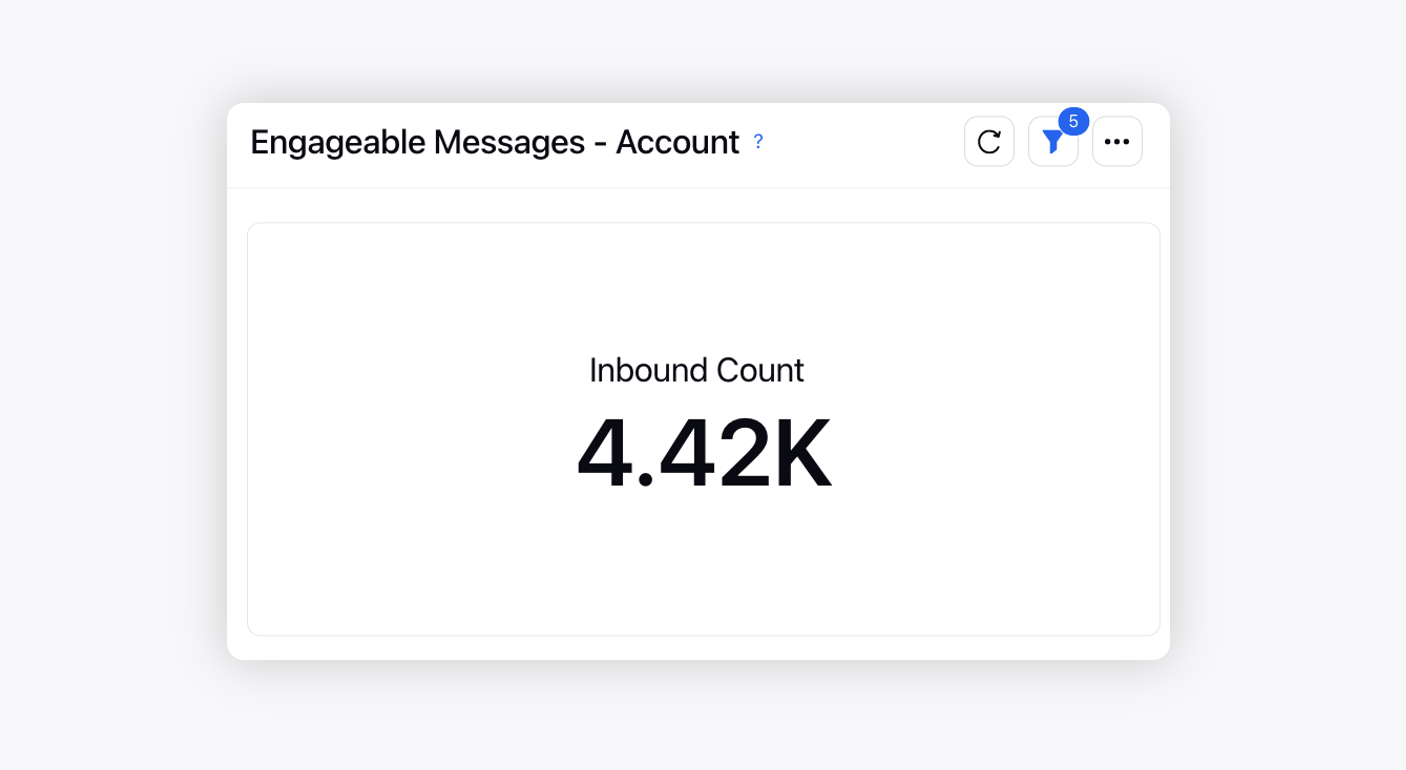
Engageable Messages - Account | Total messages which requires action. Fan (Inbound) messages tagged as Engageable by Intuition Moderation | |
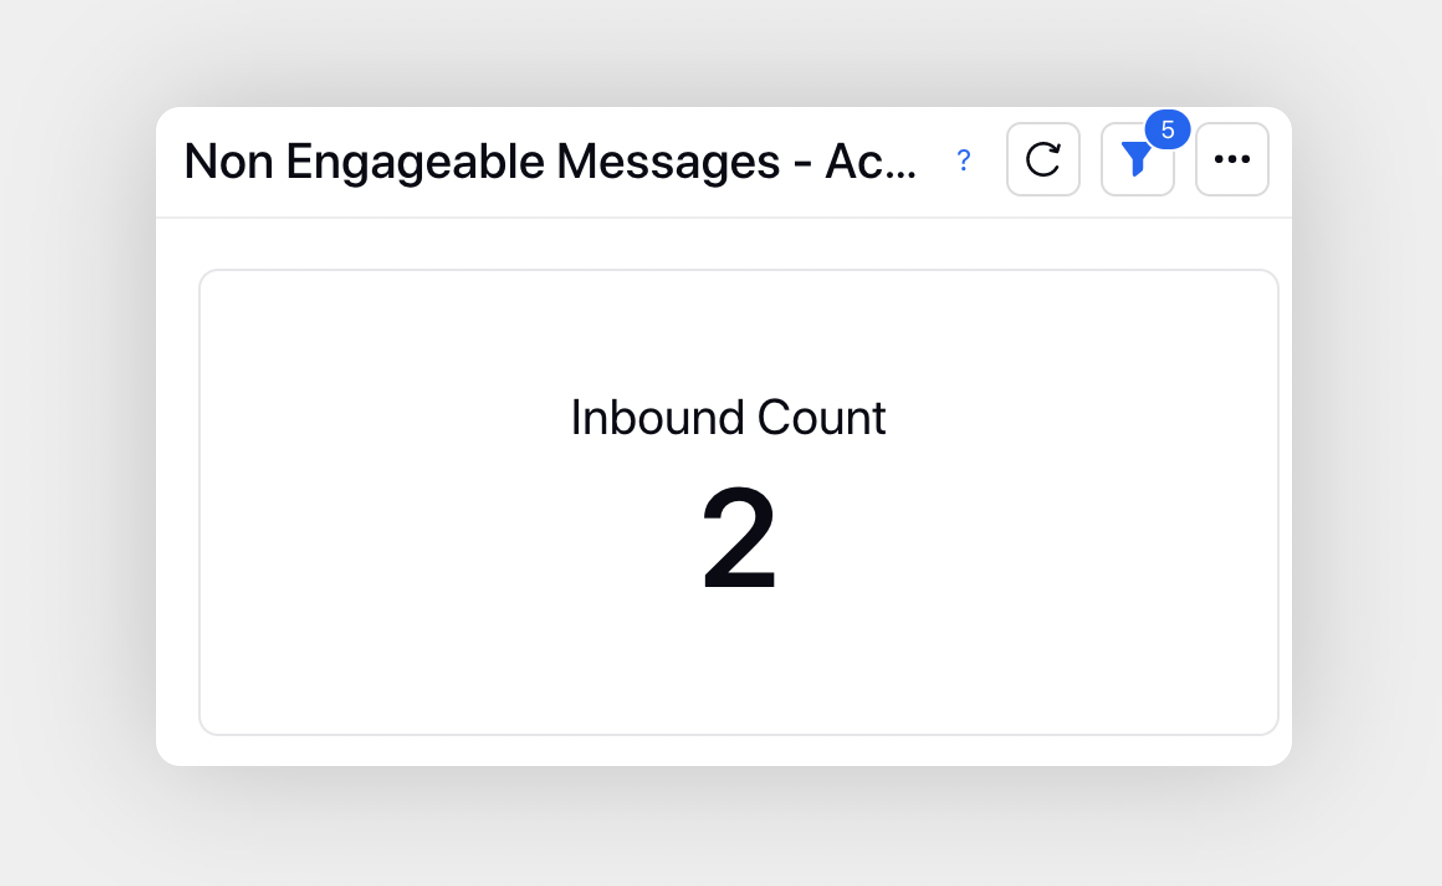
Non Engageable Messages - Account | Message count for which no action is needed. Fan (Inbound) messages tagged as Non-Engageable by Intuition Moderation | |
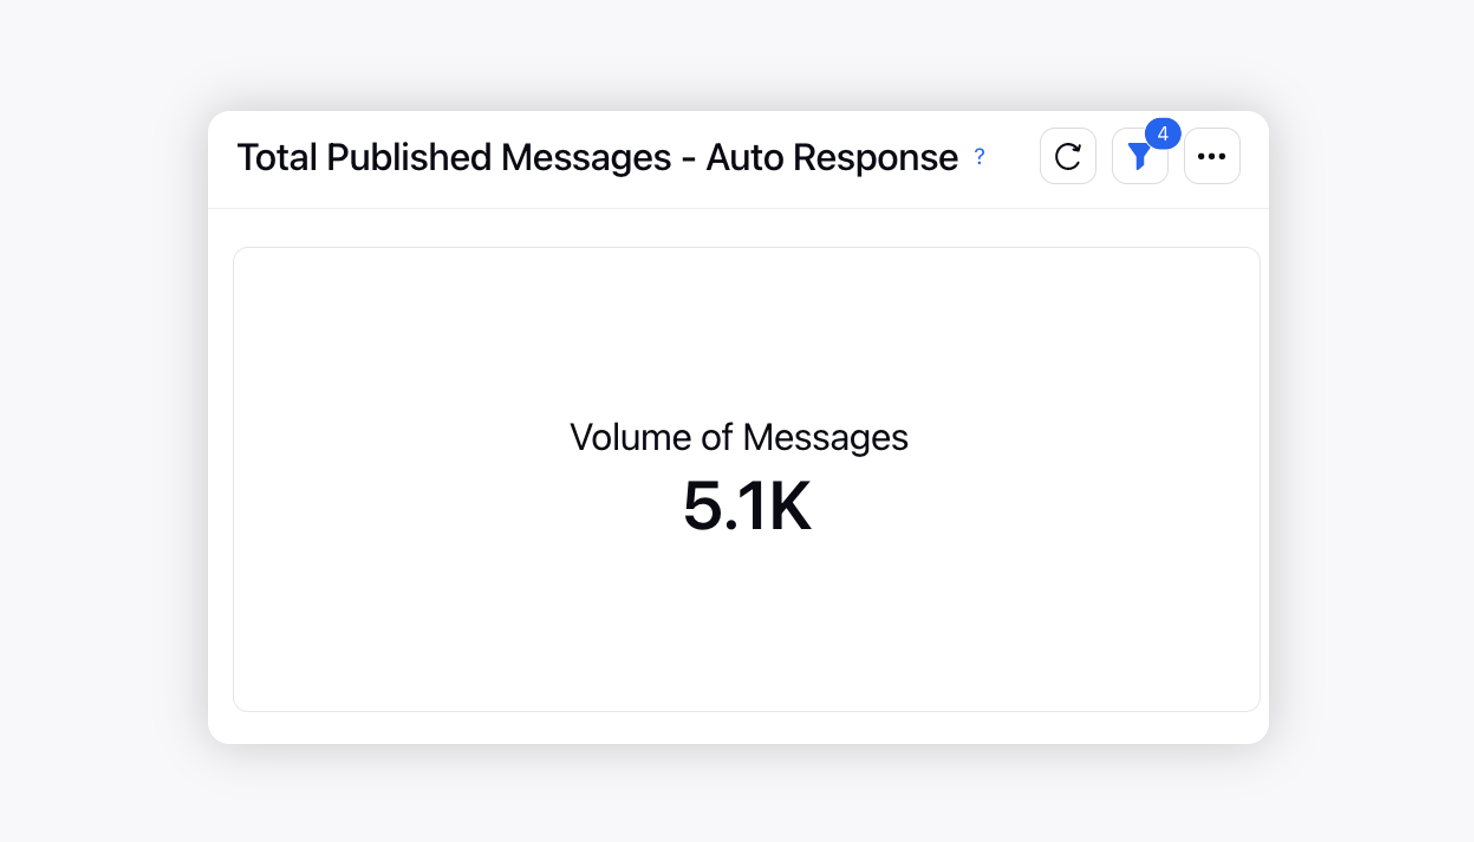
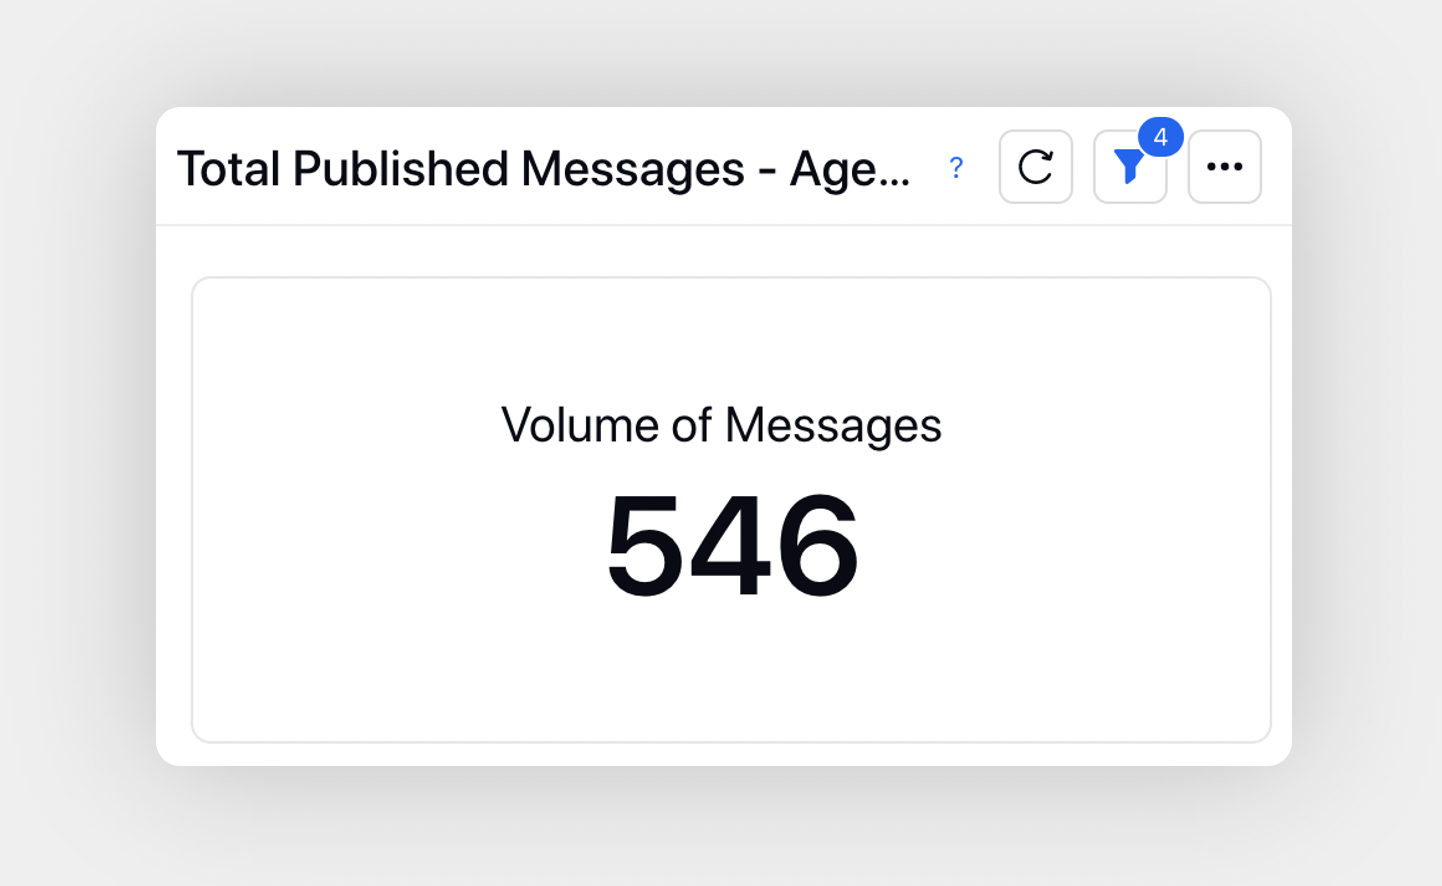
Total Published Messages - Auto Response | The volume of total messages published by the brand | |
Total Published Messages - Agent Responses | The volume of total messages published by the brand | |
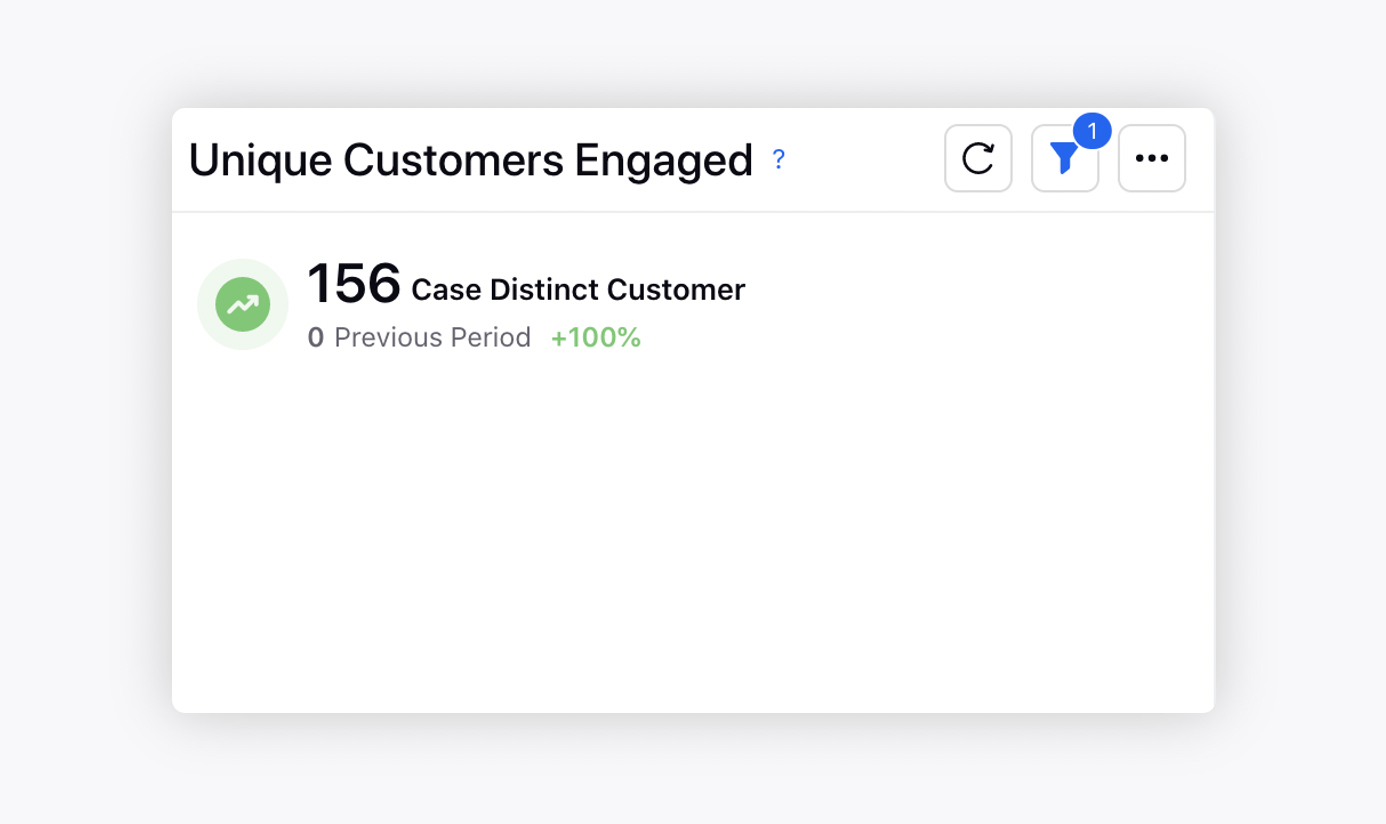
Unique Customers Engaged | Count of unique customers engaged on cases | |
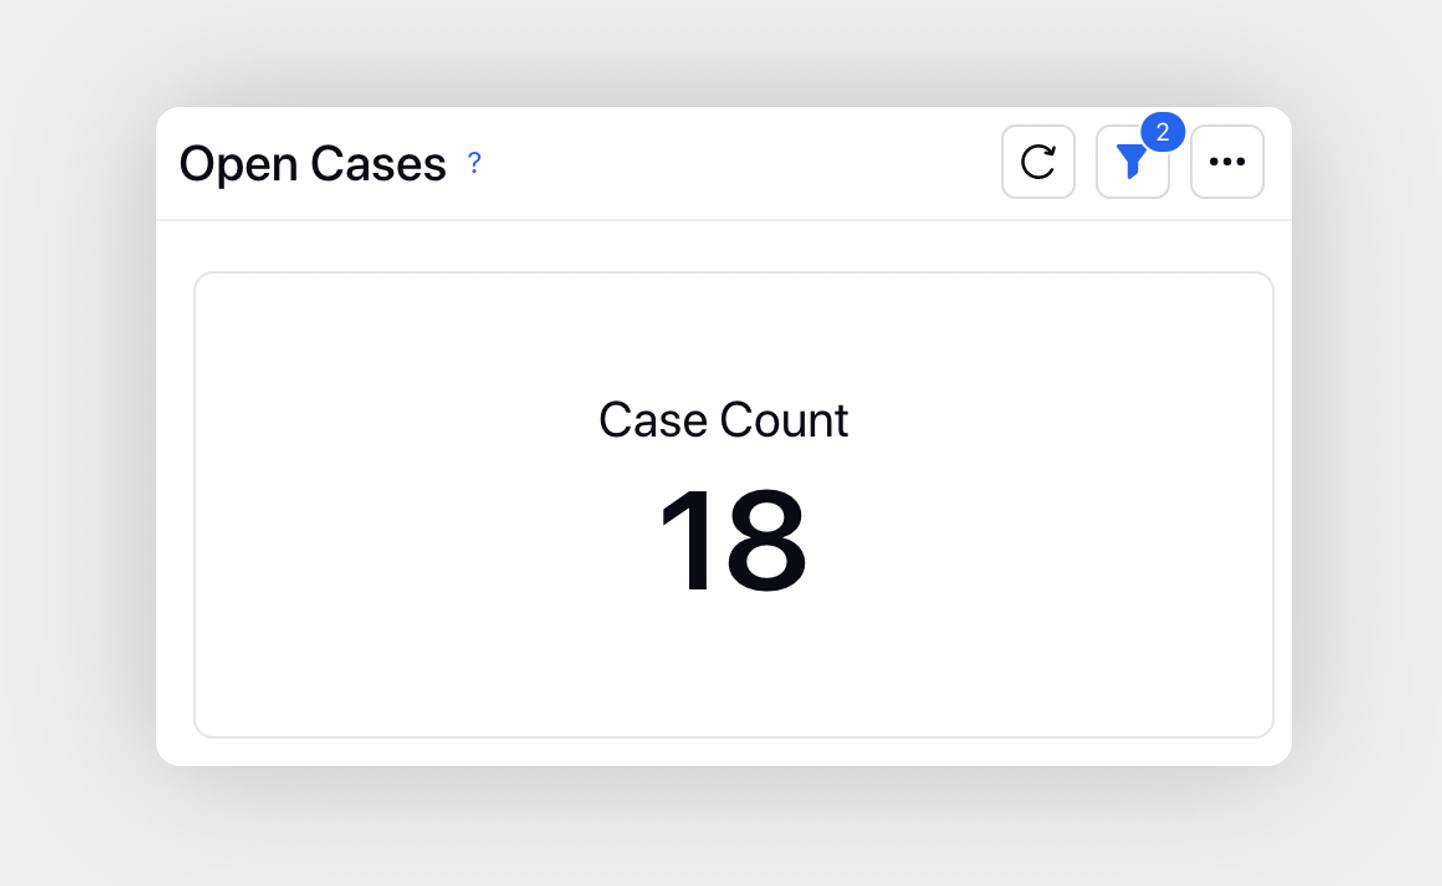
Open Cases | Total number of working cases. Filters: Status containing Responded-Awaiting Reply, Awaiting Reply and Assigned | |
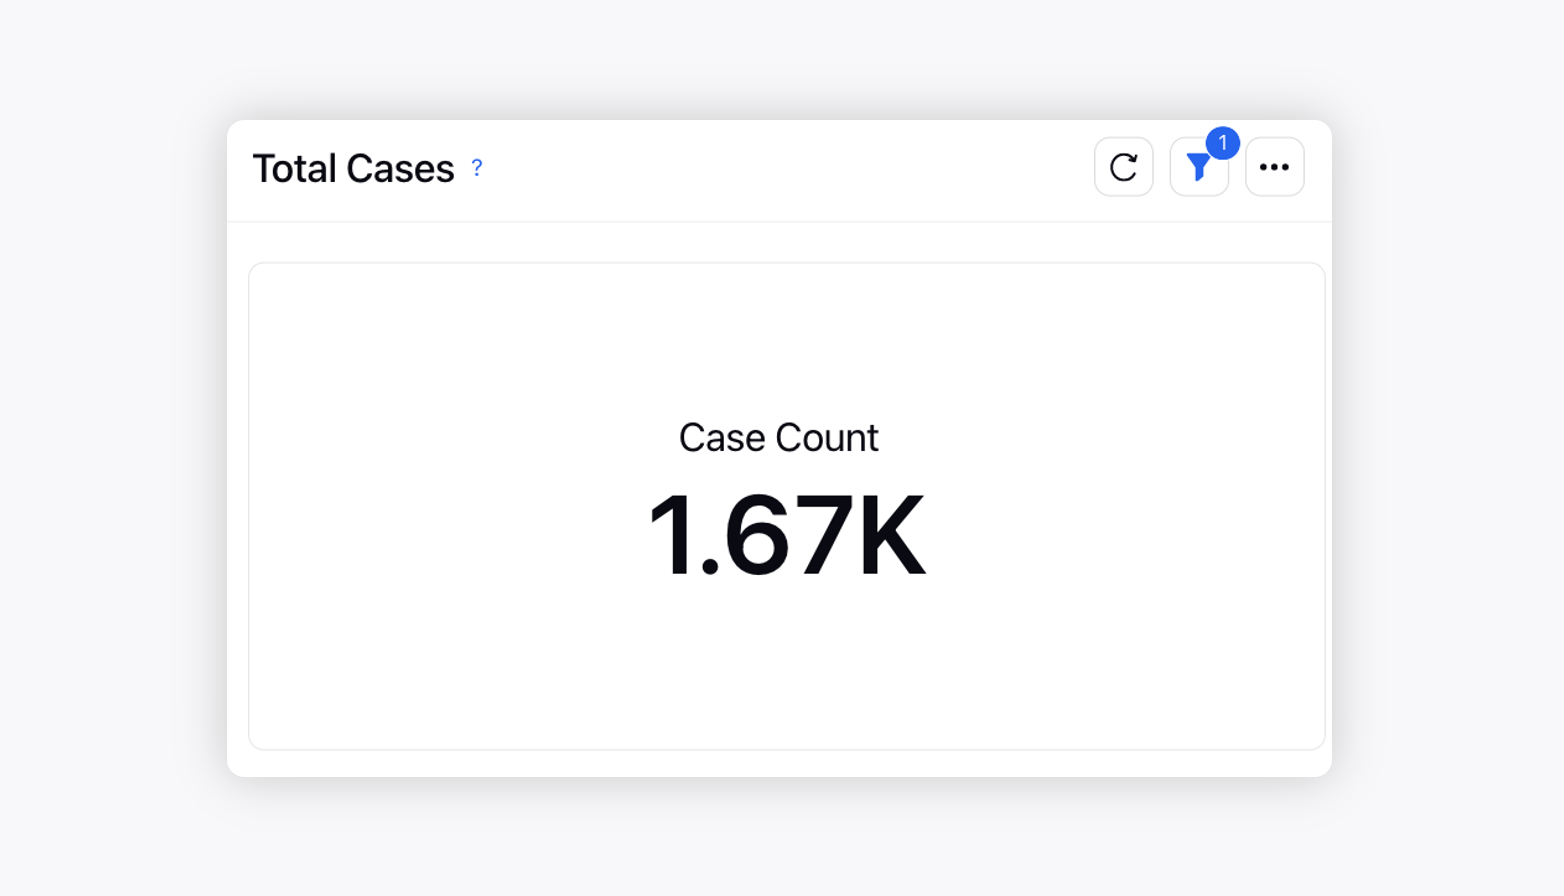
Total Cases | Total number of cases in given time filter duration | |
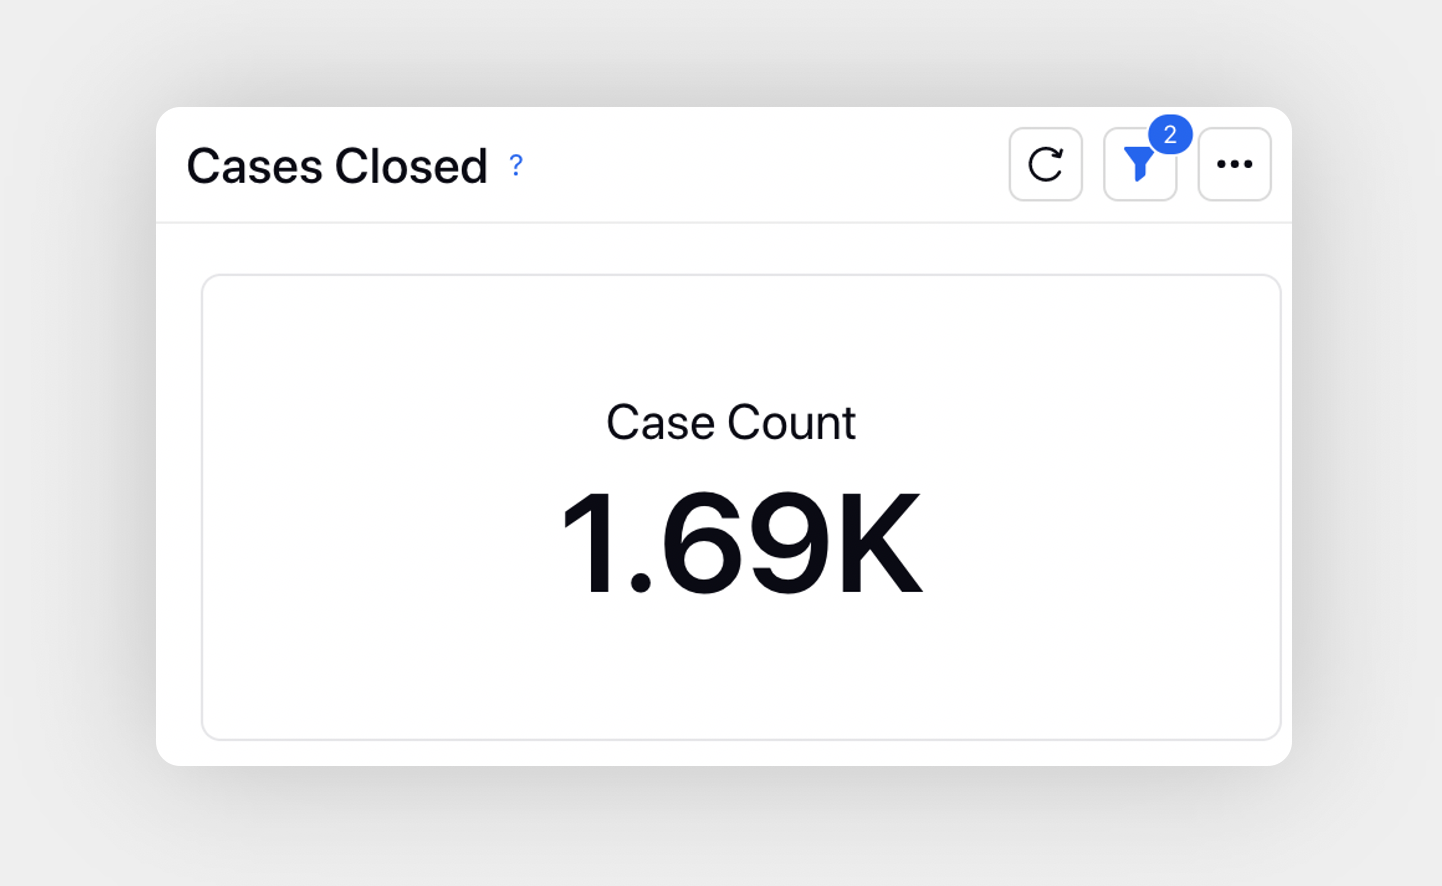
Closed Cases | Total number of cases closed. Filters: Status containing Closed, Auto Closed and No Response Required, Closed | |
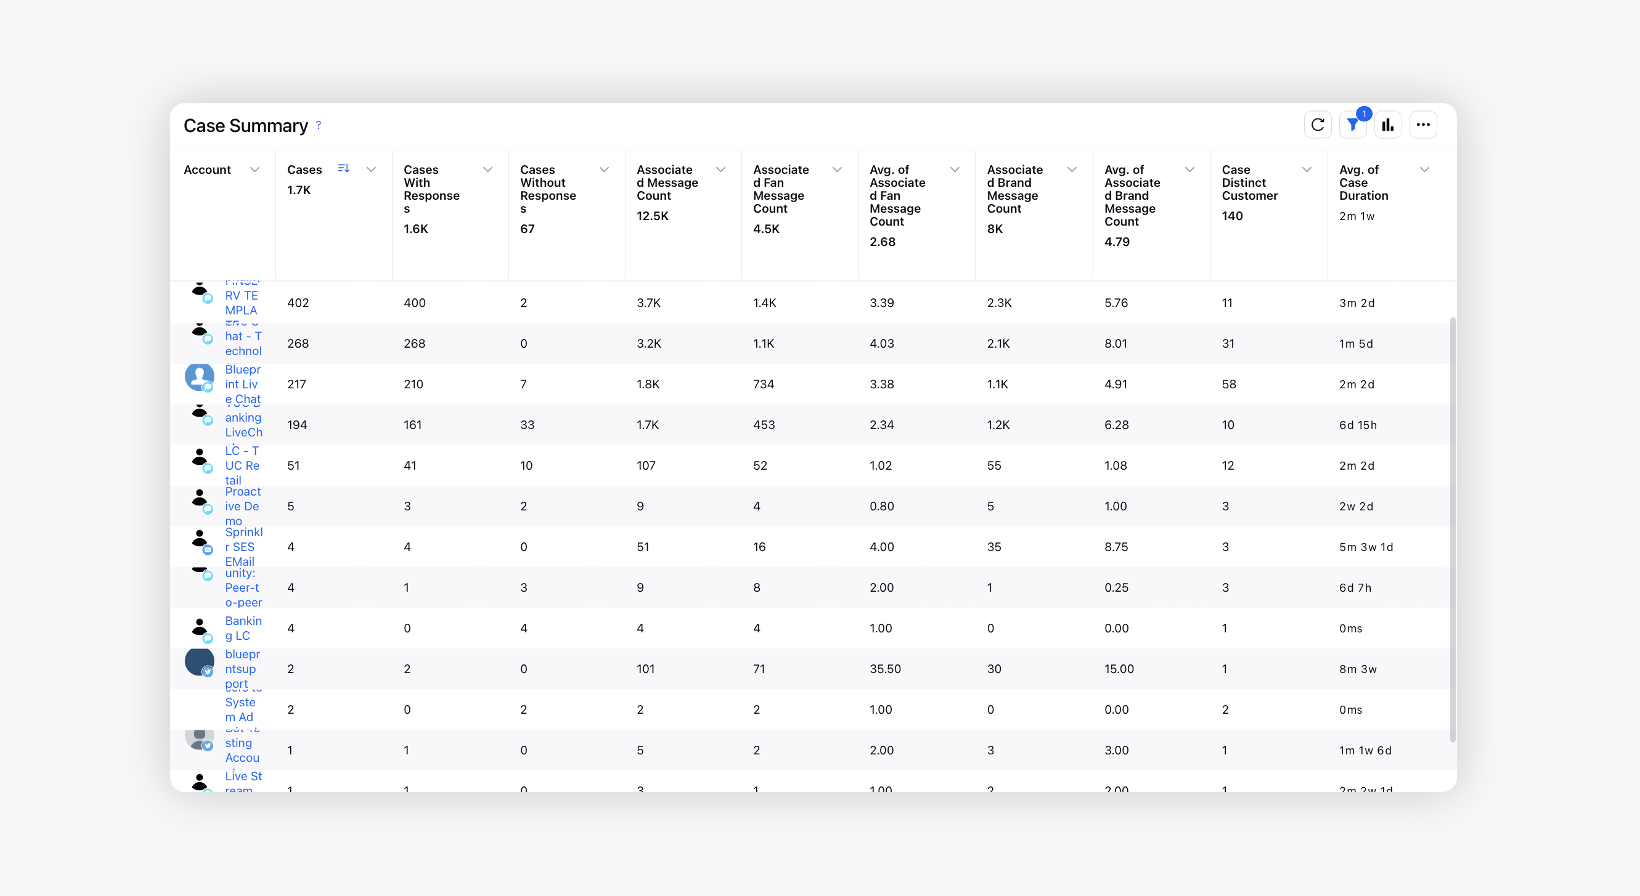
Case Summary | Gives you overview of Case Volume, Case Duration & Message Count w.r.t Live Chat Account | |
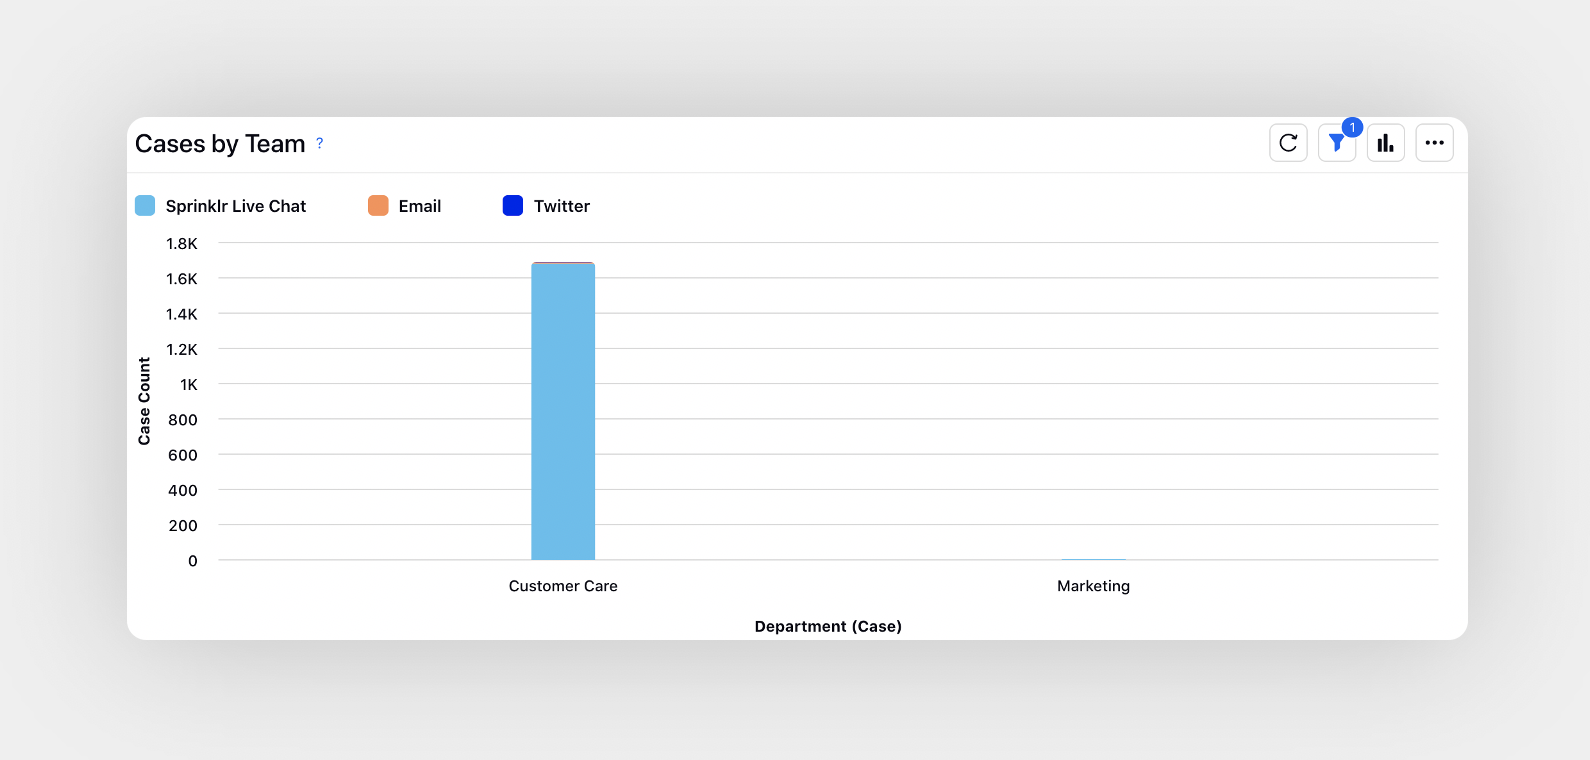
Cases by Team | Number of cases categorized by the handling teams | |
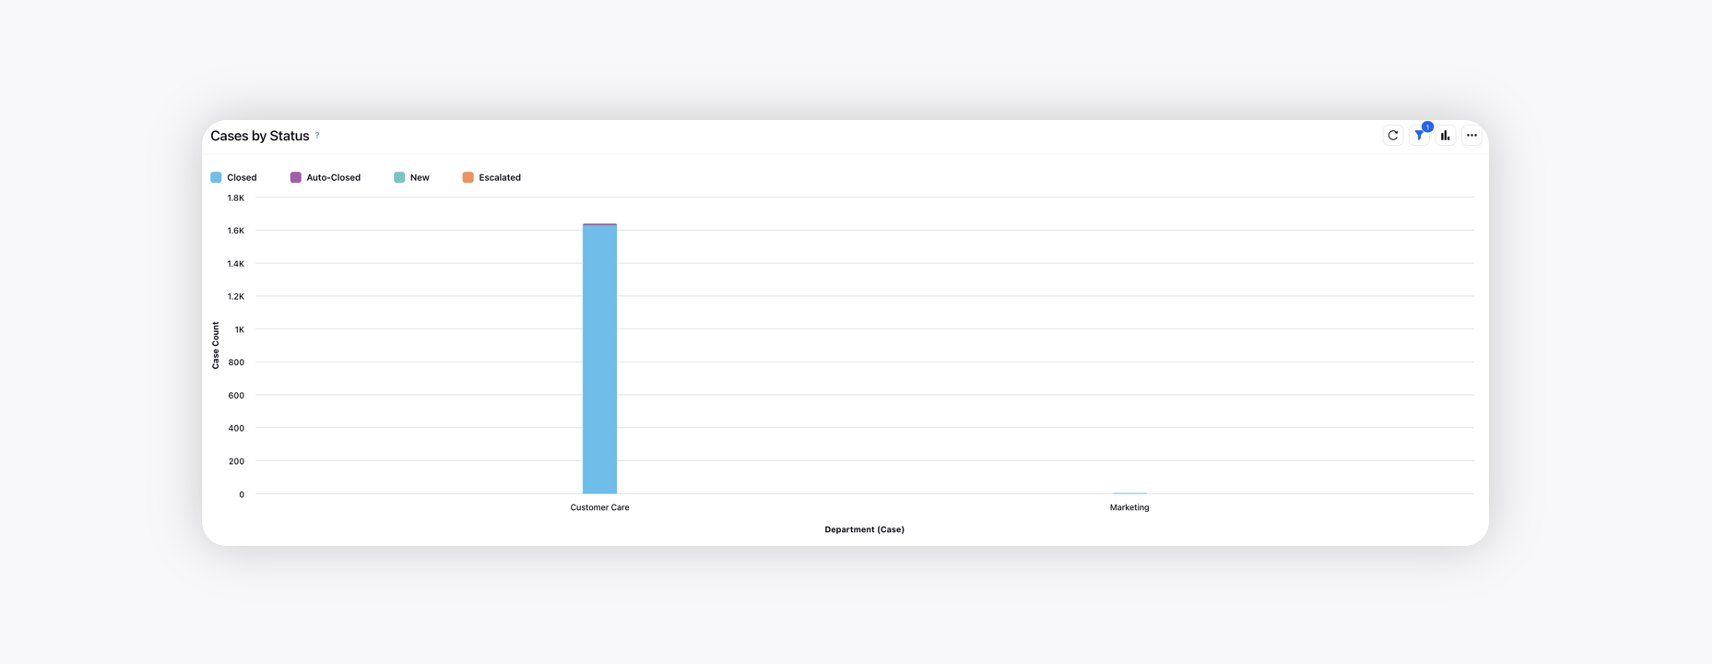
Cases by Status | Number of cases categorized by the case status | |
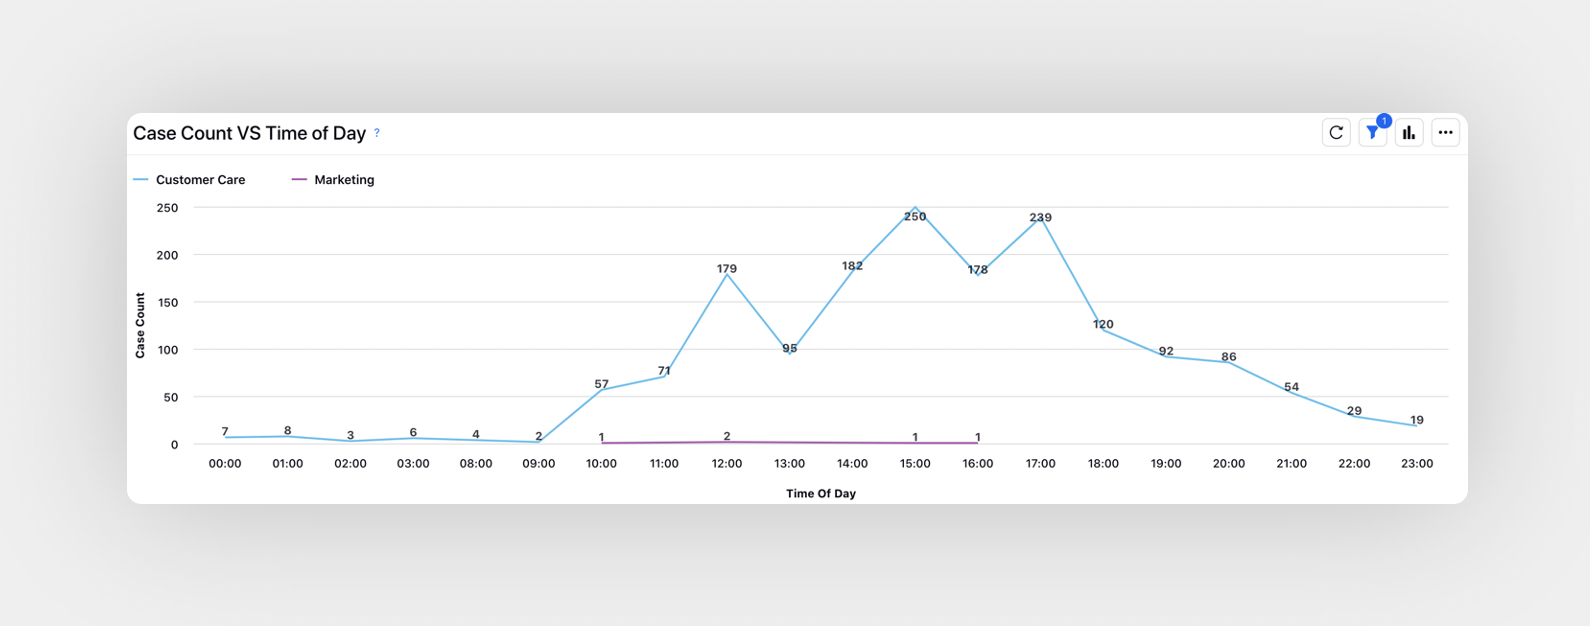
Case Count vs. Time of Day | Number of cases plotted against time of day | |
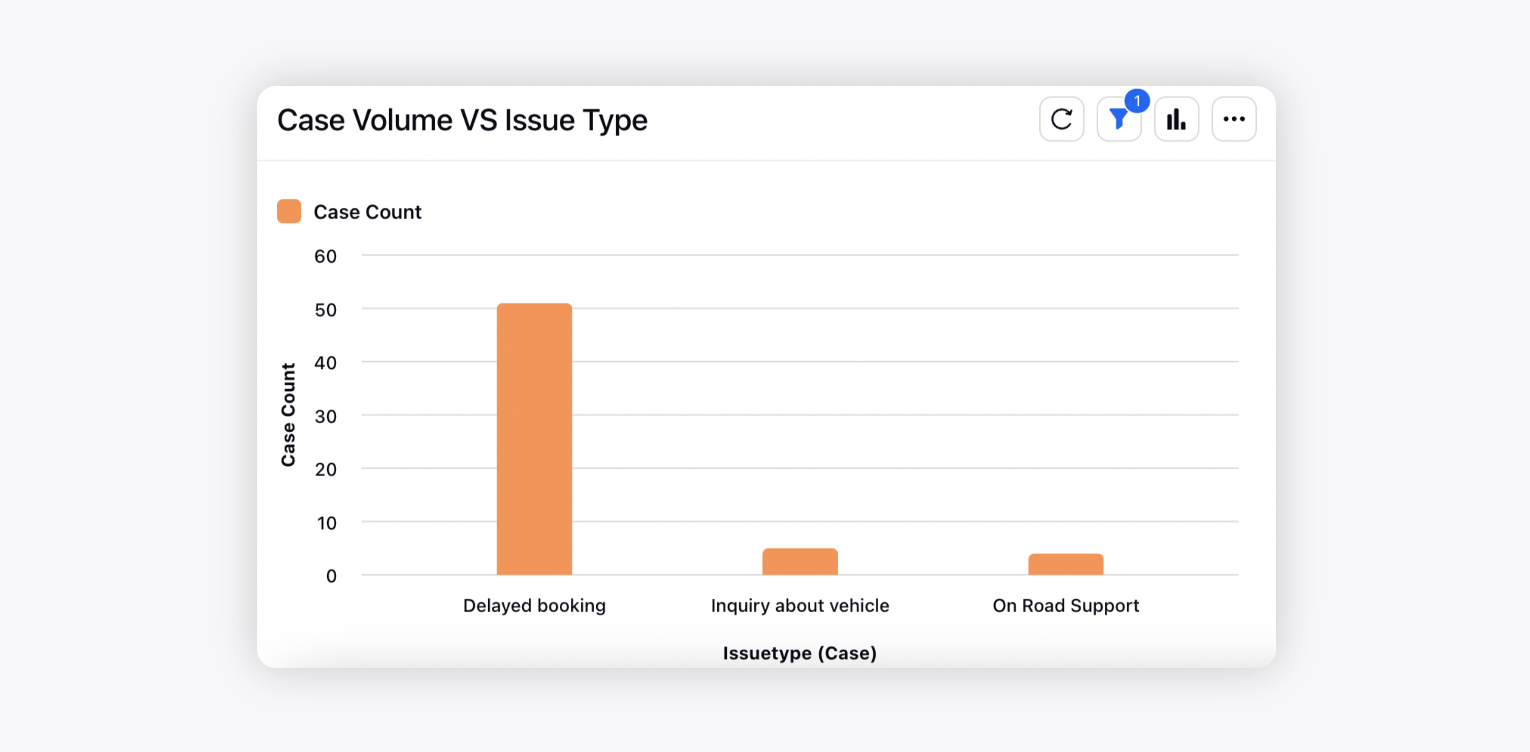
Case Volume vs. Issue Type | Number of cases categorized by the issue type | |
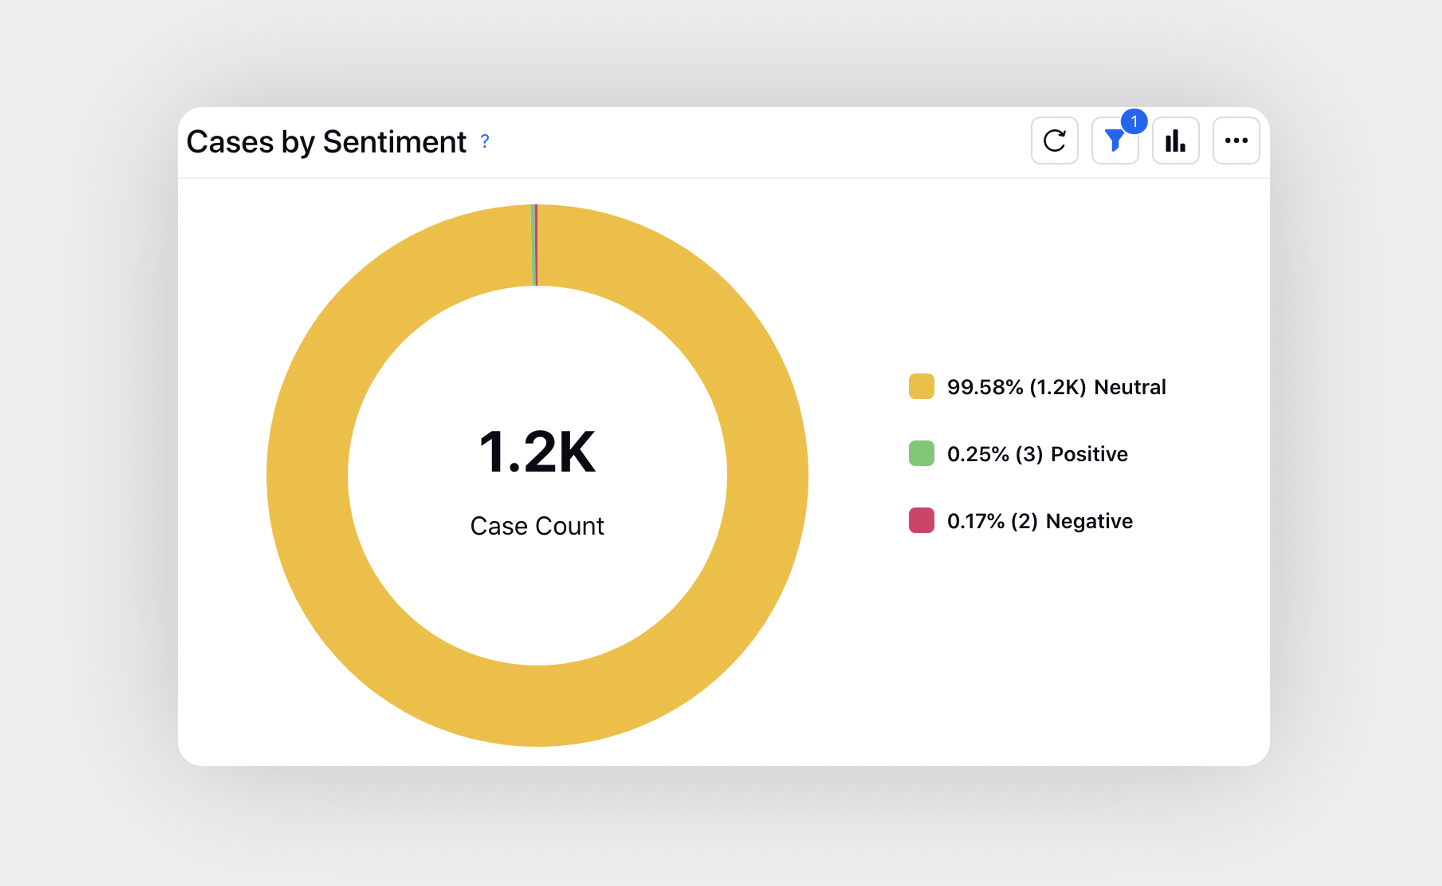
Cases by Sentiment | Total cases catgeorized by sentiment | |
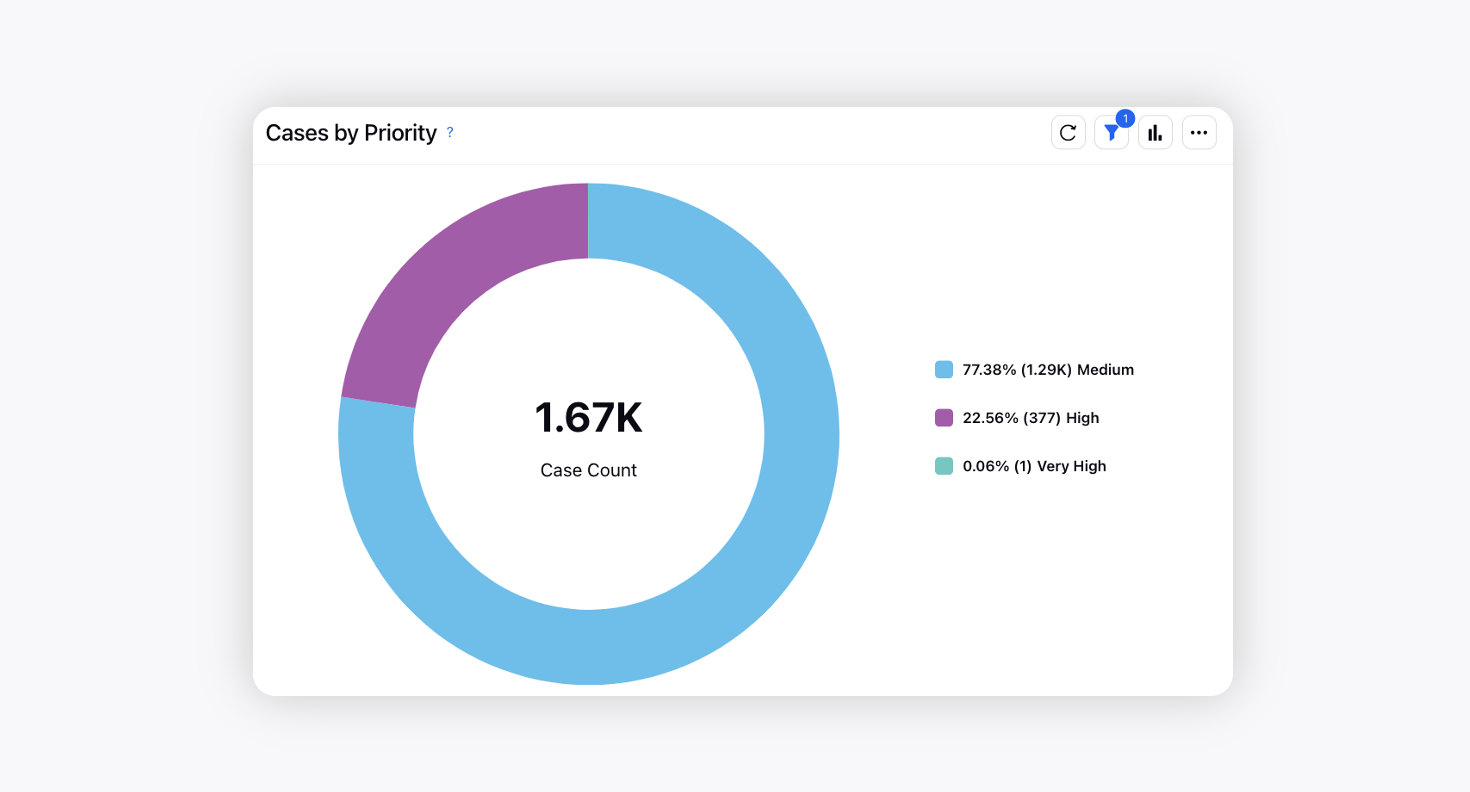
Cases by Priority | Total cases categorized by case priority | |
Live Chat SLA
Widget | Description | Dimensions |
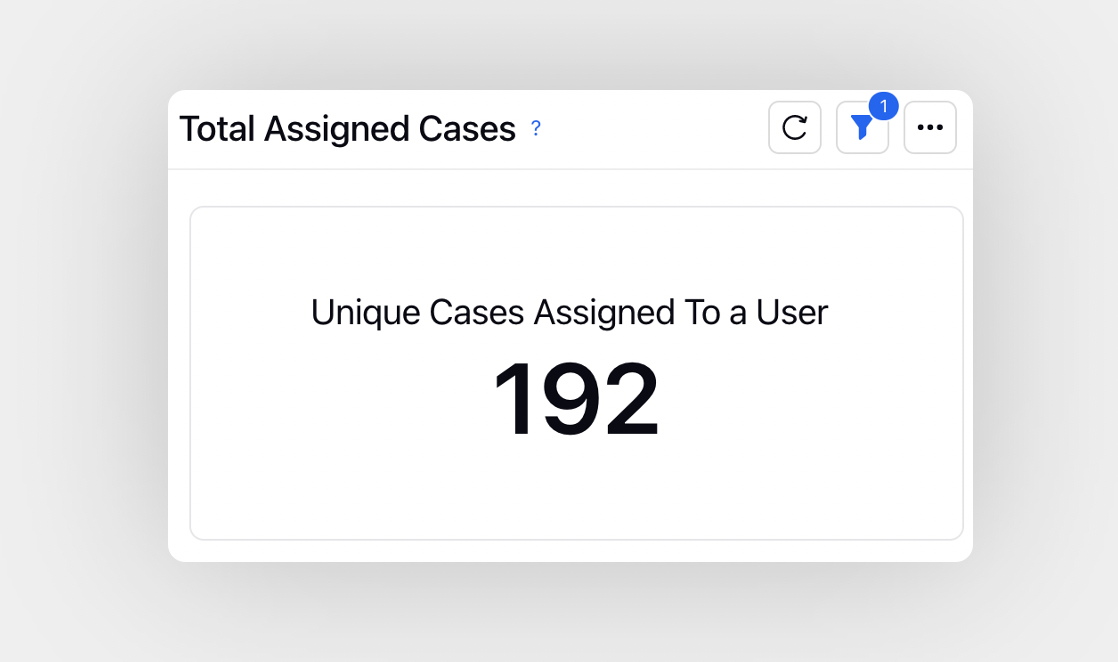
Total Assigned Cases | Total number of unique cases assigned to a user within the given time frame | |
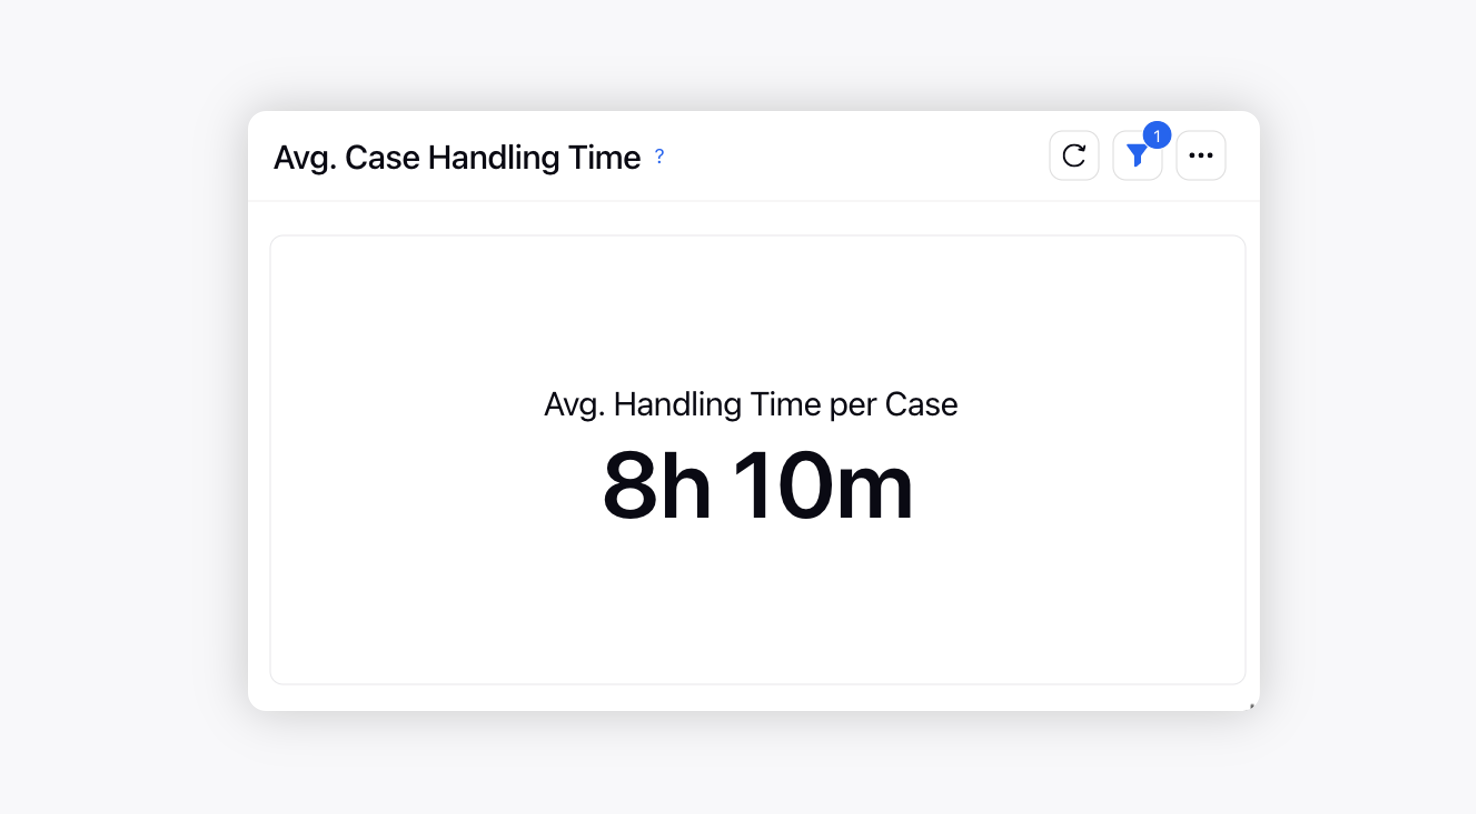
Avg. Case Handling Time | Amount of time spent by the assigned agent on the case | |
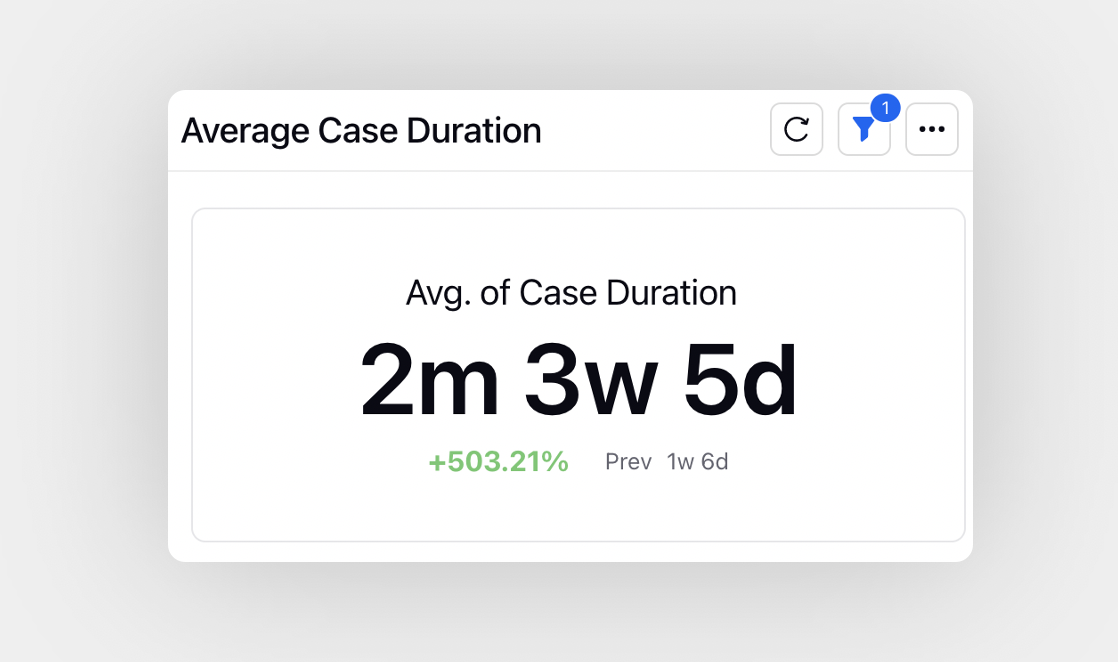
Average Case Duration | Time difference between the first and last message associated with a case | |
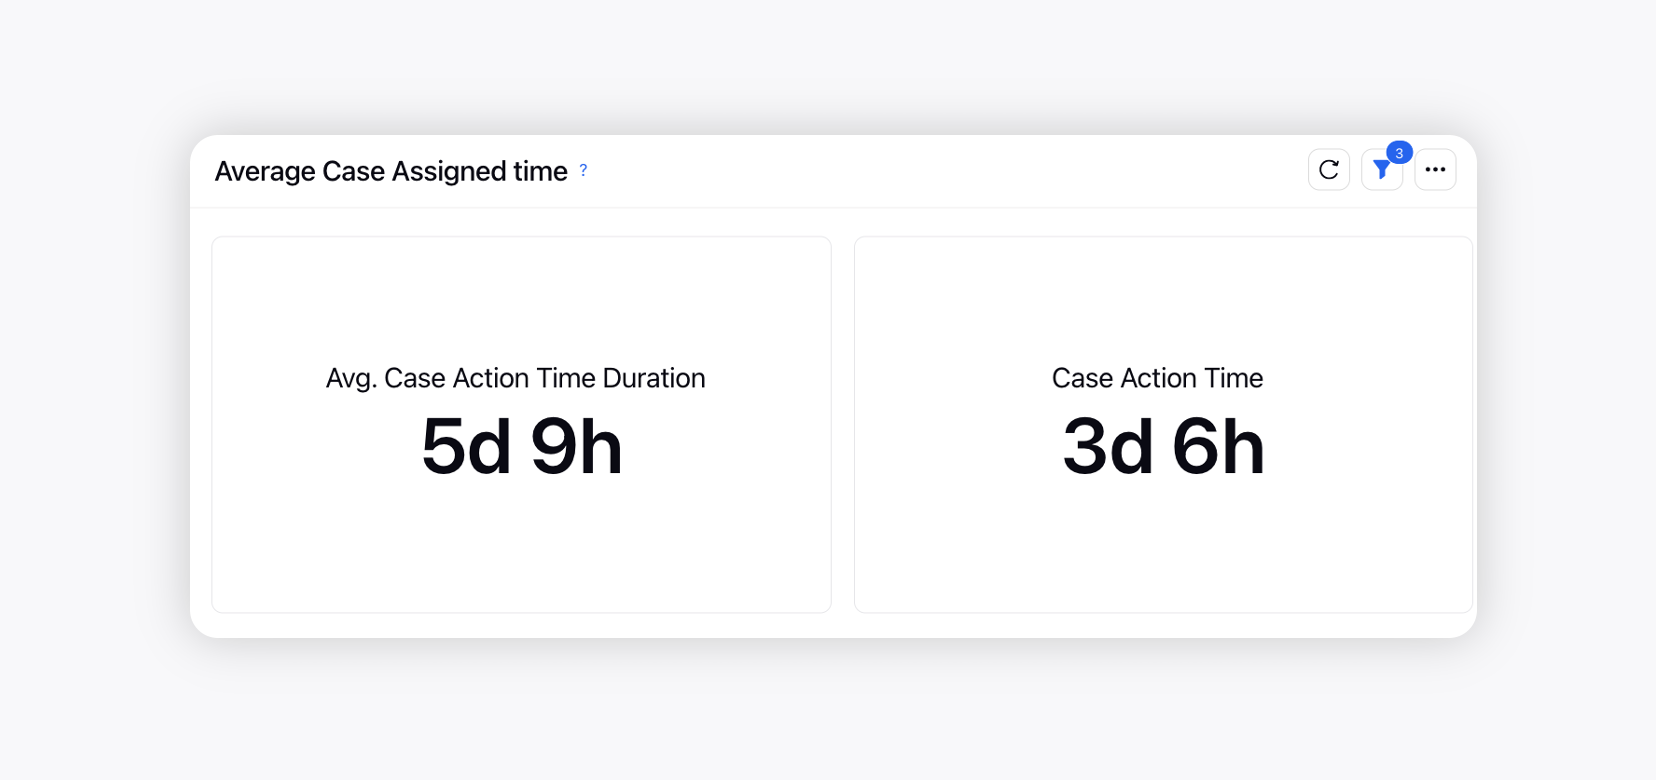
Average Case Assigned Time | Time difference between user assignment and action time on a case | |
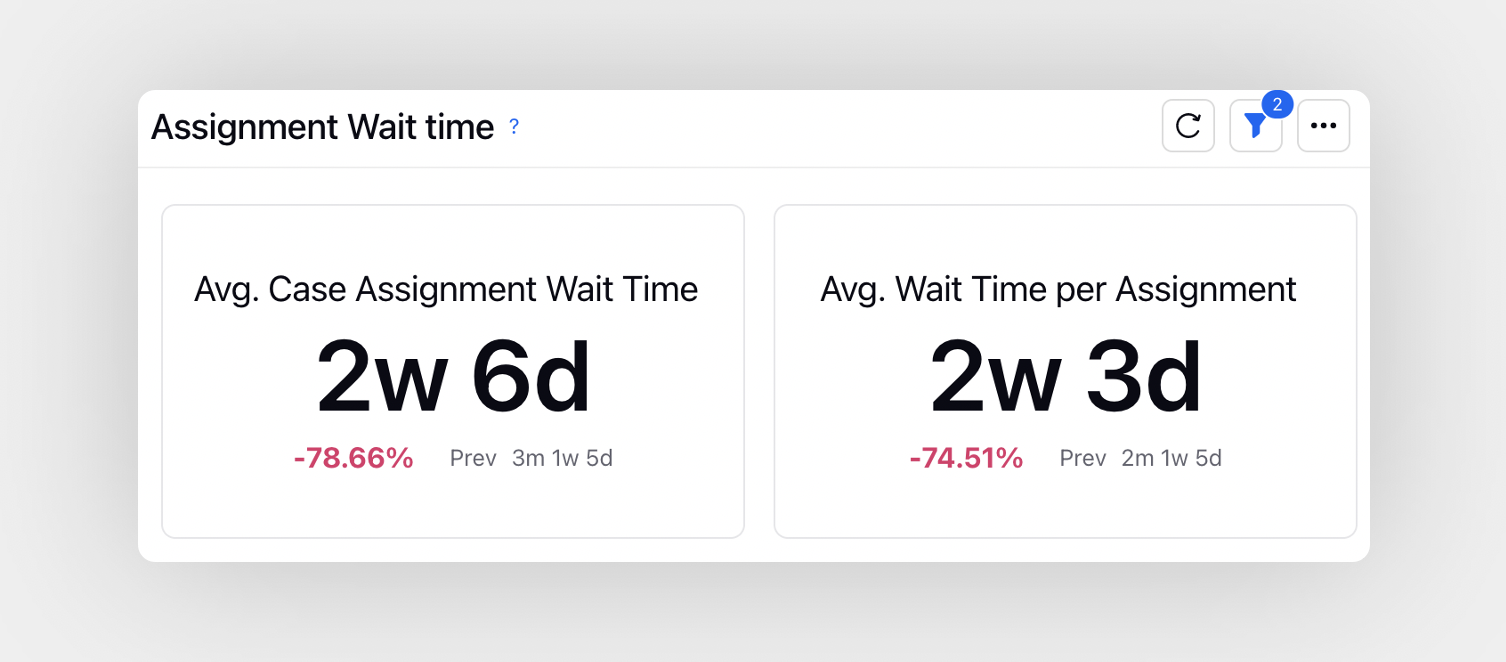
Assignment Wait Time | Average time cases wait in Awaiting Assignment queue to get assigned to a user | |
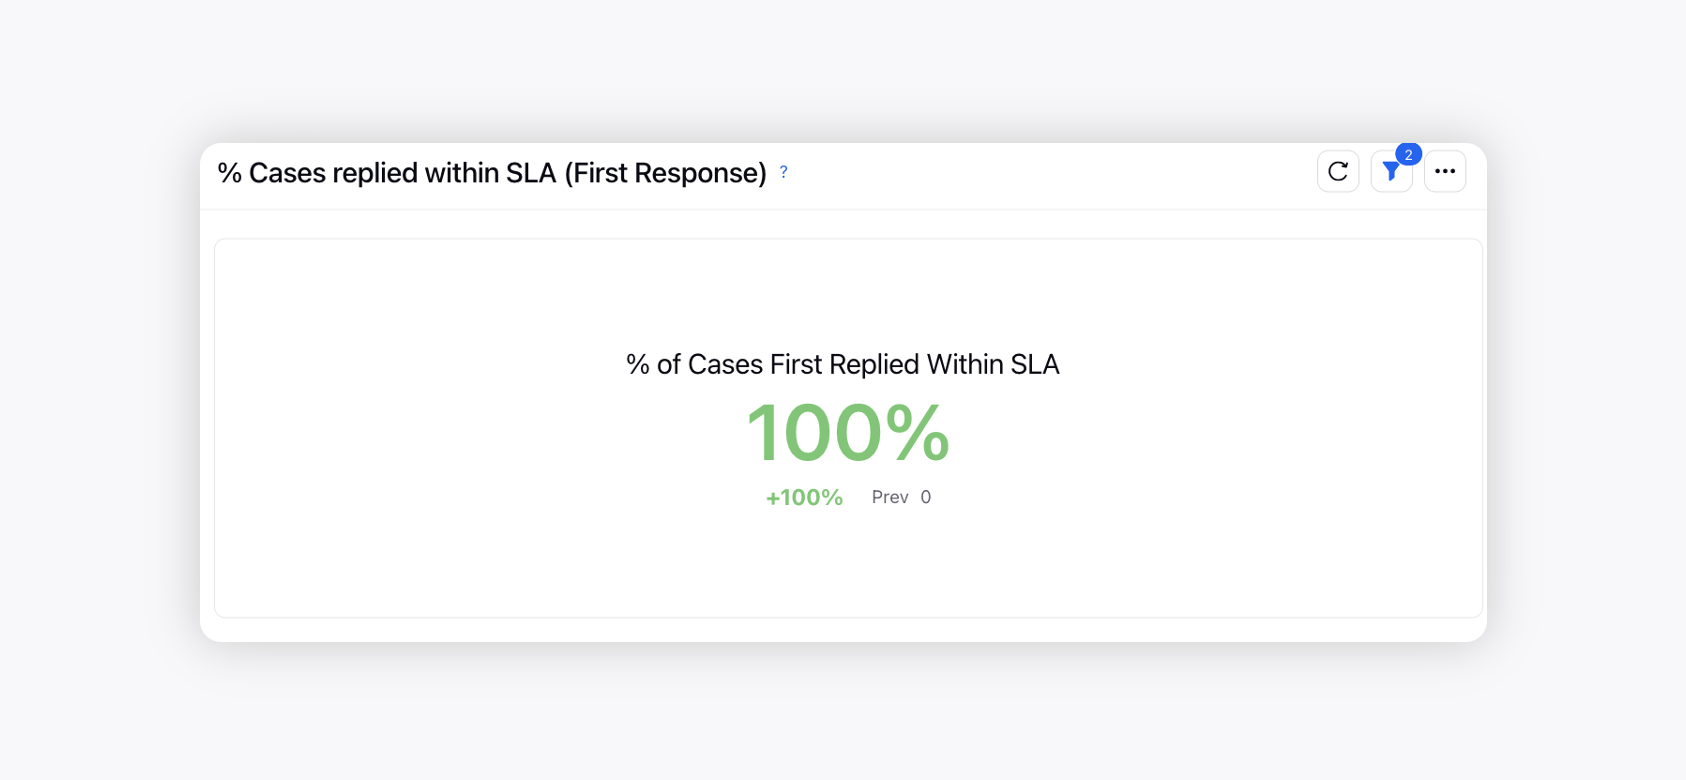
% Cases Replied within SLA (First Response) | % of cases first responded within SLA considering only user response | |
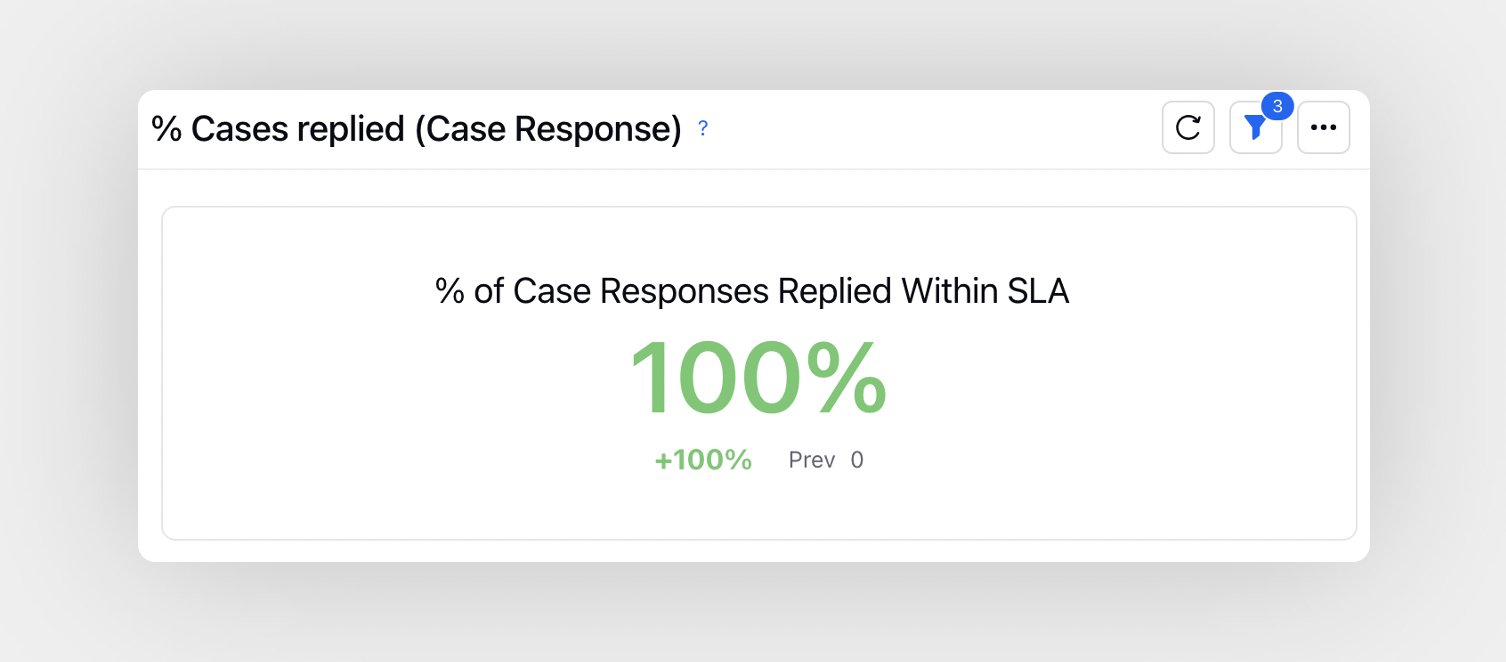
% Cases Replied (Case Response) | % cases replied within SLA | |
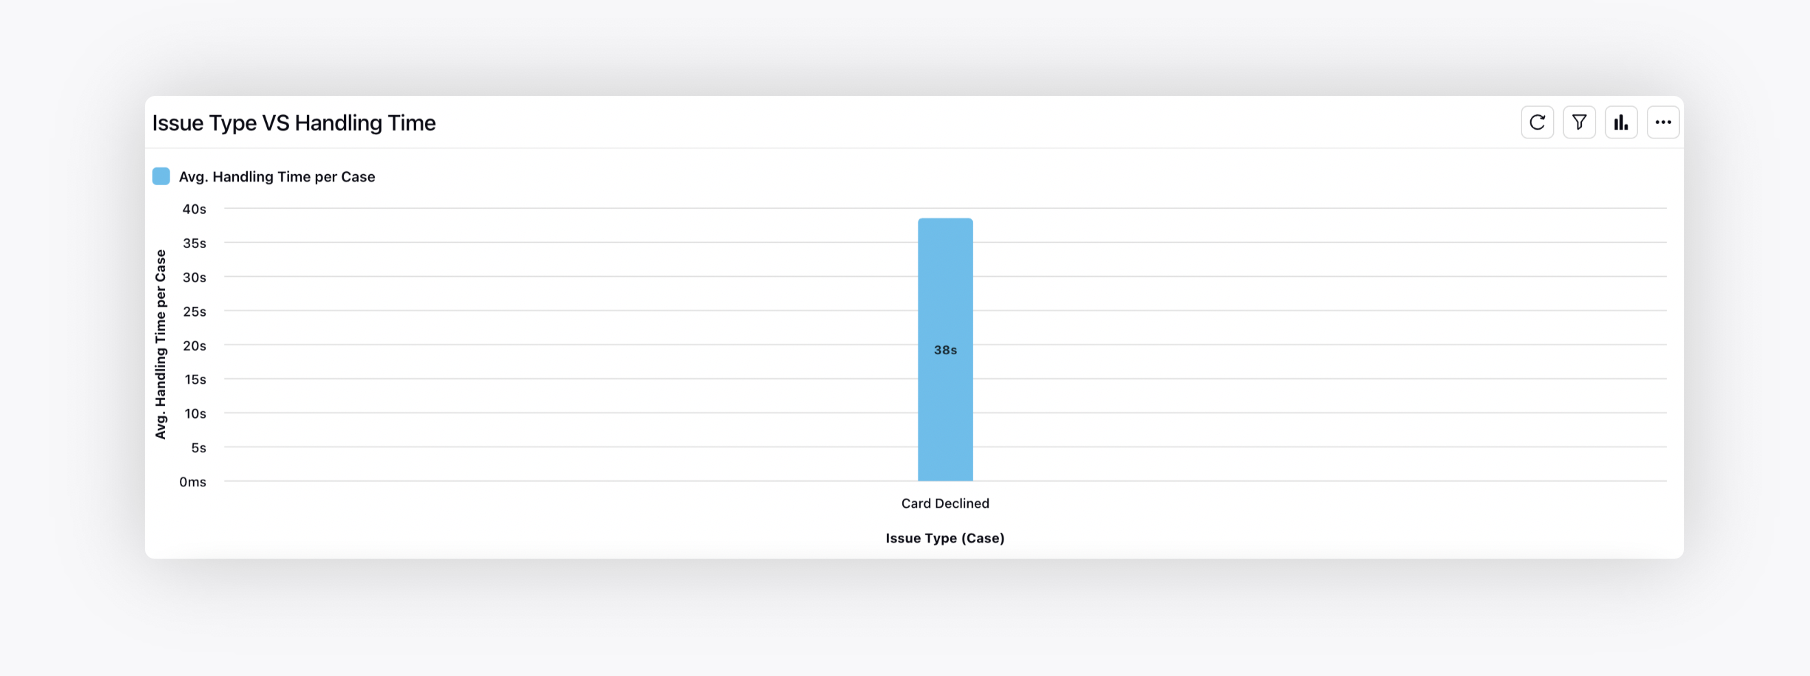
Issue Type vs. Handling Time | Avg. case handling time for each issue type | |
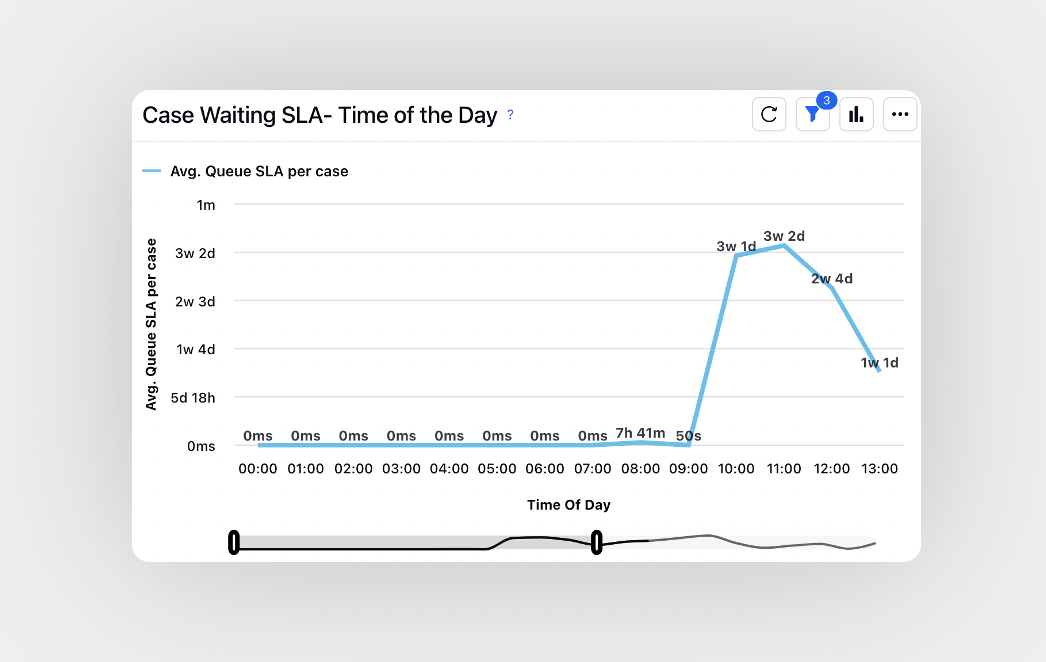
Case Waiting SLA - Time of the Day | Average time spent by the case waiting in the queue hourly trend | |
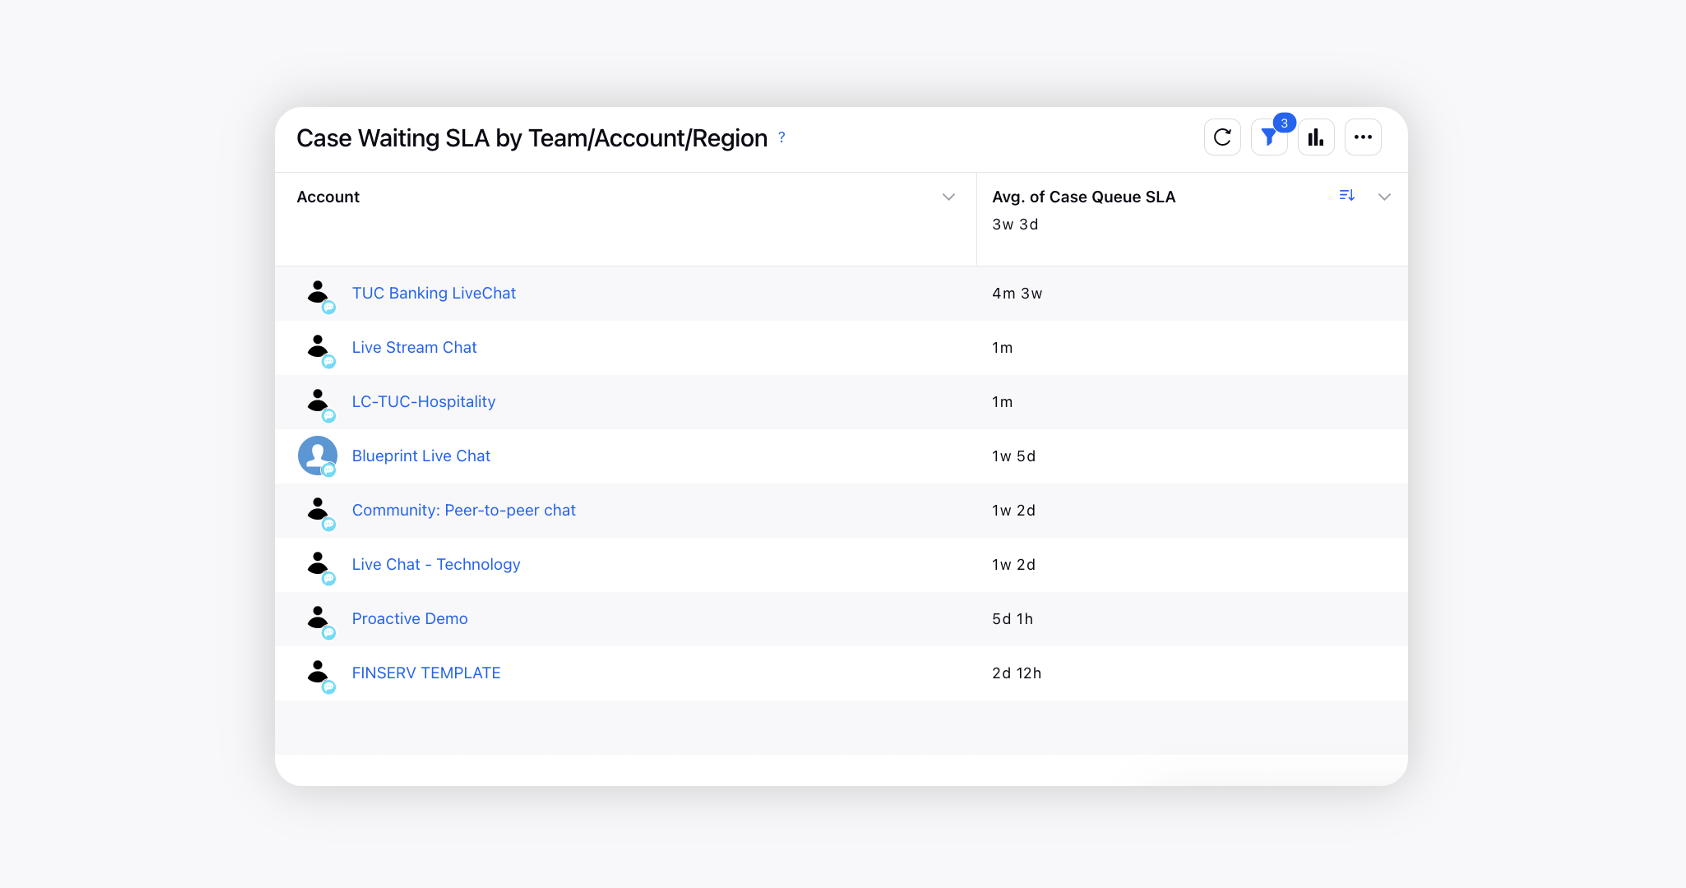
Case Waiting SLA by Team/Account/Region | Avg. case wait time in Awaiting Assignment queue to get assigned to a user w.r.t. Account (Can use Region and Users if they use the Custom Fields accordingly) | |
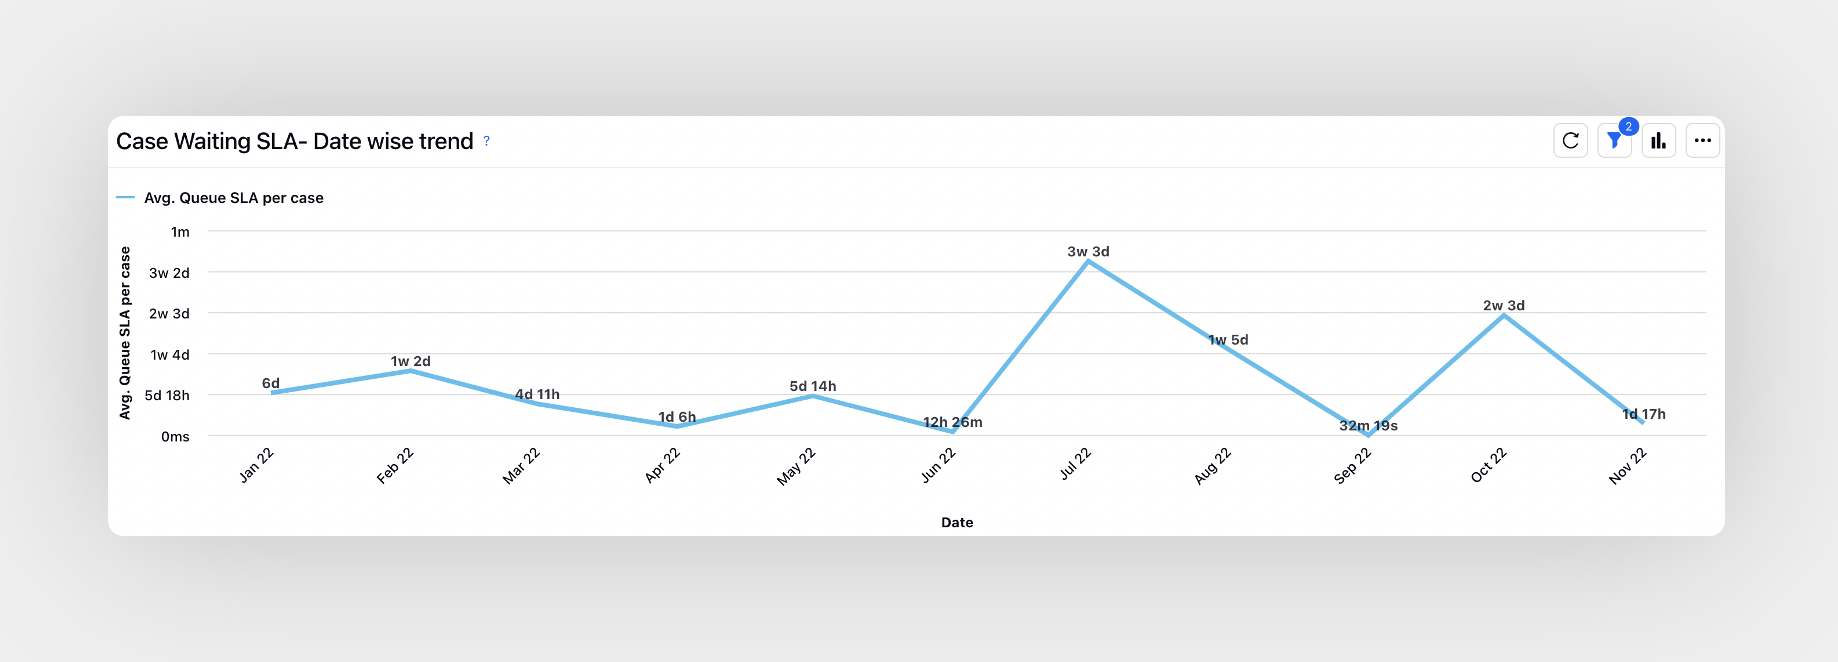
Case Waiting SLA - Date-wise Trend | Average time spent by the case waiting in the queue hourly trend | |
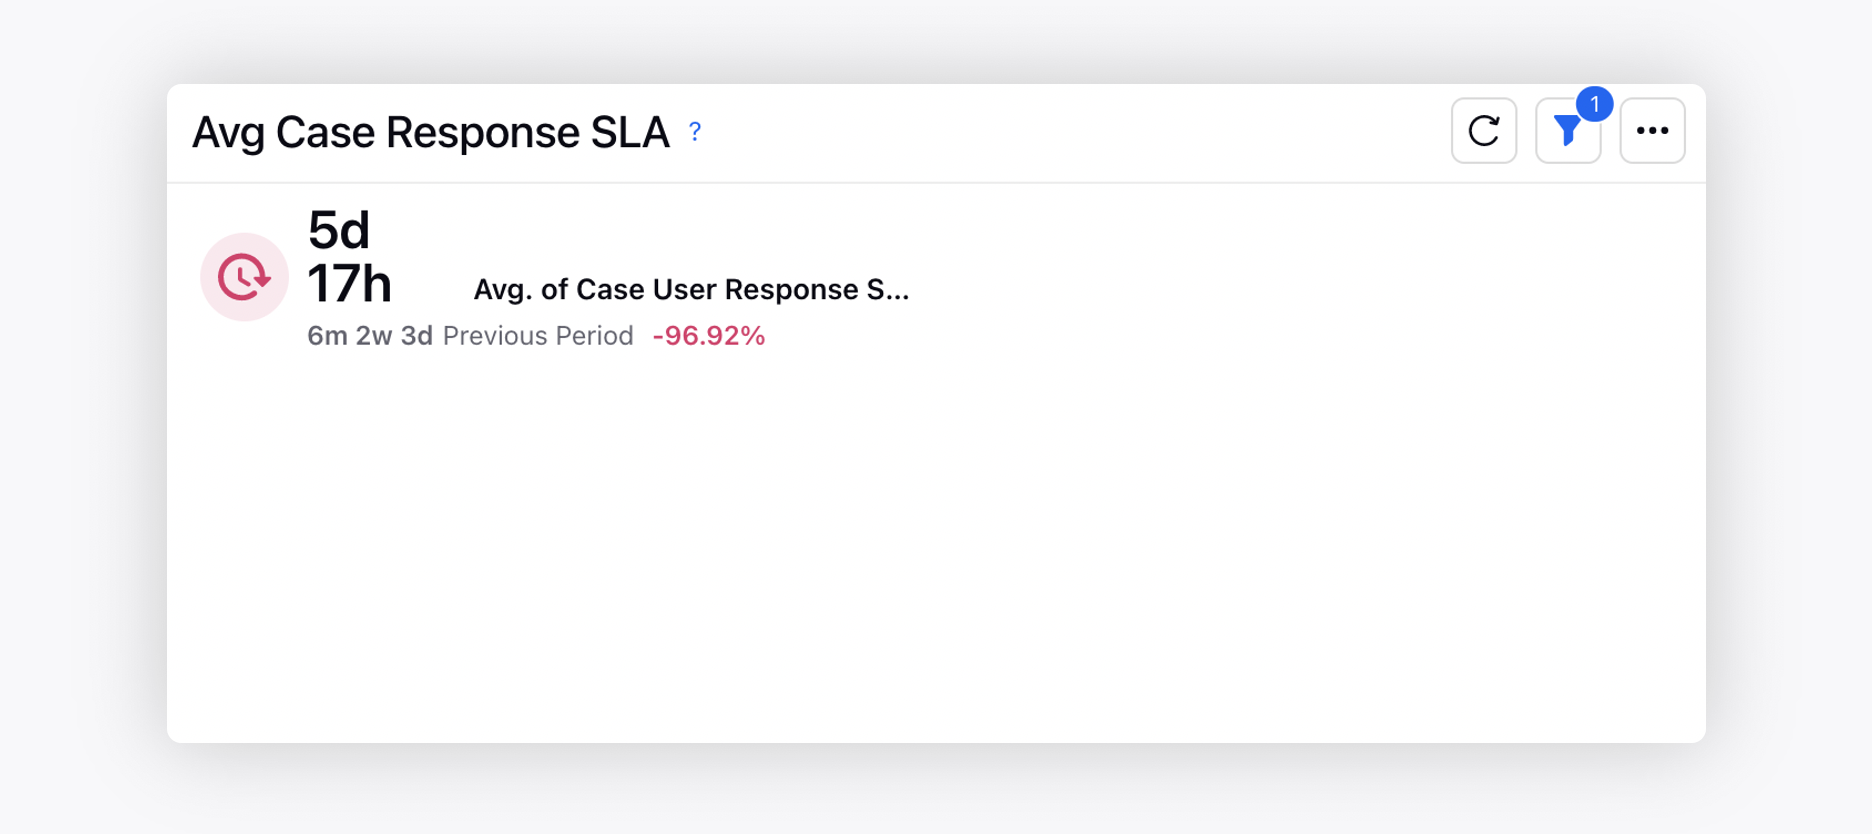
Avg. Case Response SLA | Time difference between the brand response (not including auto responses) to last un-replied fan message | |
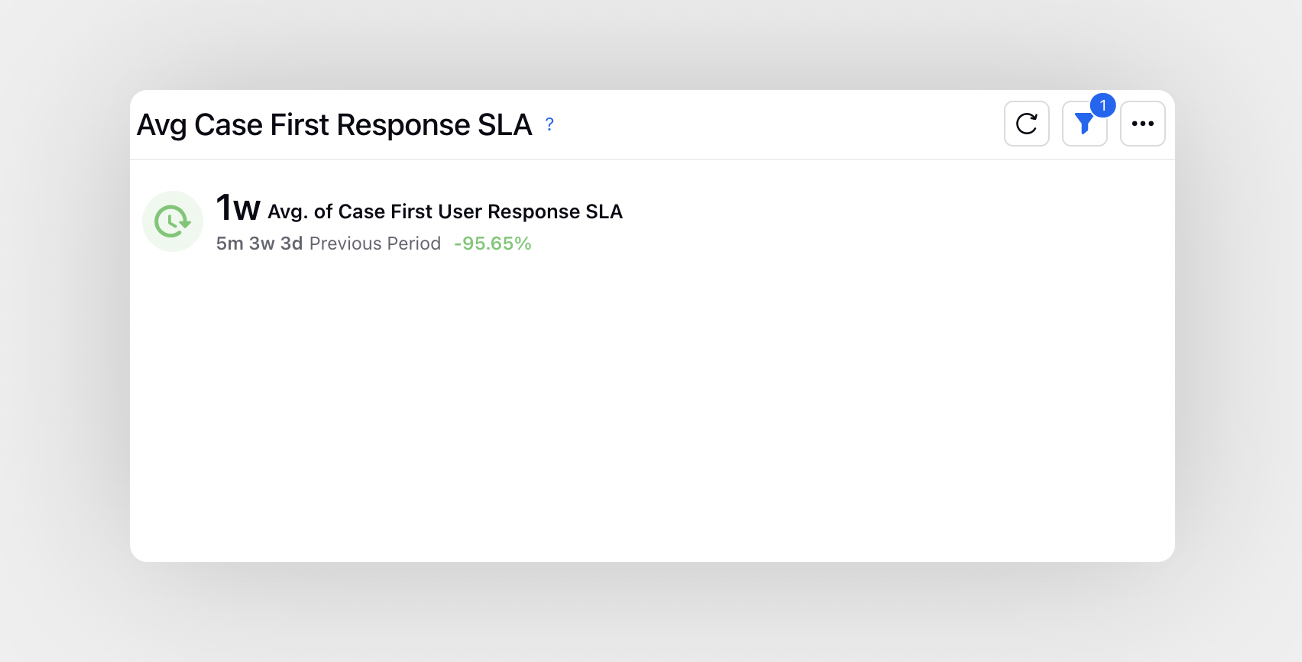
Avg. Case First Response SLA | Average time taken to make the first reply on the case based on action time | |
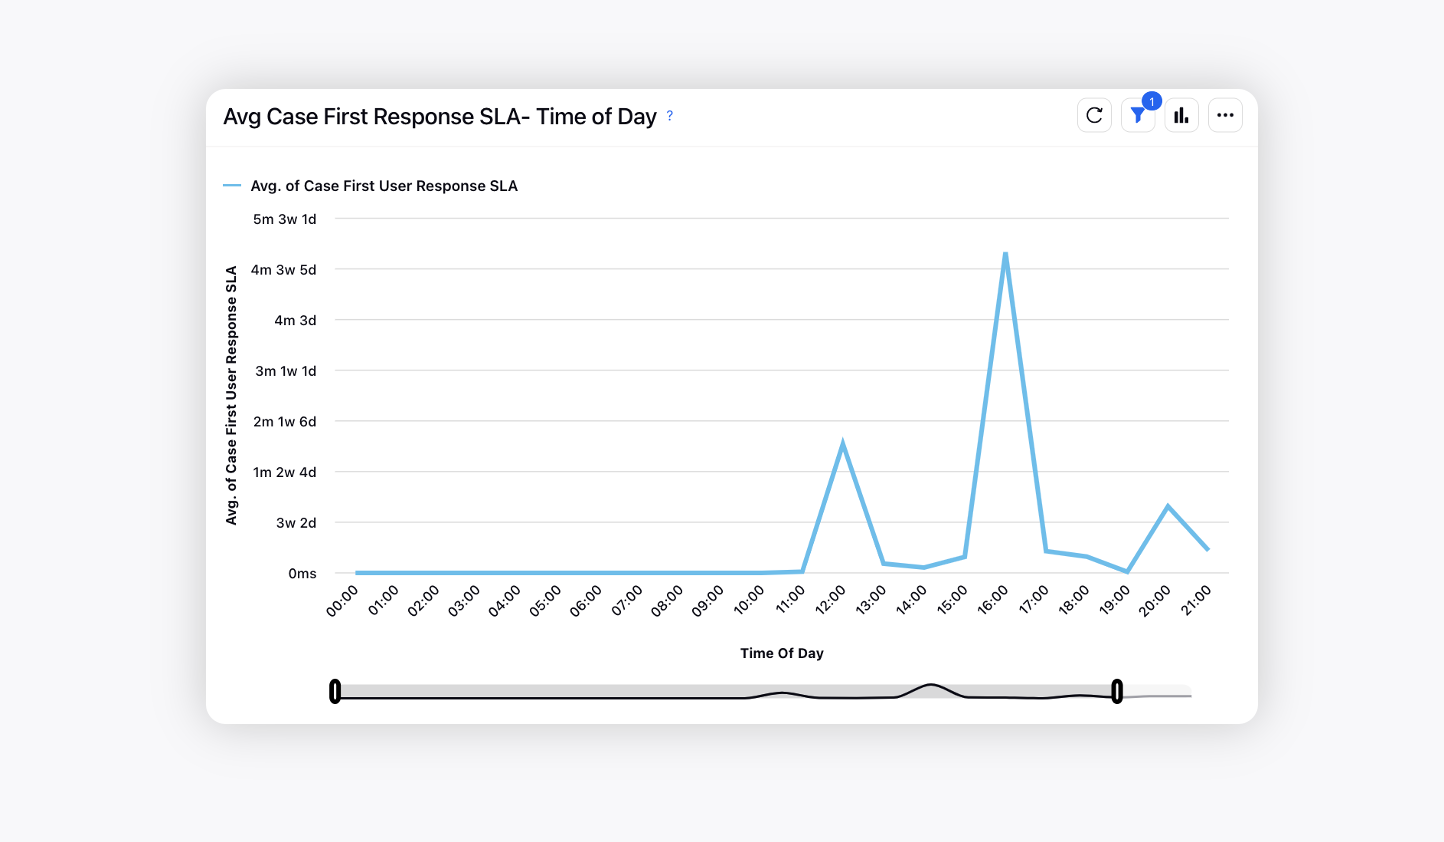
Avg. Case First Response SLA - Time of Day | Average time taken for first response by user in the case | |
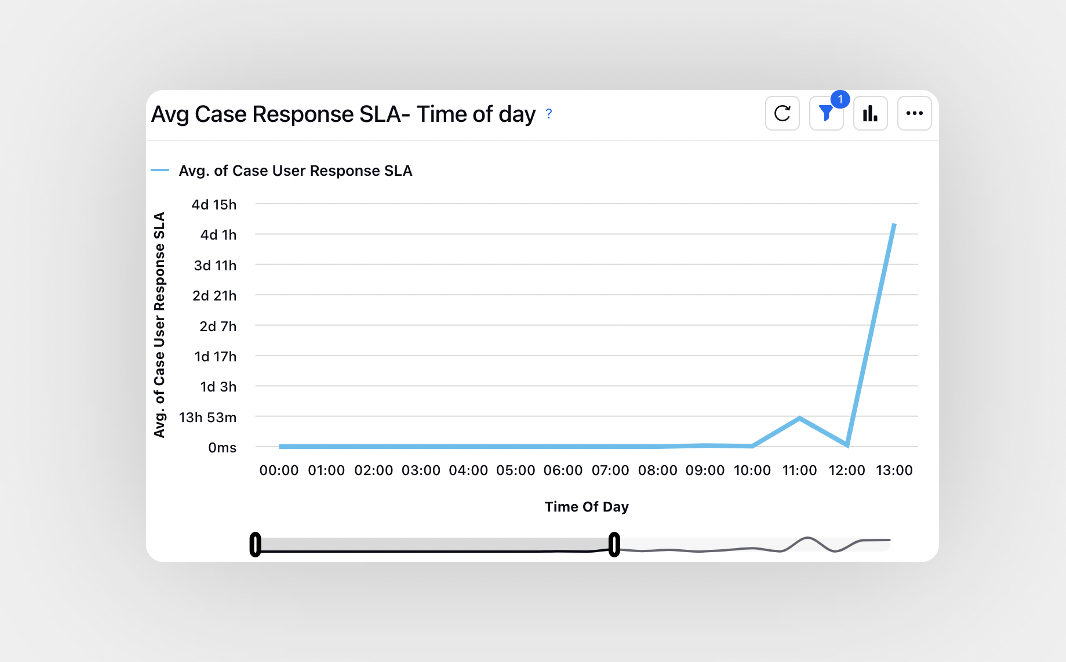
Avg. Case Response SLA - Time of day | Average time taken for response by user in the case | |
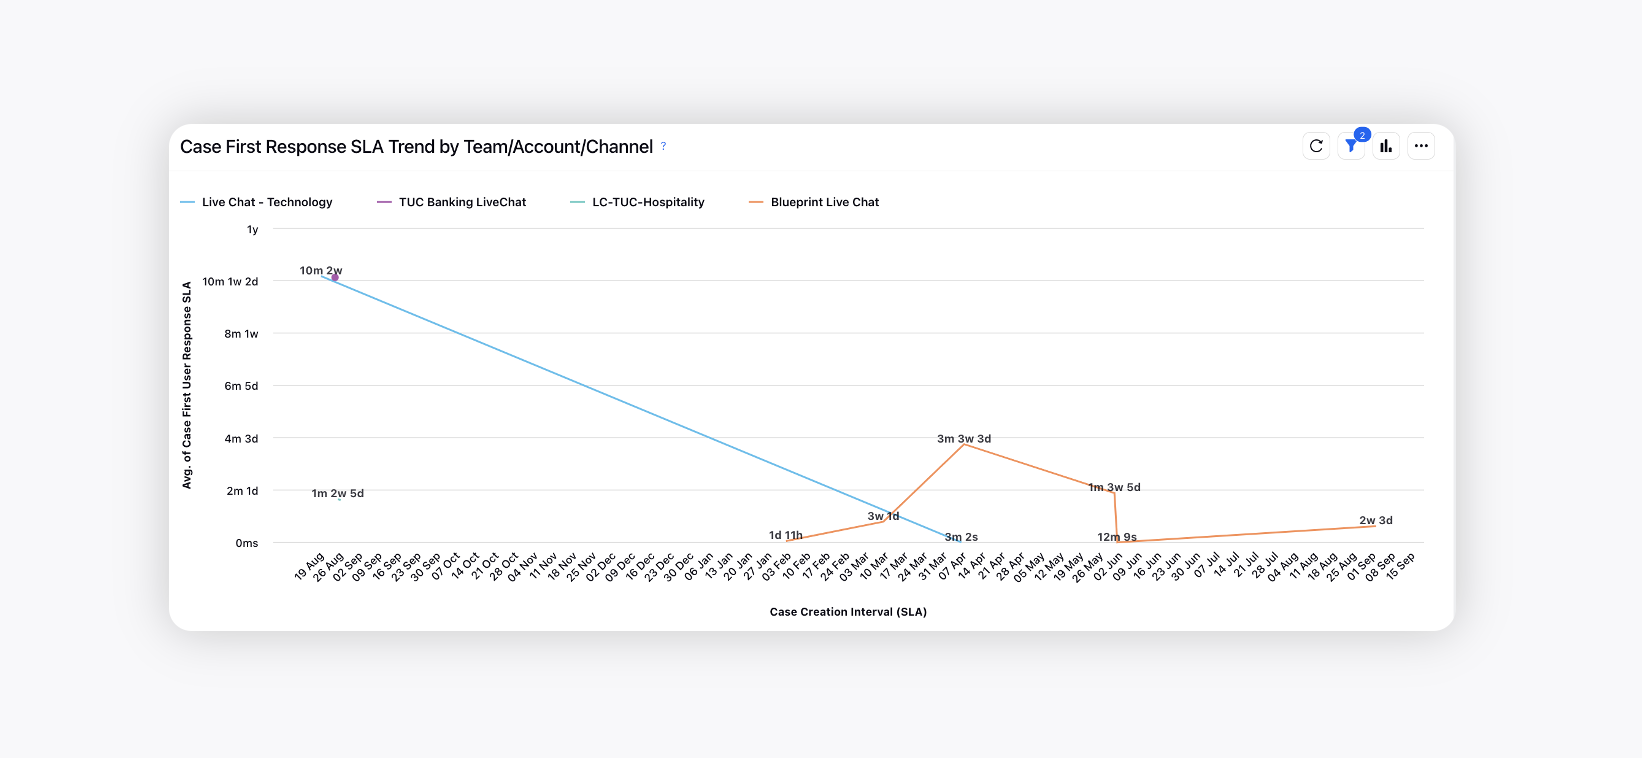
Case First Response SLA Trend by Team/Account/Channel | Average time taken for first response by user w.r.t. Team/Account/Channel | |
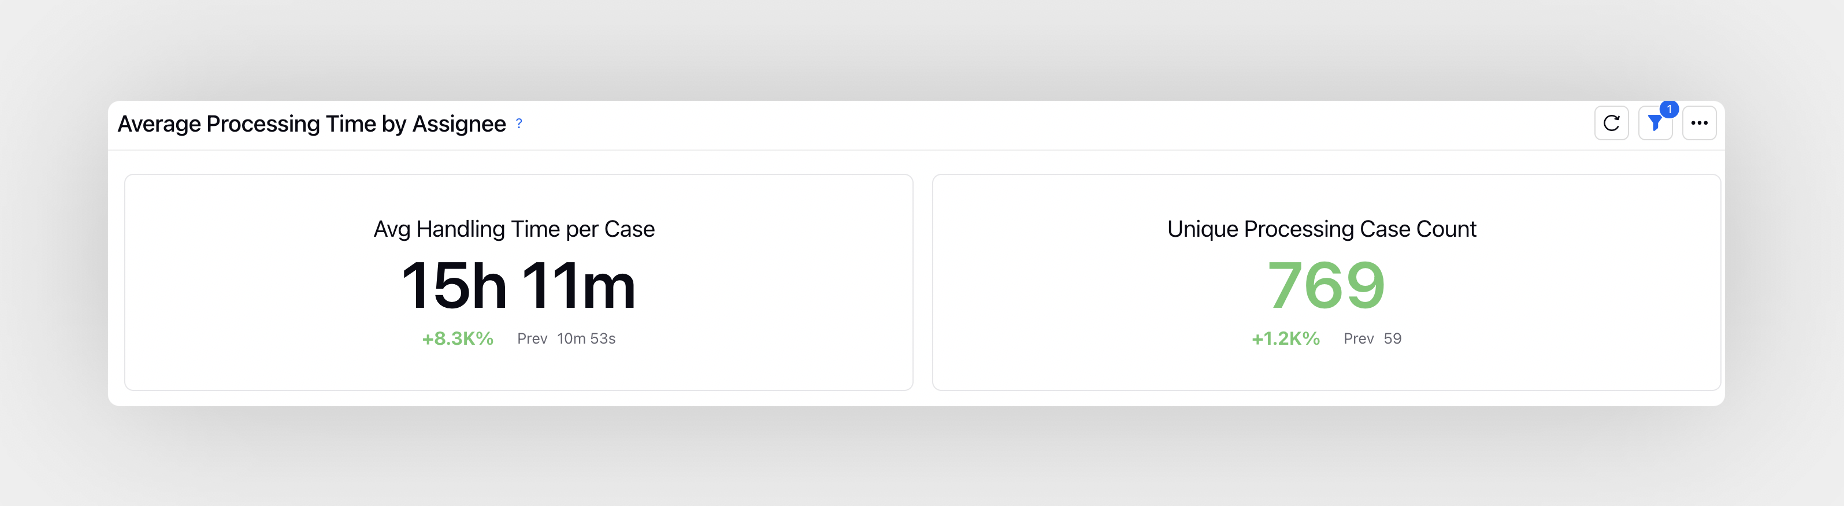
Average Processing Time by Assignee | Average time agents spend viewing a case and the total number of cases for which the processing clock started | |
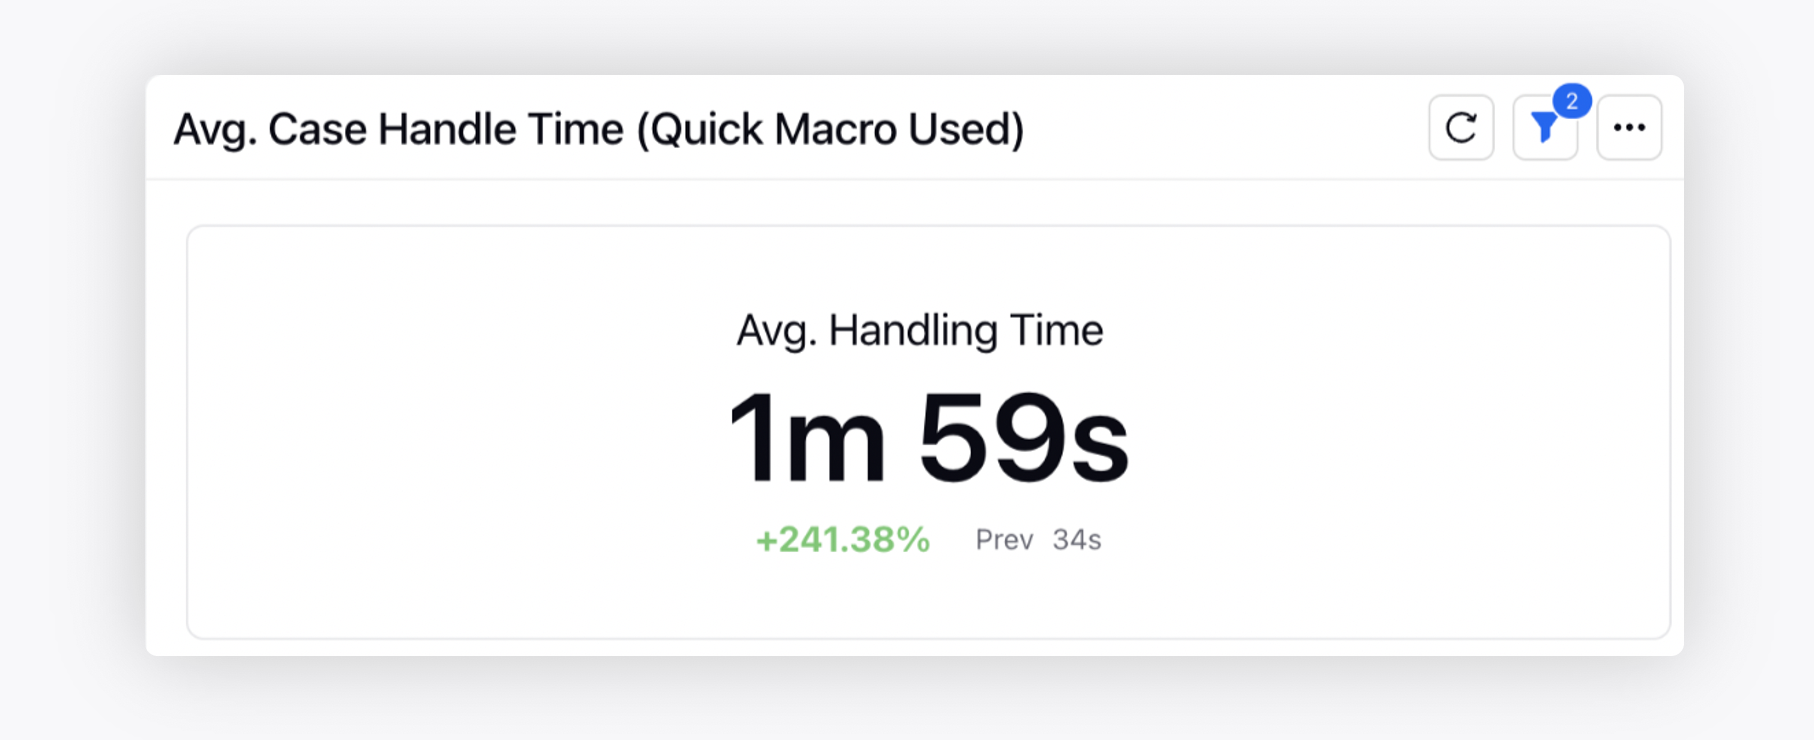
Avg. Case Handle Time (Quick Macro Used) | Average time spent by the assigned agent on the case - Quick Macro applied | |
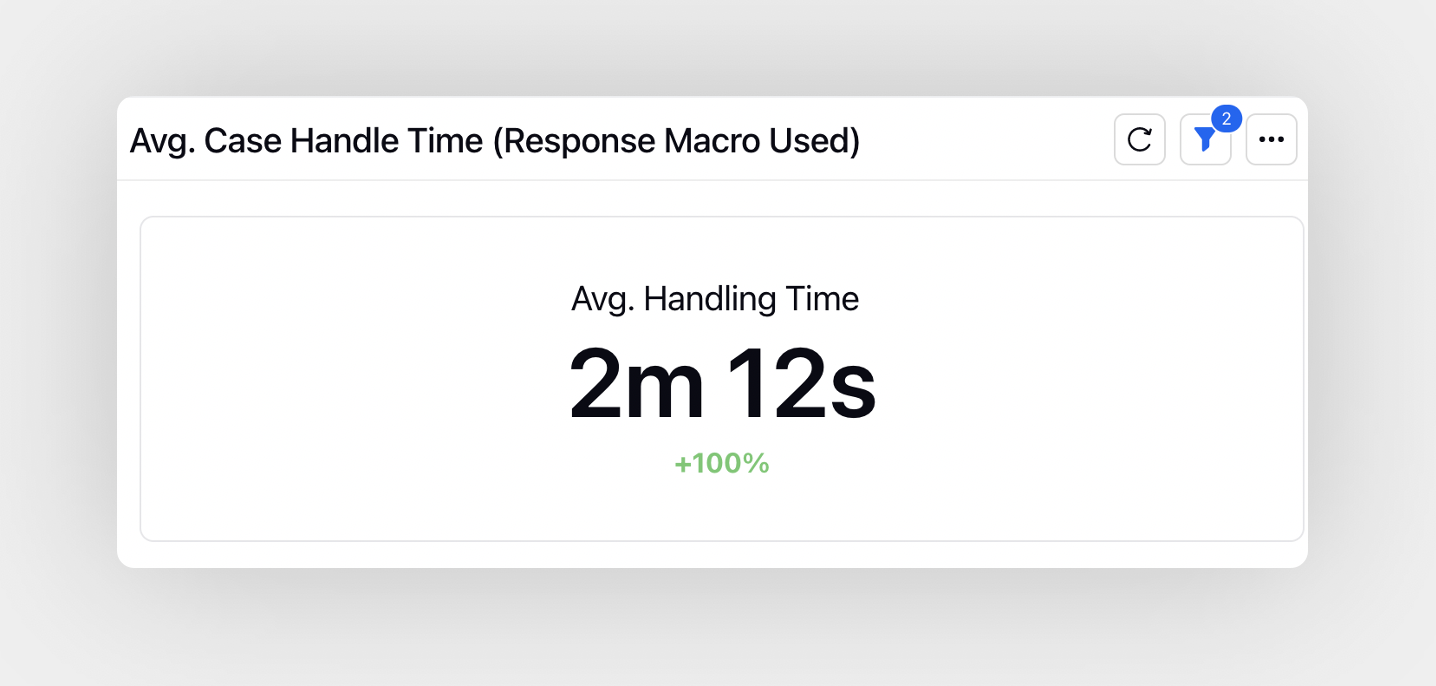
Avg. Case Handle Time (Smart Response Macro Used) | Average time spent by the assigned agent on the case - Smart Response Macro applied | |
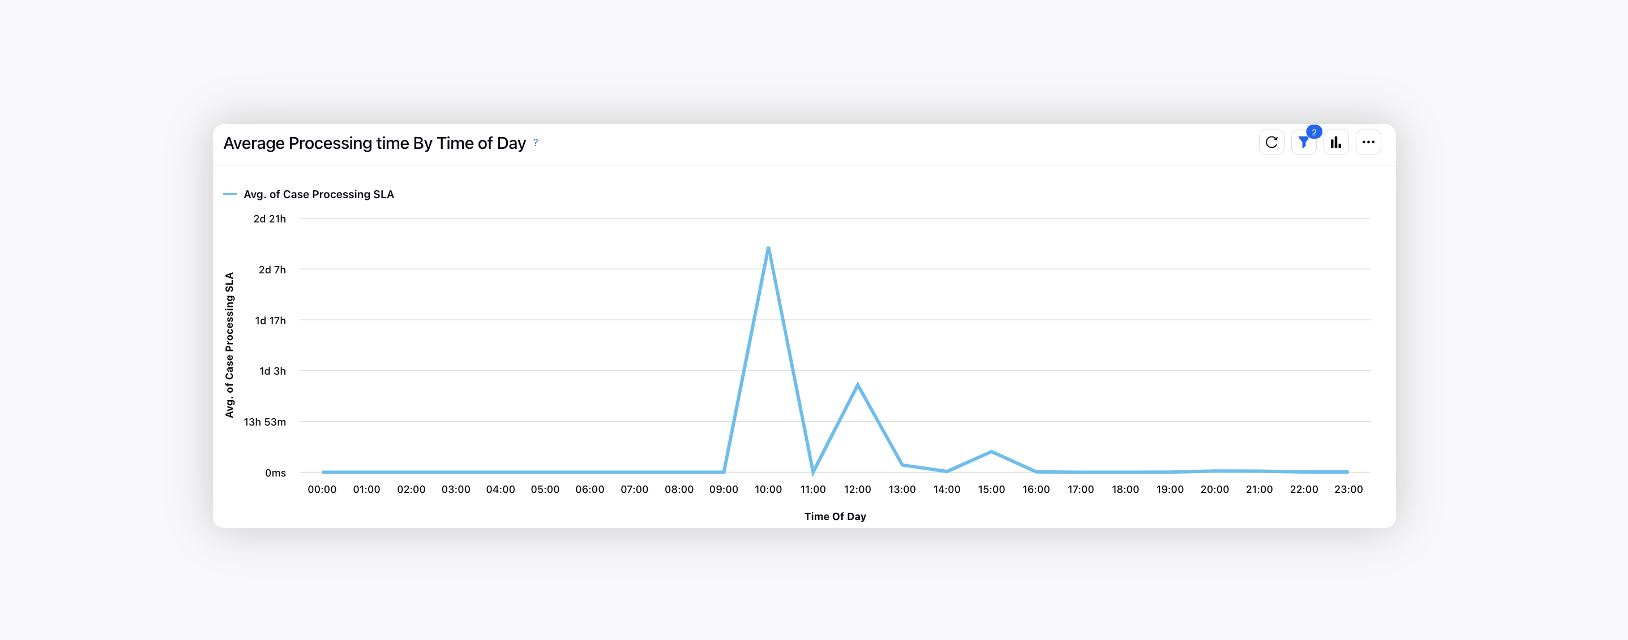
Average Processing Time by Time of Day | Average time spent between the assignment and action time on daily basis | |
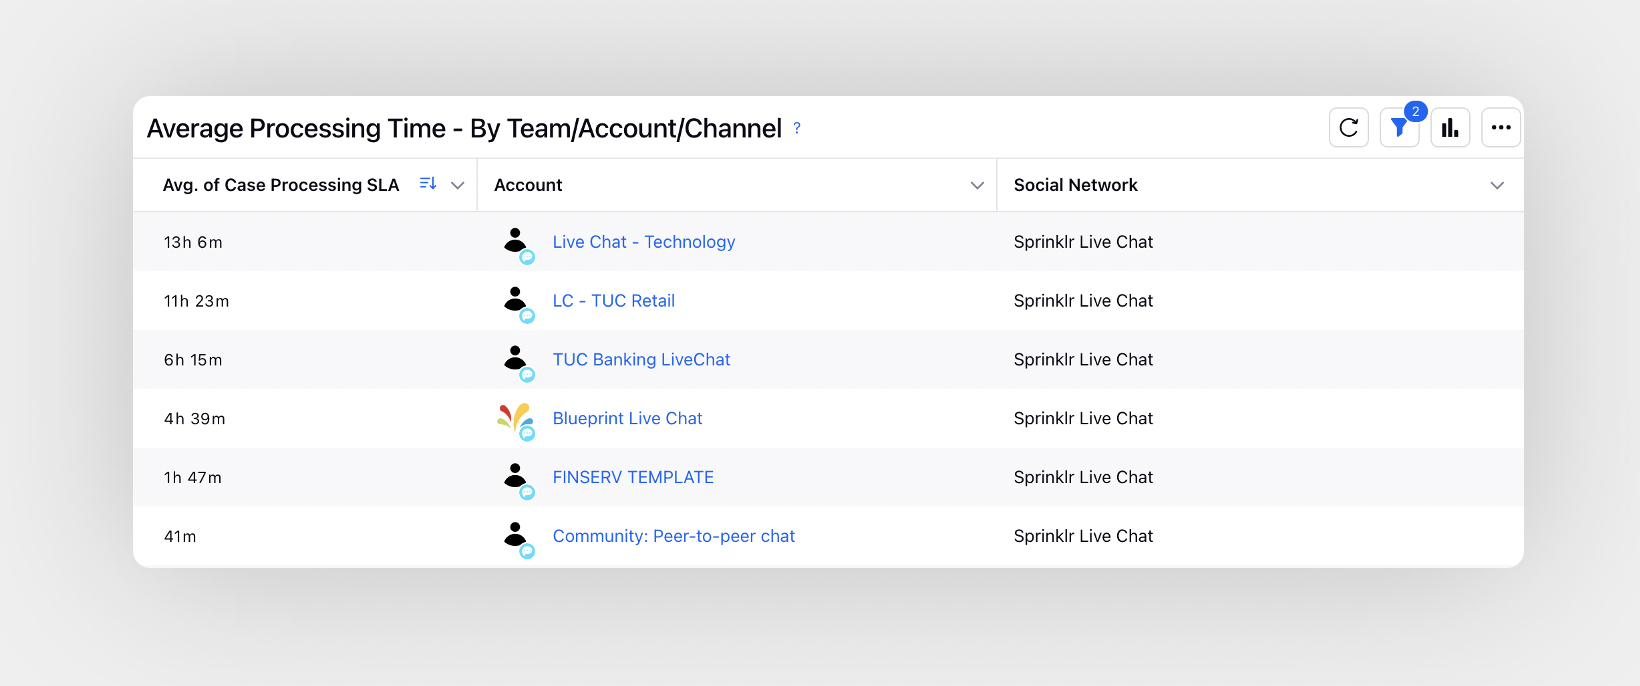
Average Processing Time by Team/Account/Channel | Average time agents spend viewing a case w.r.t. Team/Account/Channel | |
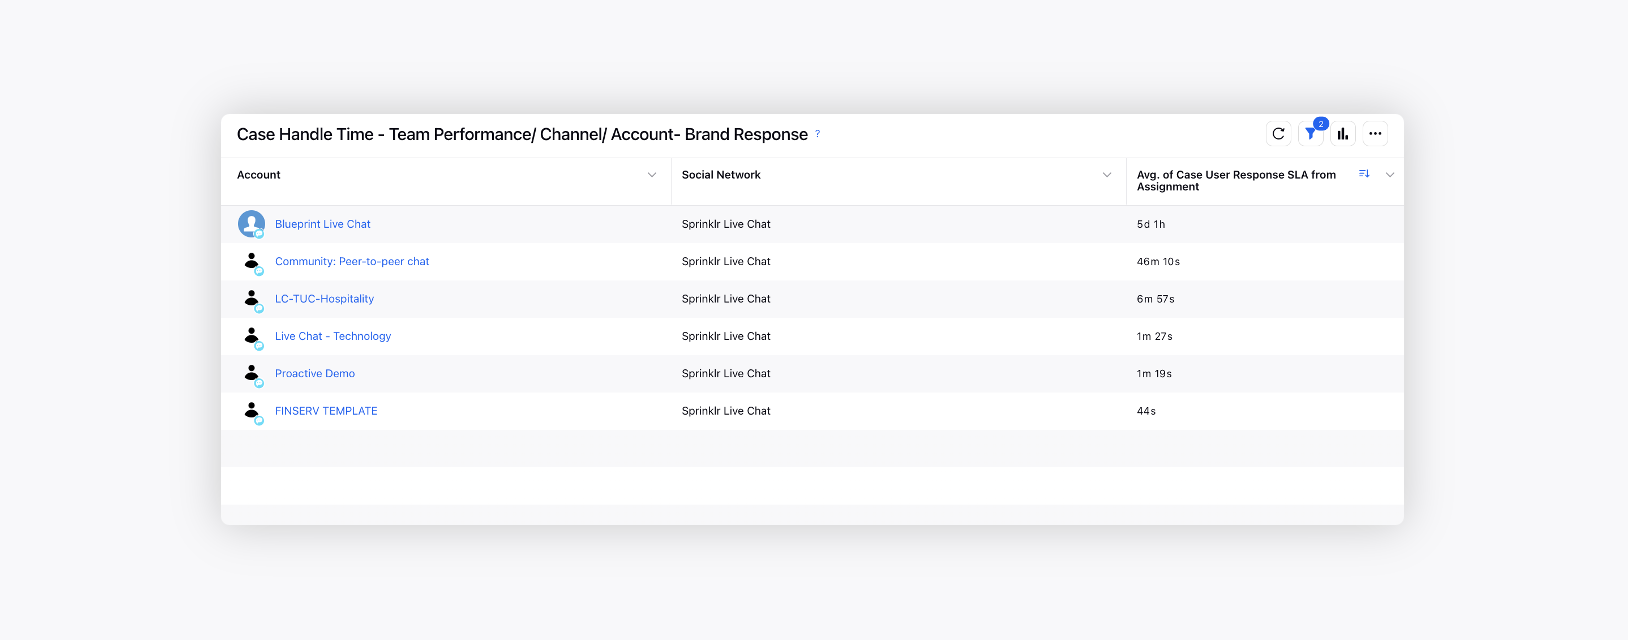
Case Handle Time - Team Performance/Channel/Account - Brand Response | Average time taken from assignment to response w.r.t. Team/Account/Channel | |
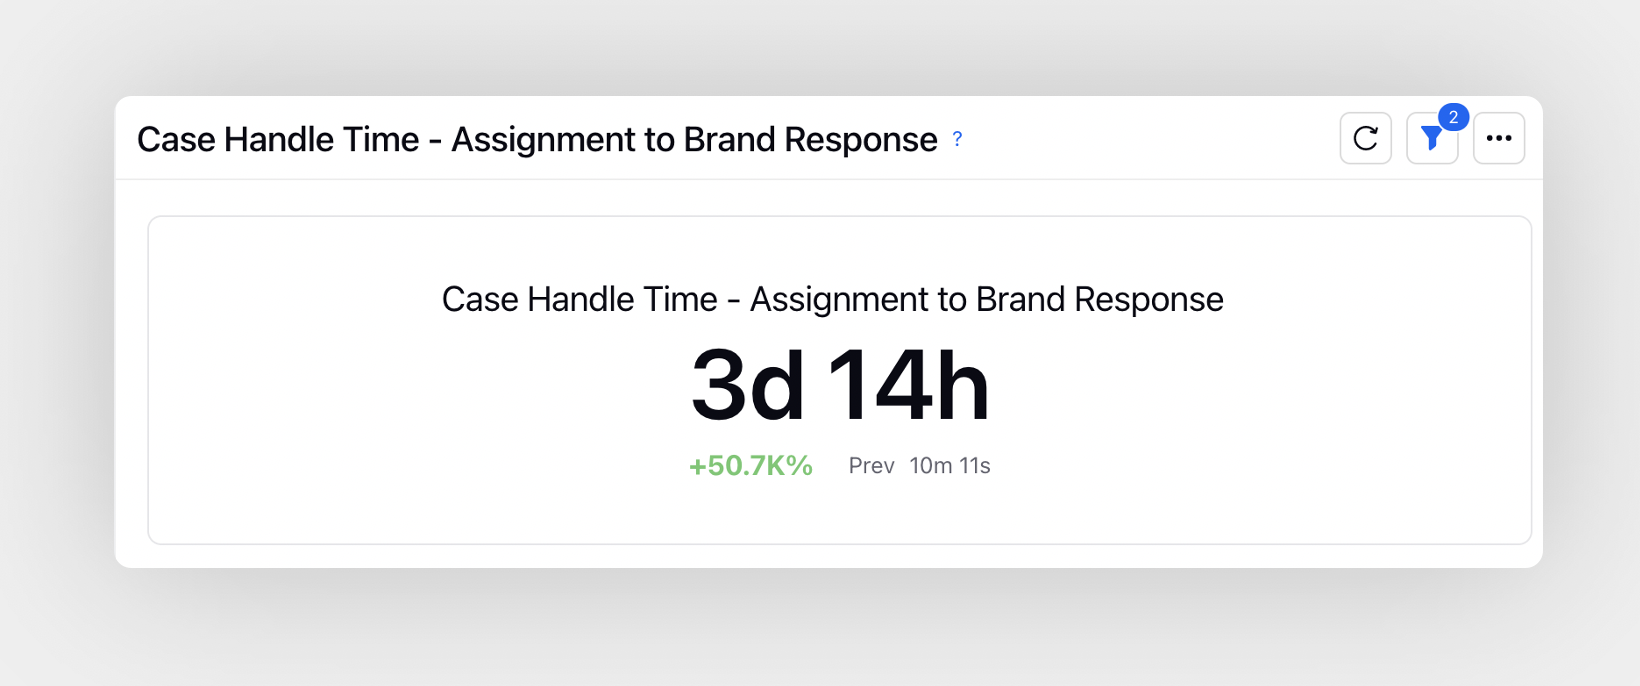
Case Handle Time - Assignment to Brand Response | Average time taken by the agent handling the case - from assignment to brand response | |
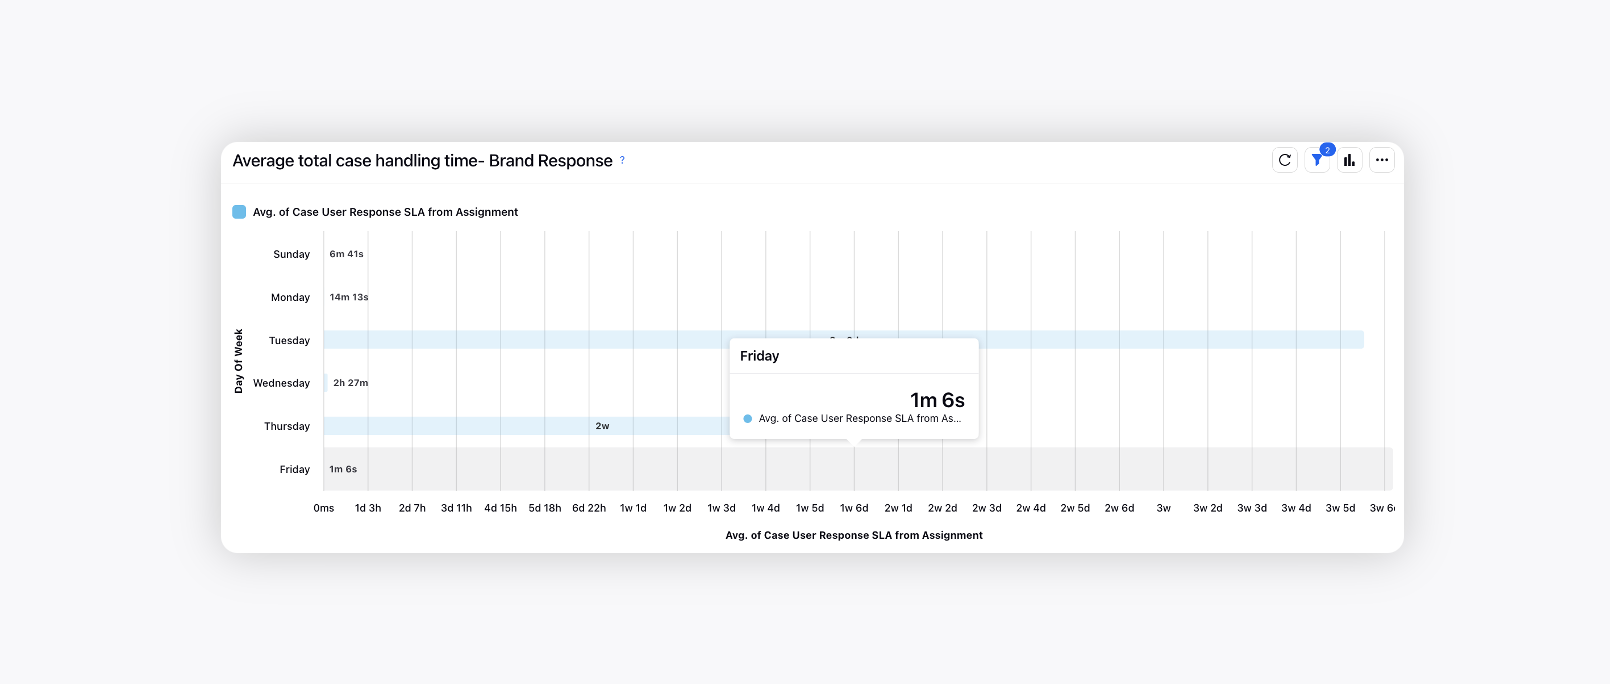
Average Total Case Handling Time - Brand Response | Average time spend between assignment to response on daily basis | |
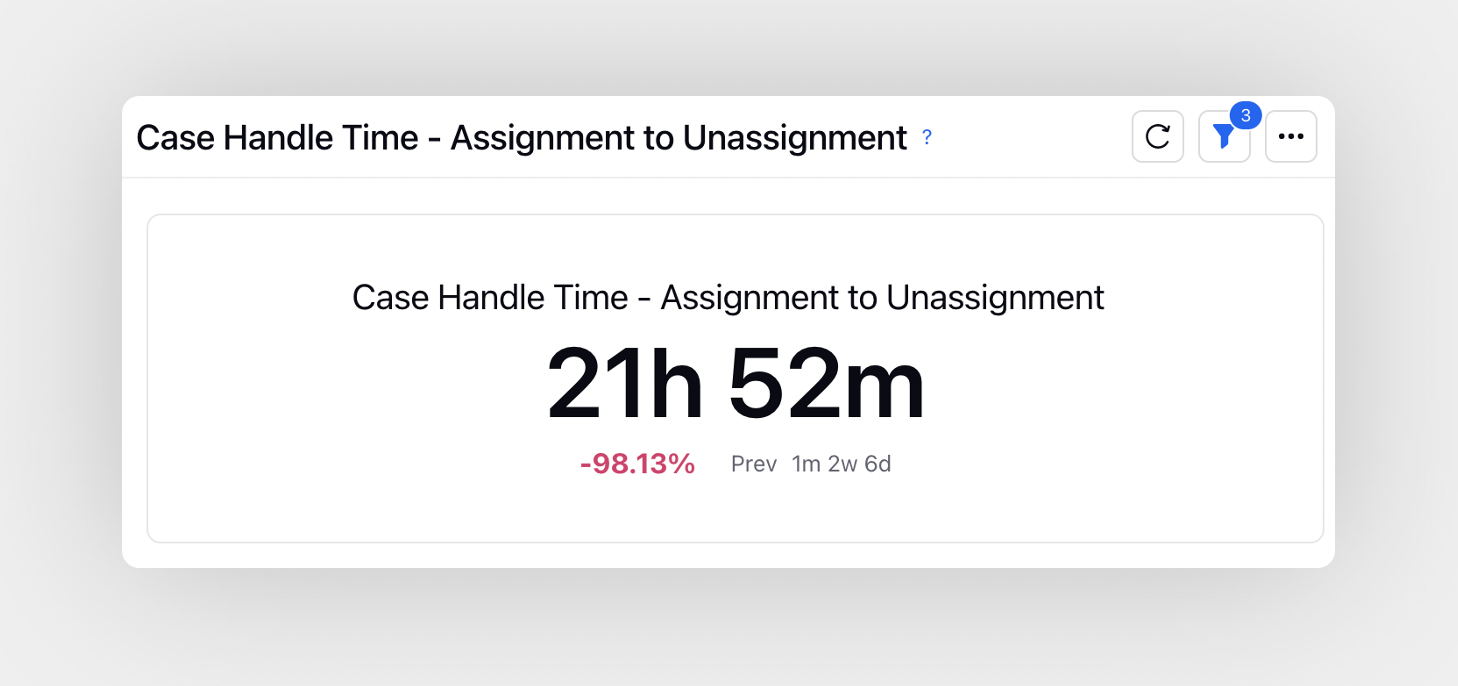
Case Handle Time - Assignment to Unassignment | Average time taken from assignment to un-assignment | |
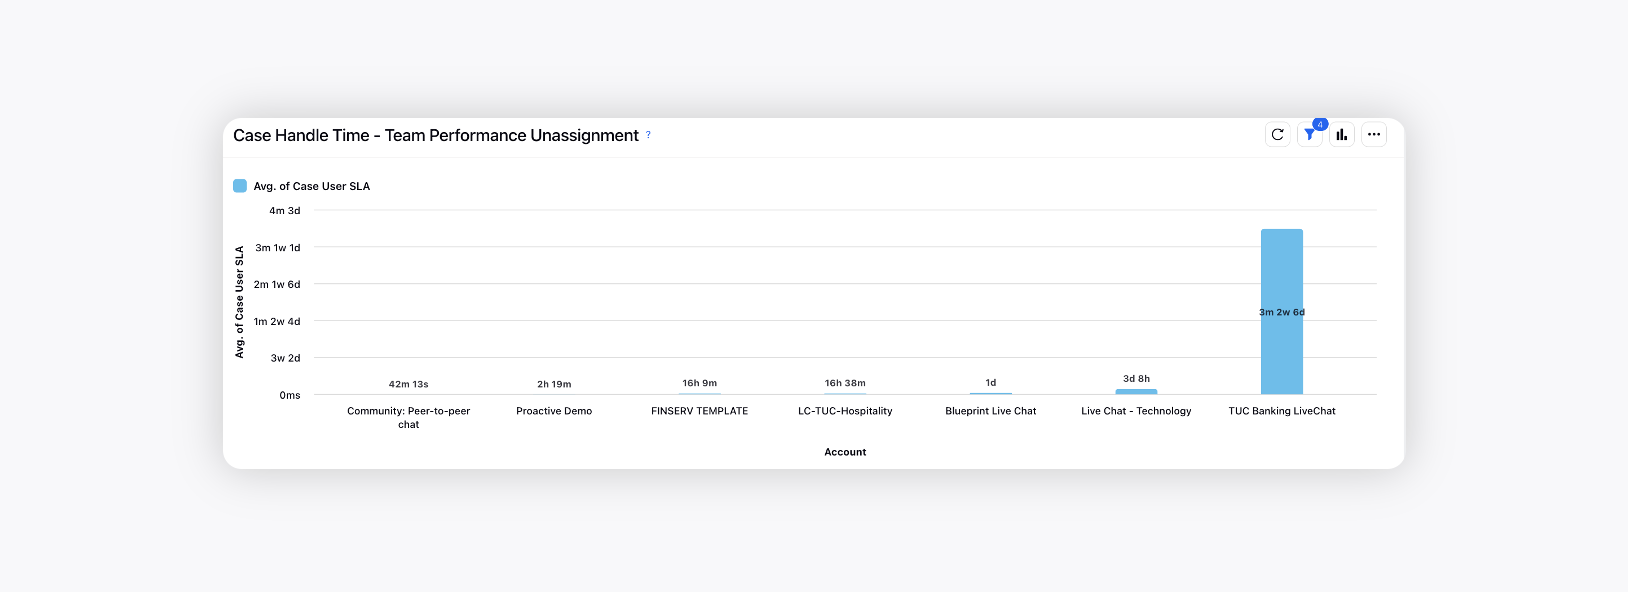
Case Handle Time - Team Performance Unassignment | Average time taken from assignment to un-assignment corresponding to the team | |
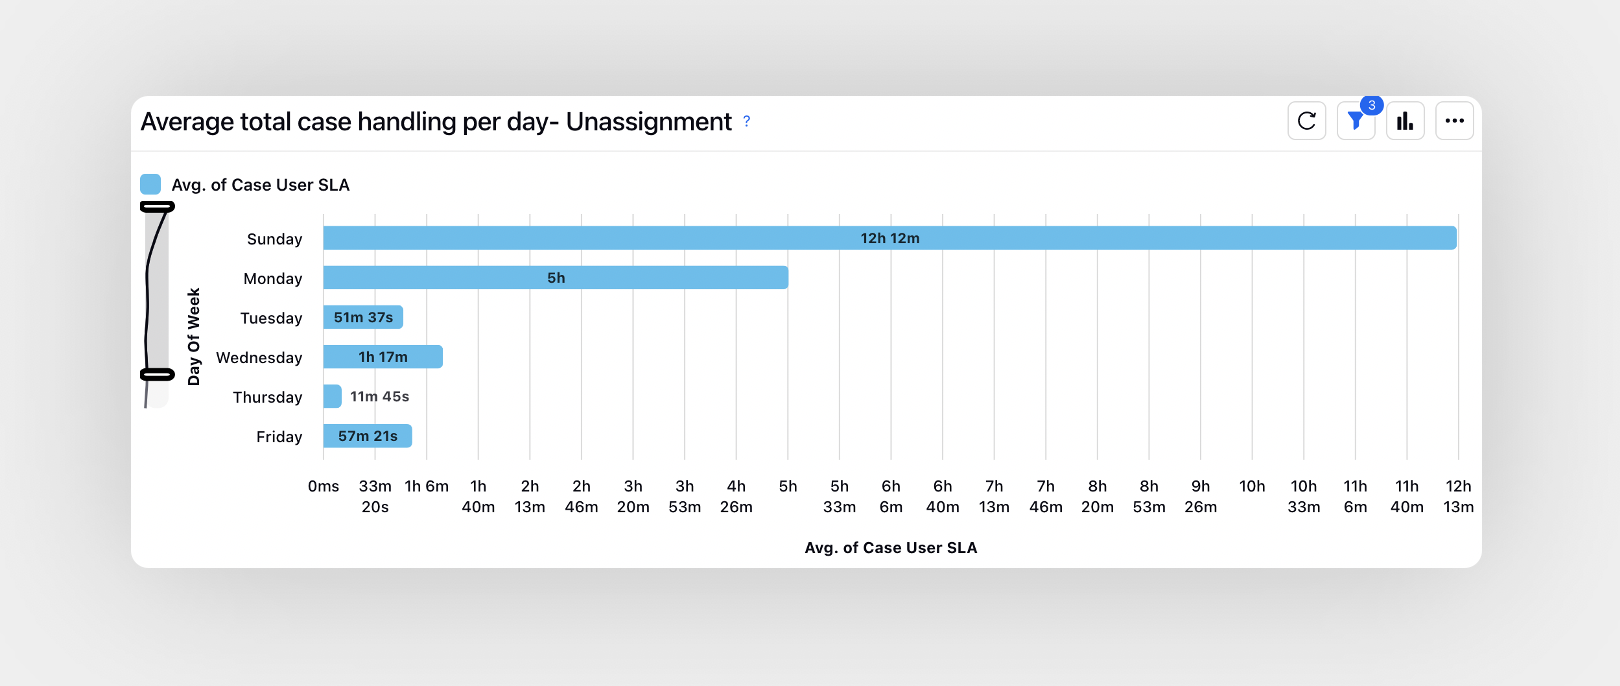
Average Total Case Handling per Day - Unassignment | Average time between the assignment and un-assignment on daily basis | |
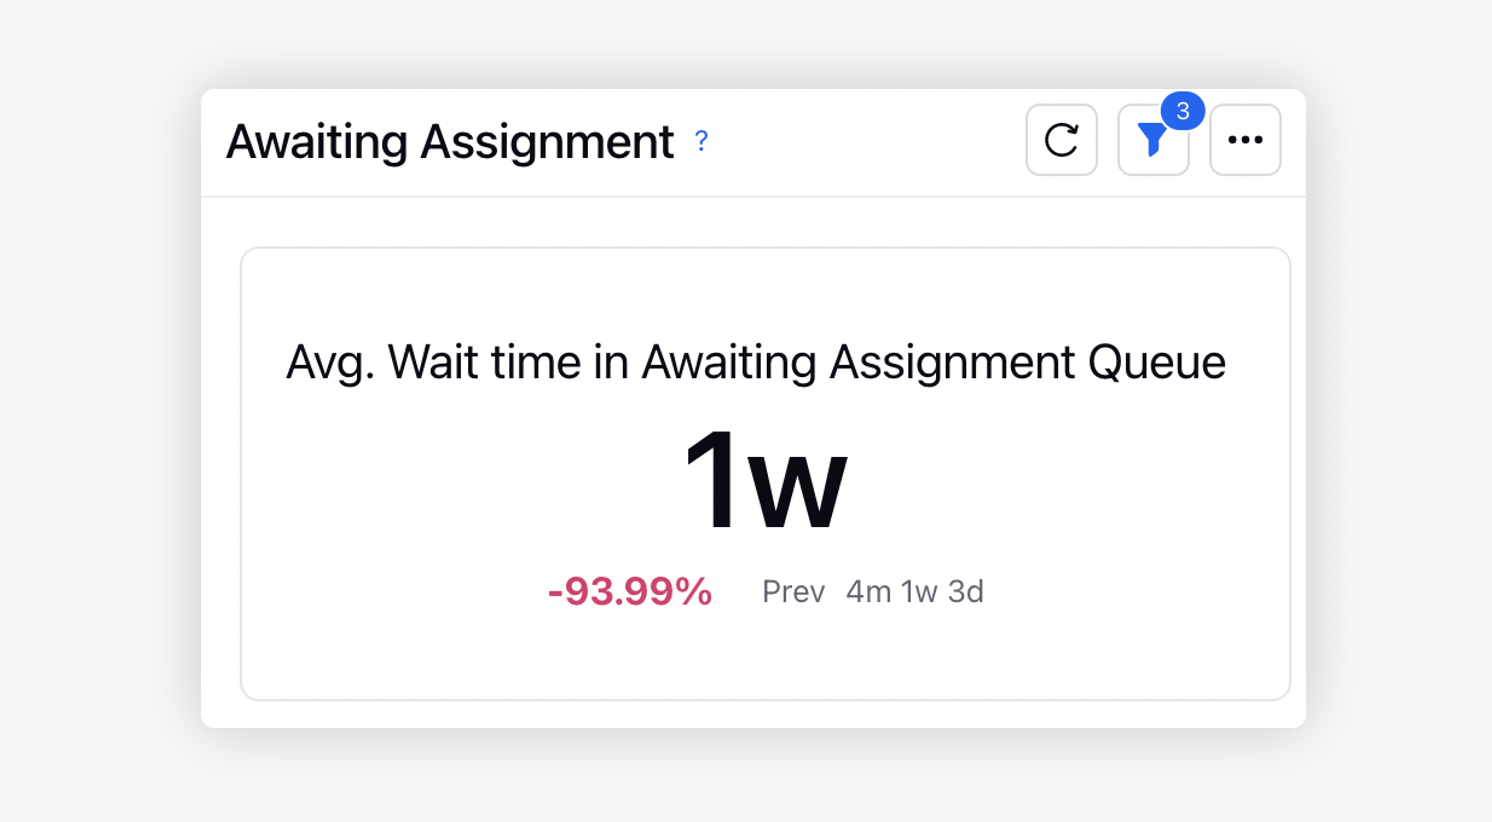
Awaiting Assignment | Average time spent by the case in Awaiting Assignment queue | |
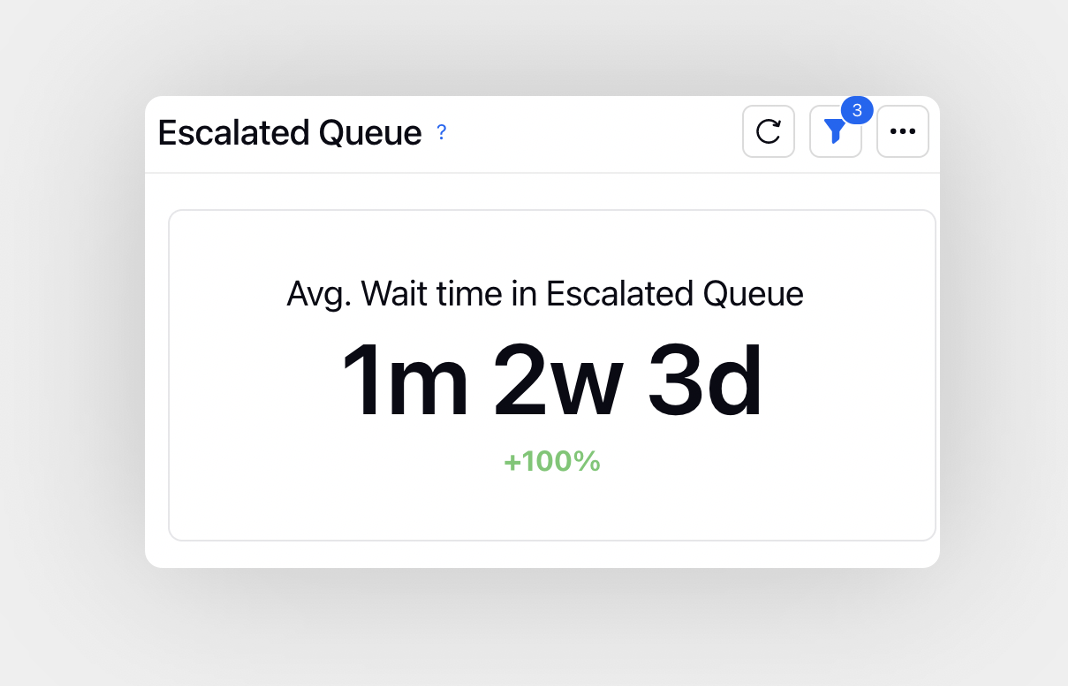
Escalated Queue | Average time spent by a case in Escalated queue | |
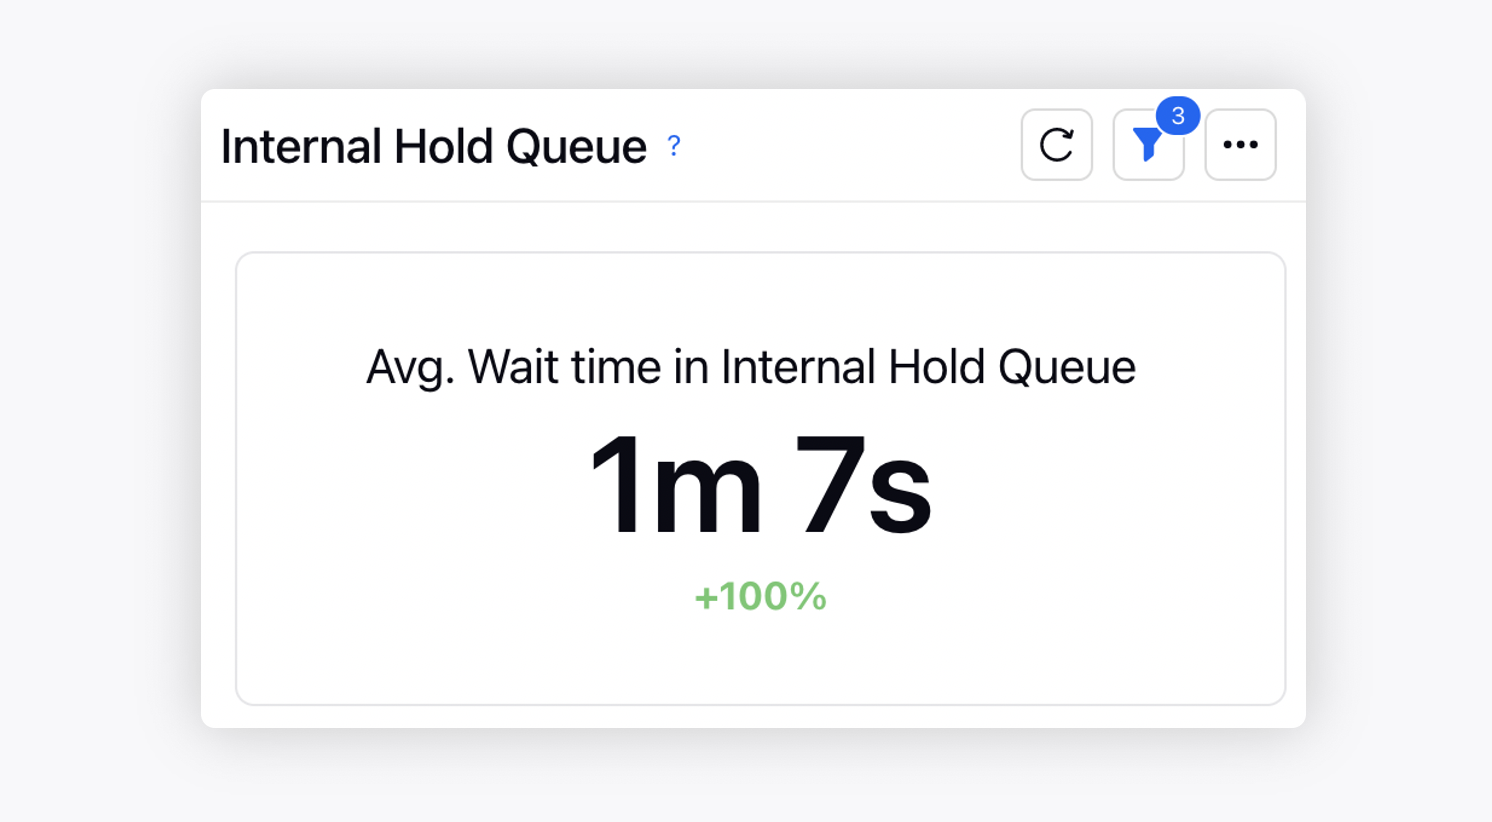
Internal Hold Queue | Average time spent by a case in the Internal Hold queue | |
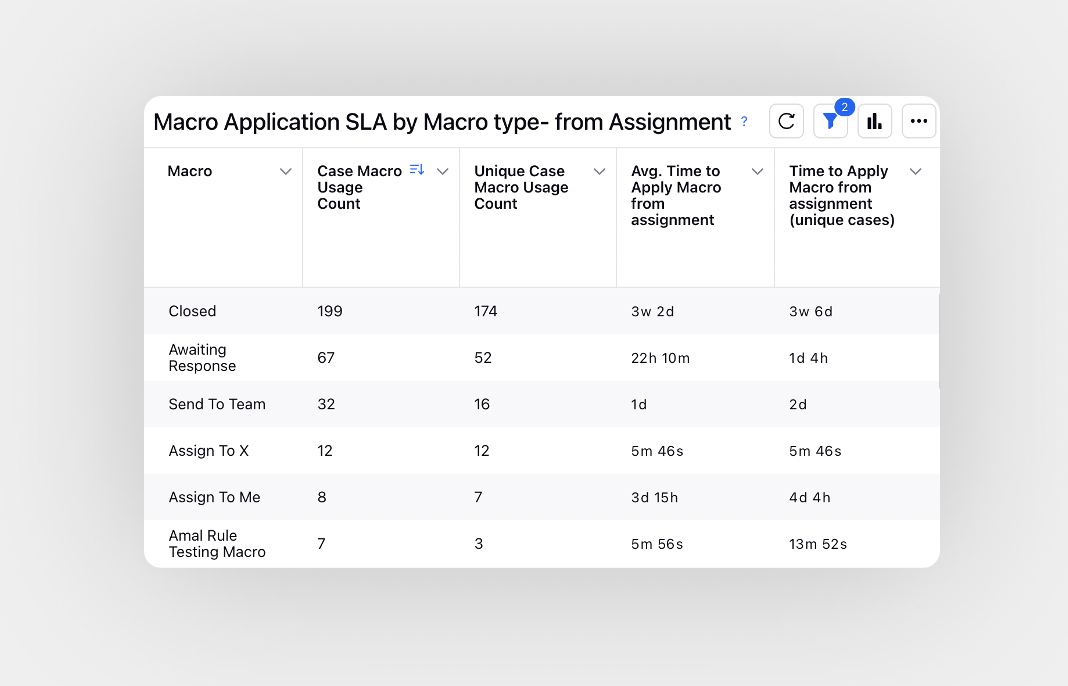
Macro Application SLA by Macro Type - from Assignment | Case-Macro Usage Count represents the total number of times a macro was applied to a case. Avg. time to apply macro represents the time taken to apply macro from assignment time. If the case was not assigned when the macro was applied, it will consider from case creation time | |
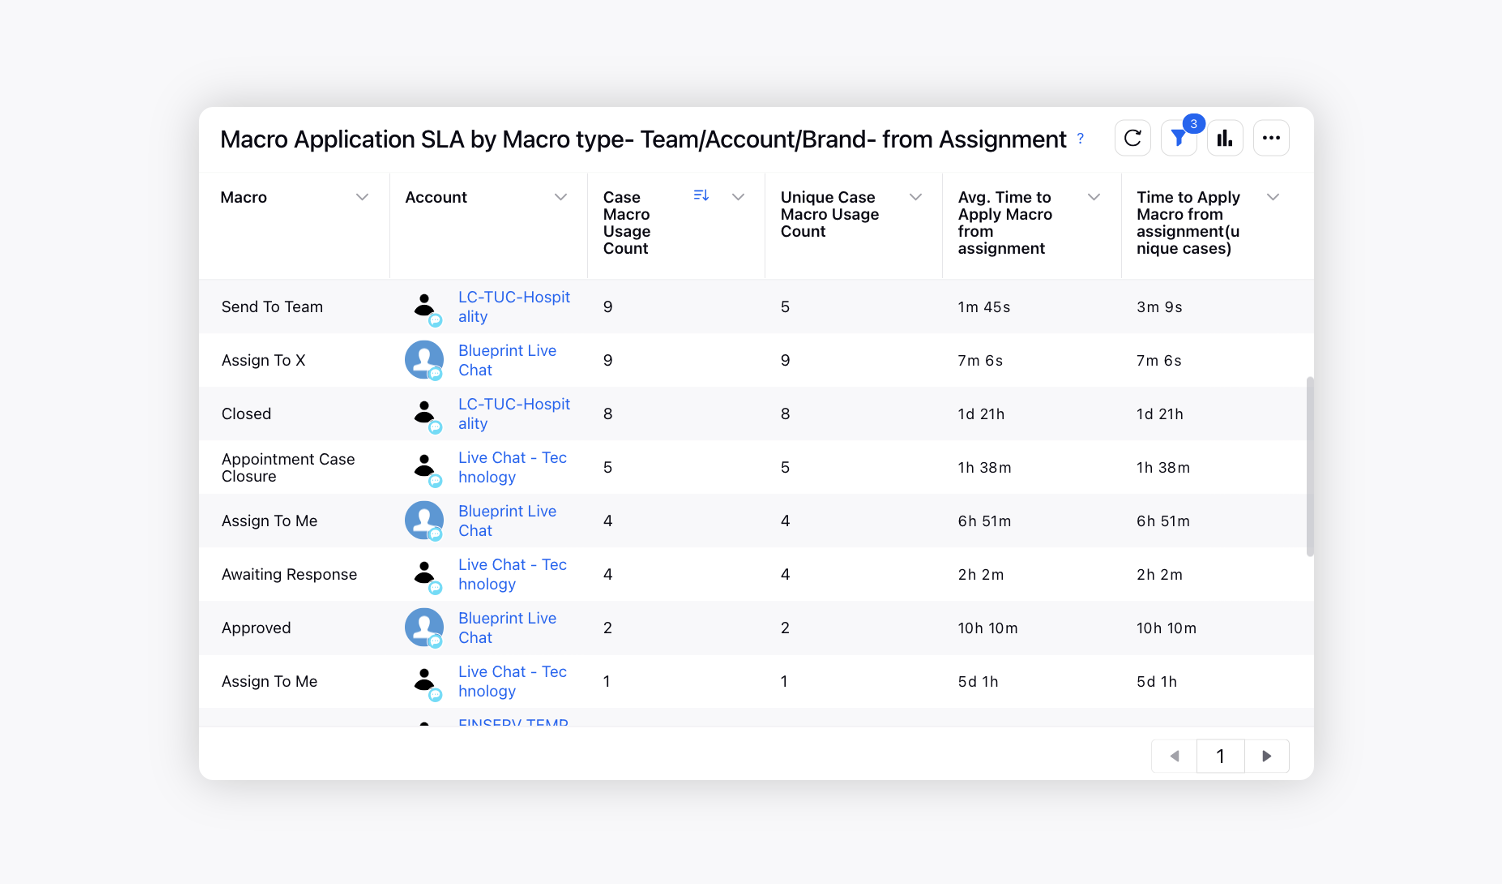
Macro Application SLA by Macro Type - Team/Account/Brand- from Assignment | Case-Macro Usage Count represents the total number of times a macro was applied to a case. Avg. time to apply macro represents the time taken to apply macro from assignment time. If the case was not assigned when the macro was applied, it will consider from case creation time | |
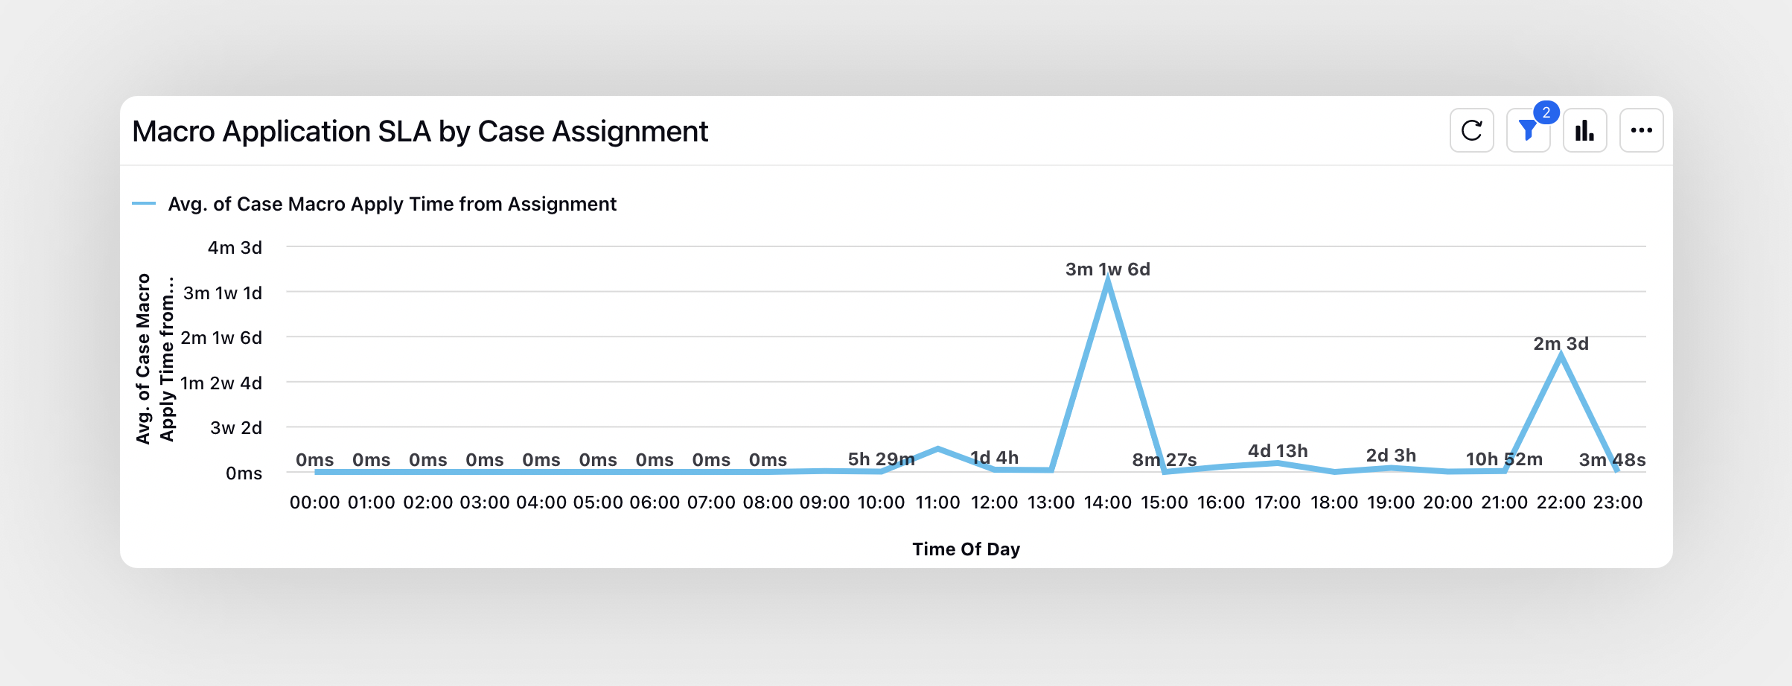
Macro Application SLA by Case Assignment | Time taken to apply macro from case creation | |
Live Chat Agent Performance
Widget | Description | Image |
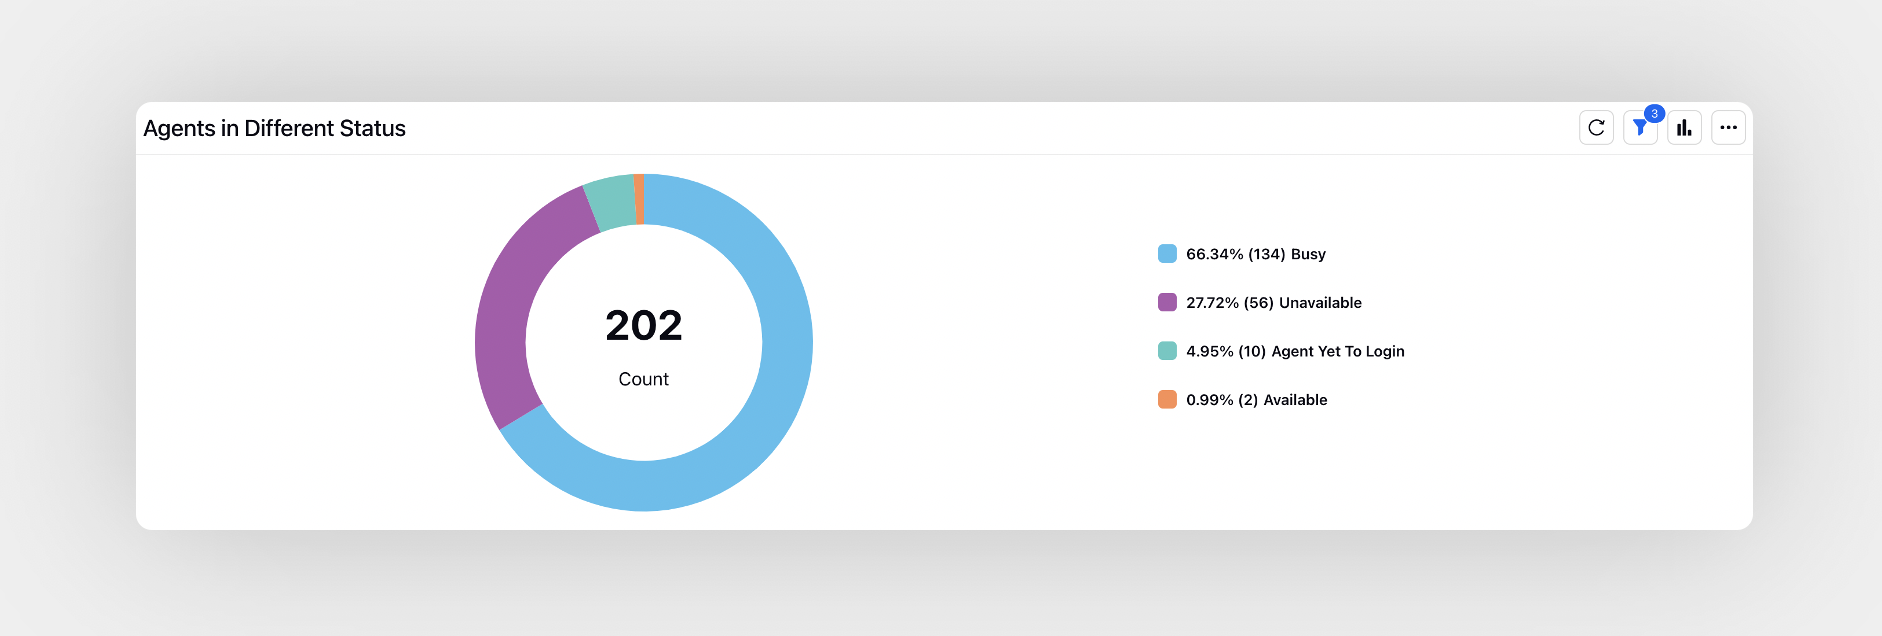
Agents in Different Status | Number of agents present in different statuses | |
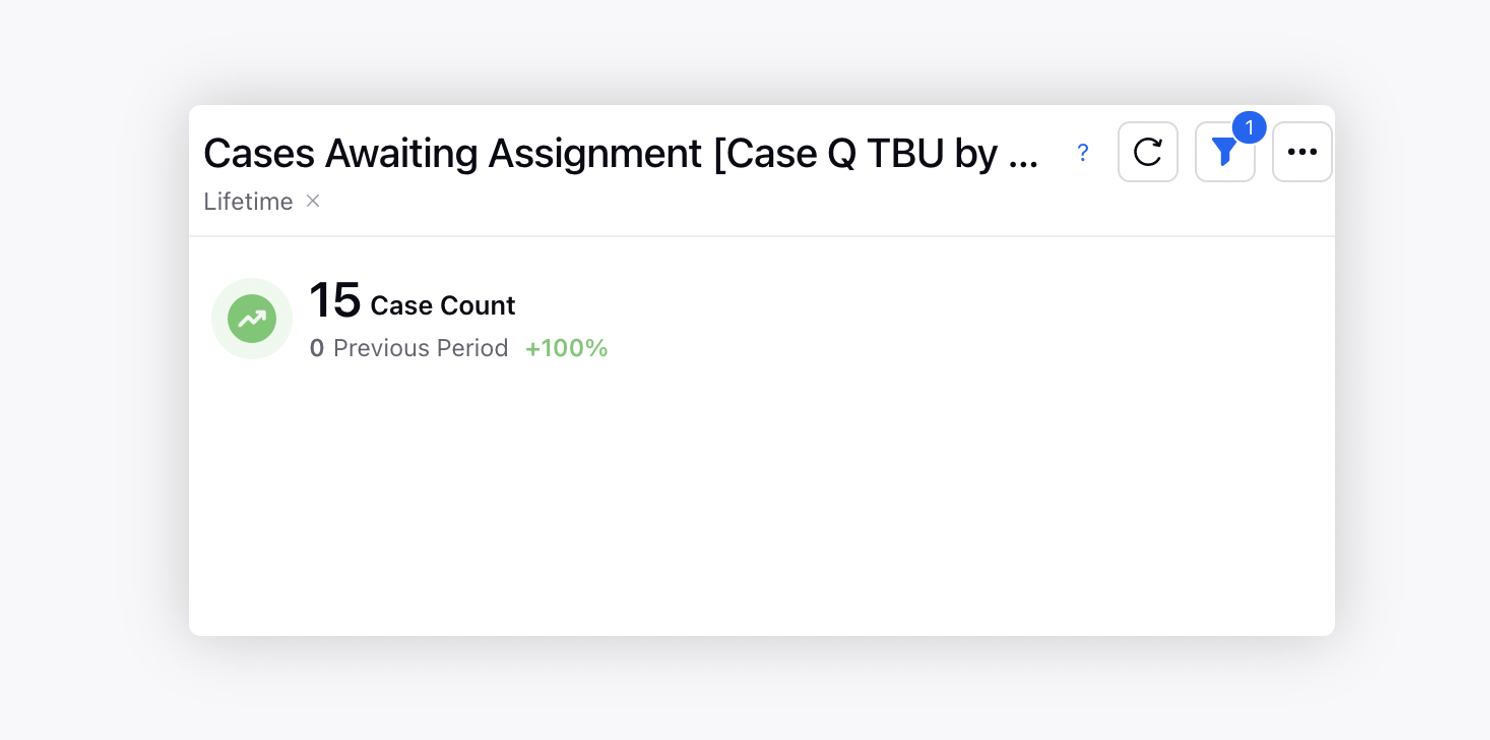
Cases Awaiting Assignment | Cases waiting in the queue for agent assignment | |
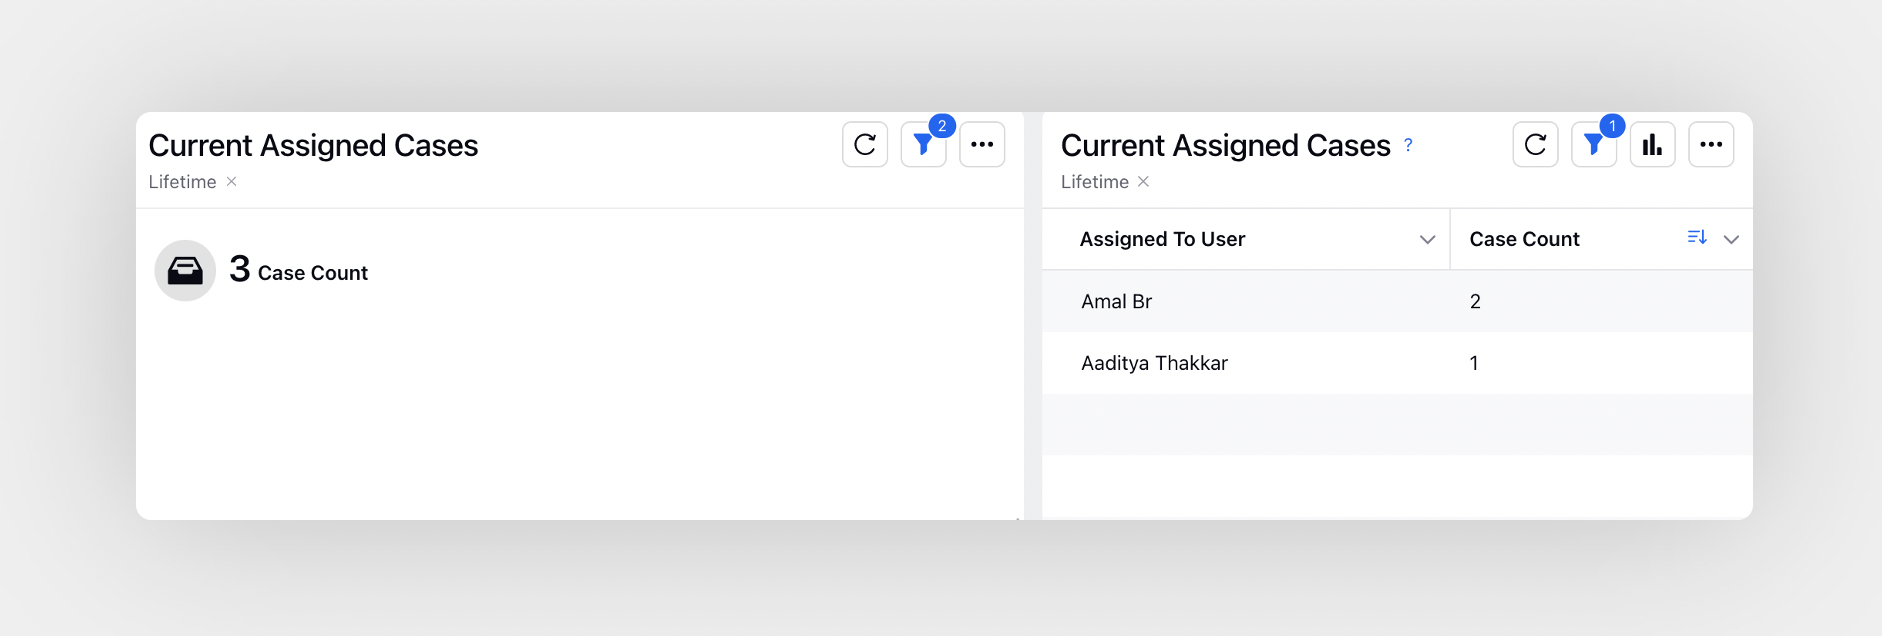
Current Assigned Cases | Measures the total cases (created in the time filter) currently assigned to a user | |
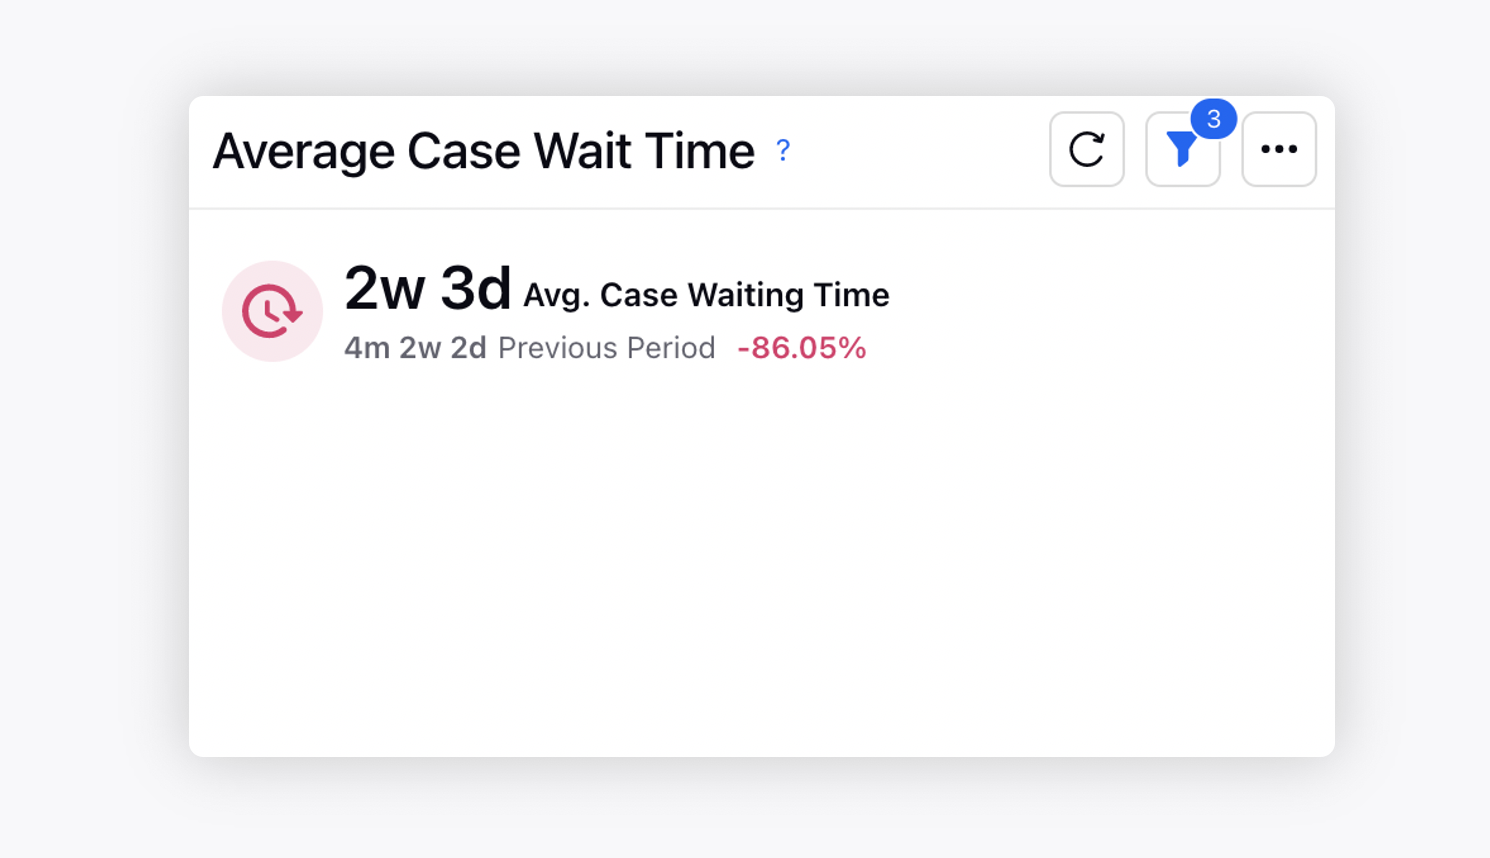
Average Case Wait Time | Time duration for which case rests in the Awaiting Assignment queue | |
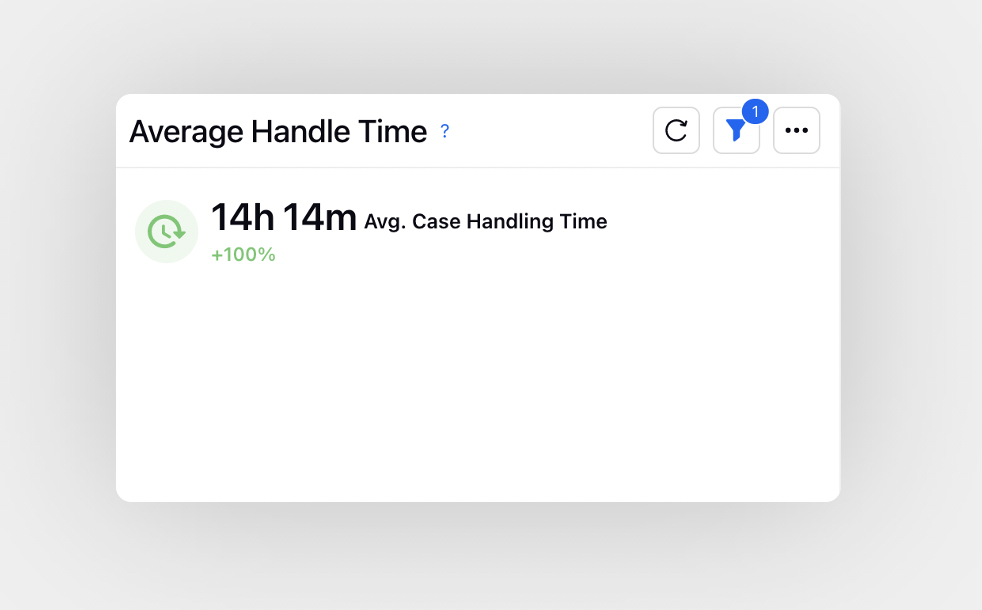
Average Handle Time | Time duration for which the agent was working on the case i.e. how long the processing clock was running | |
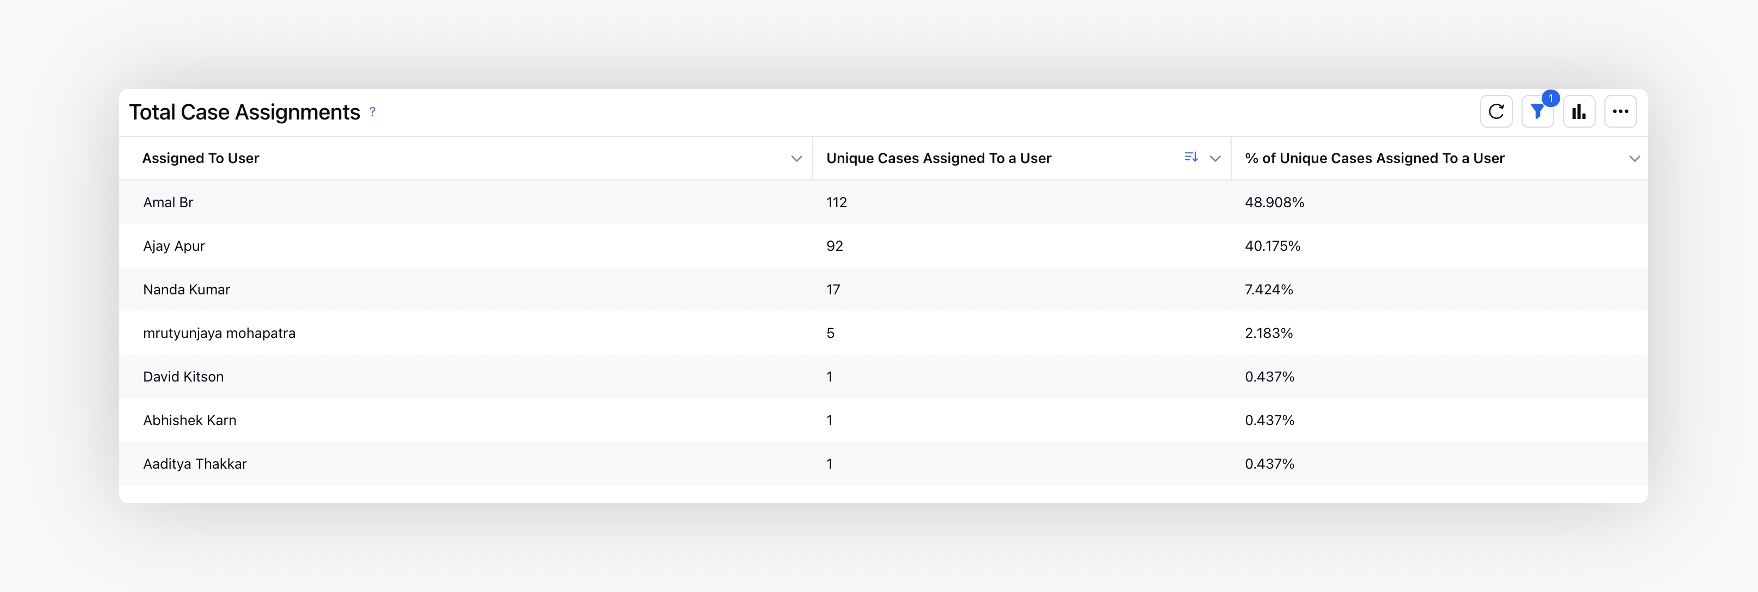
Total Case Assignments | Measures the total cases (created in the time filter) assigned to a user | |
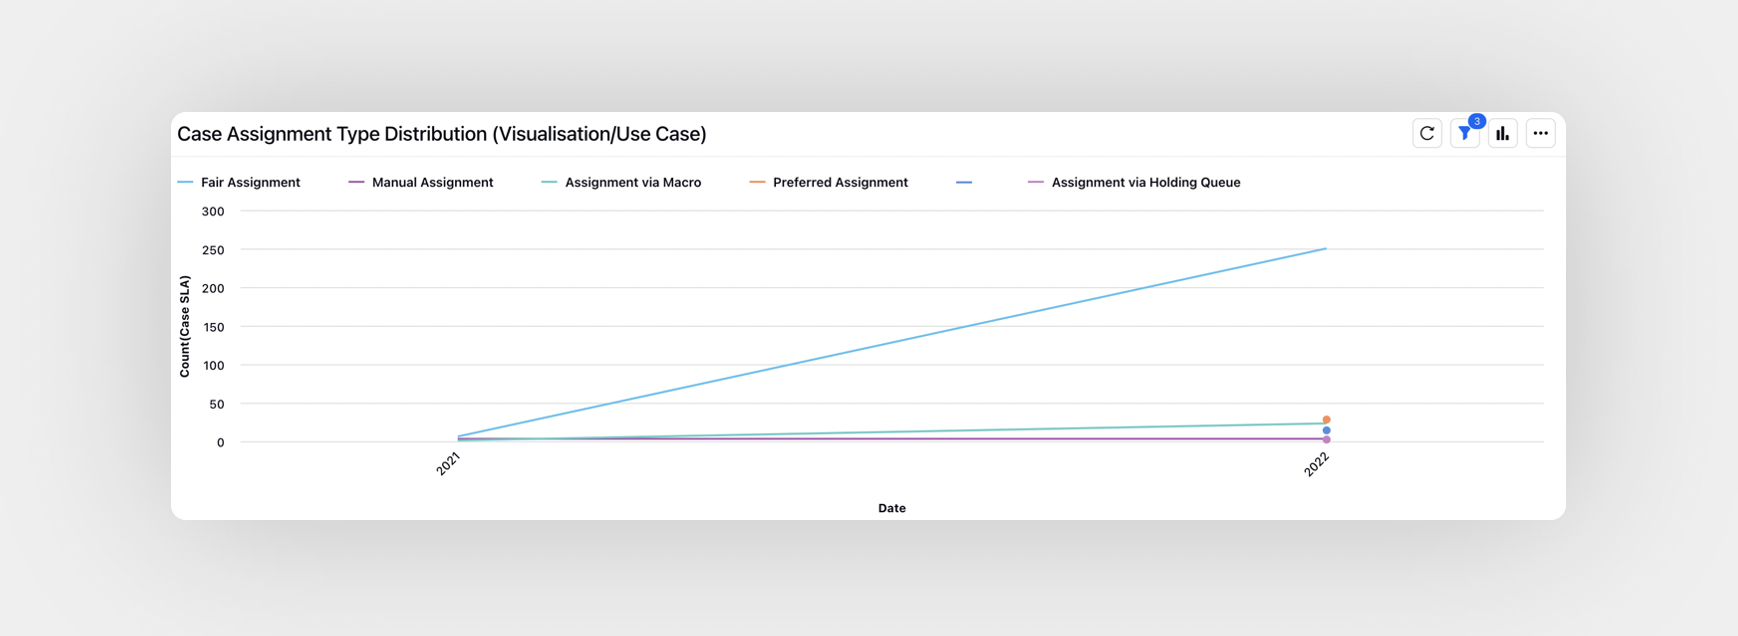
Case Assignment Type Distribution (Visualization/Use Case) | Cases classified by assignment method - day-wise visualization | |
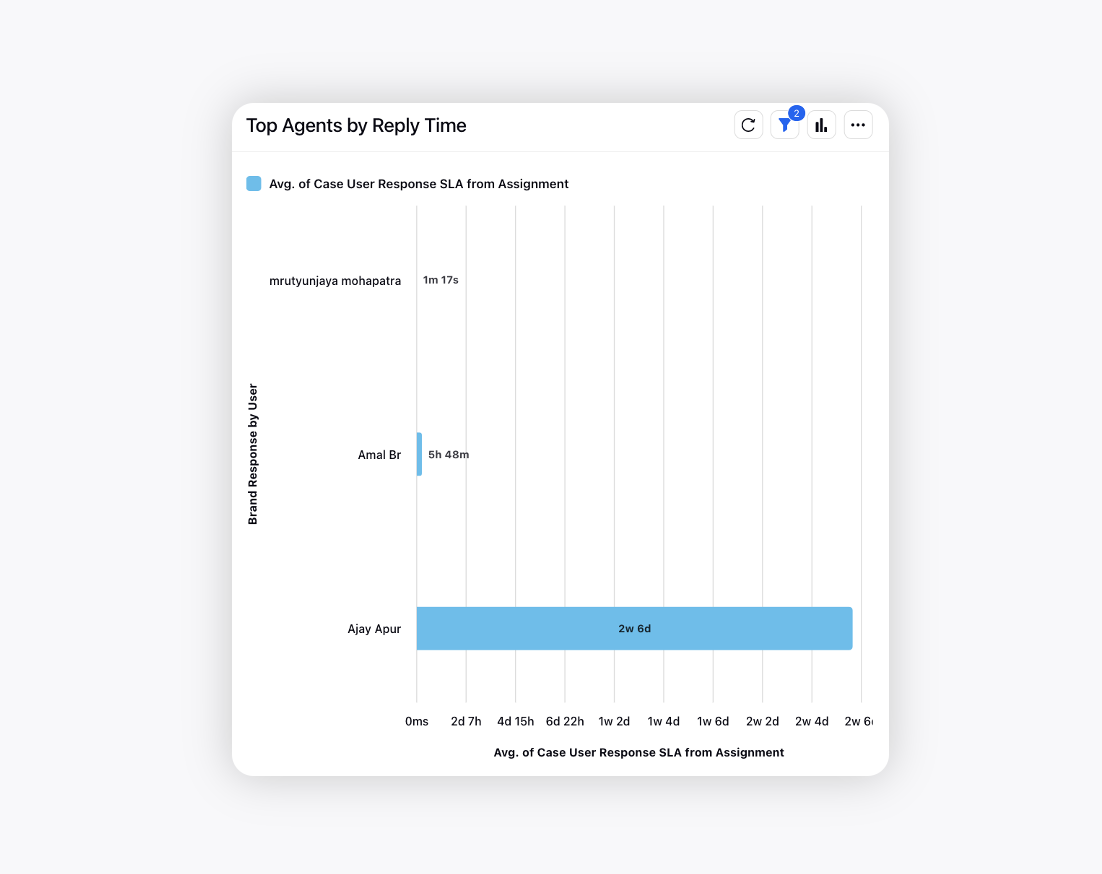
Top Agents by Reply Time | Response SLA of each agent | |
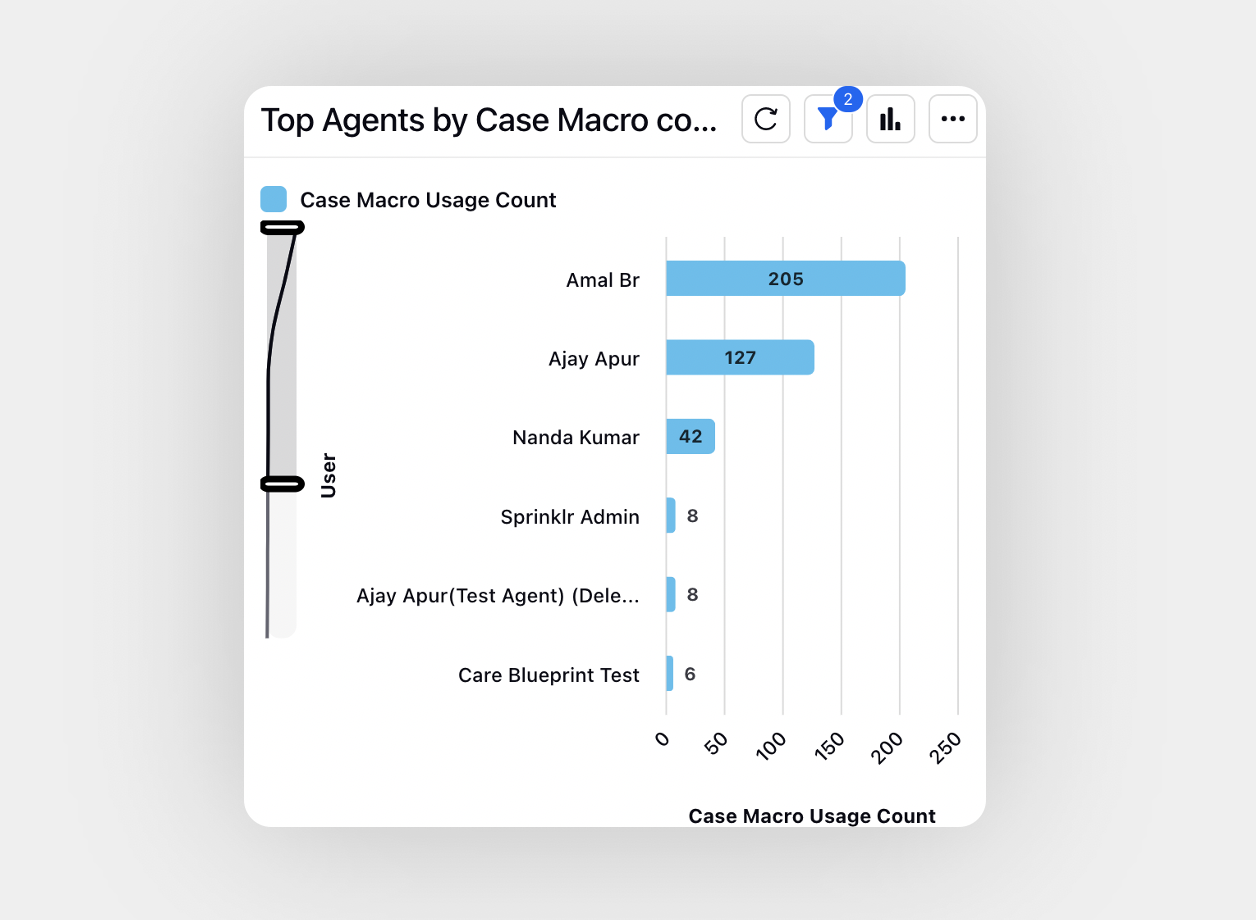
Top Agents by Case Macro Count | Number of case macros applied by each agent | |
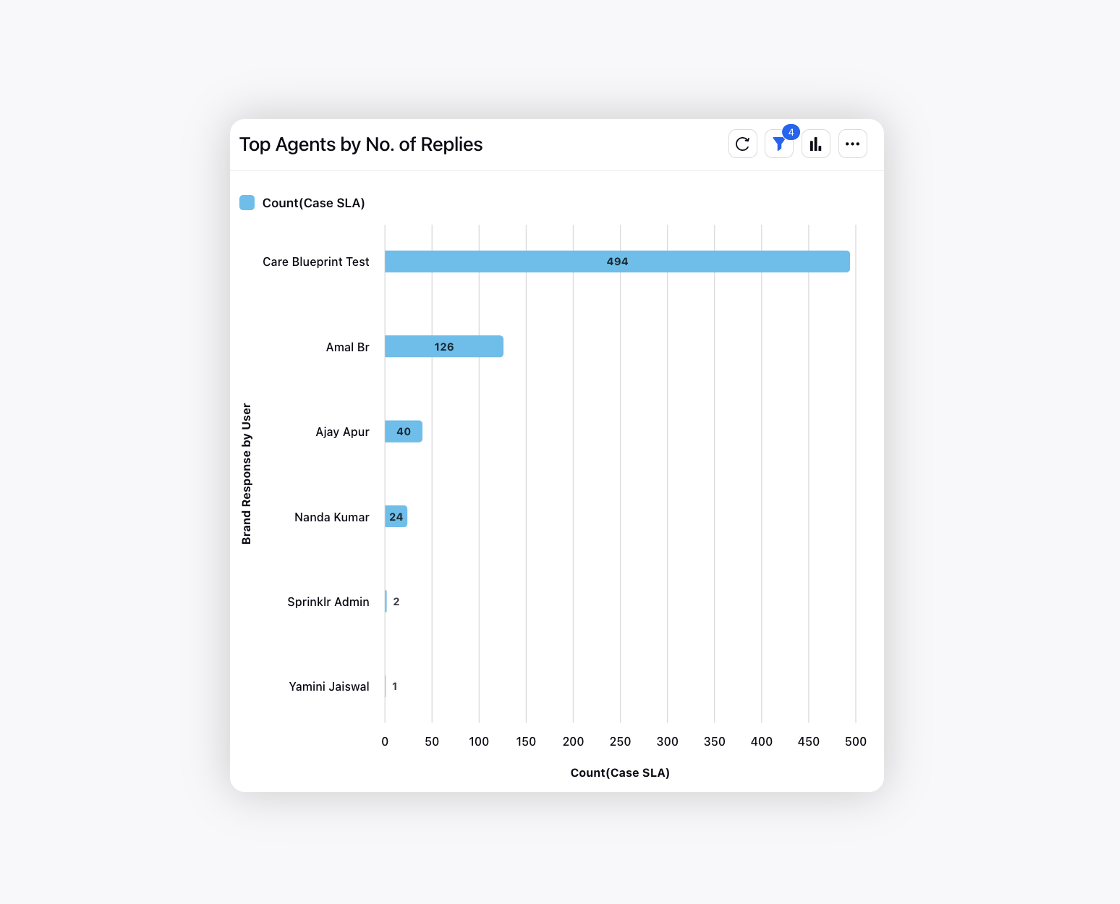
Top Agents by No. of Replies | Number of replies provided by each agent | |
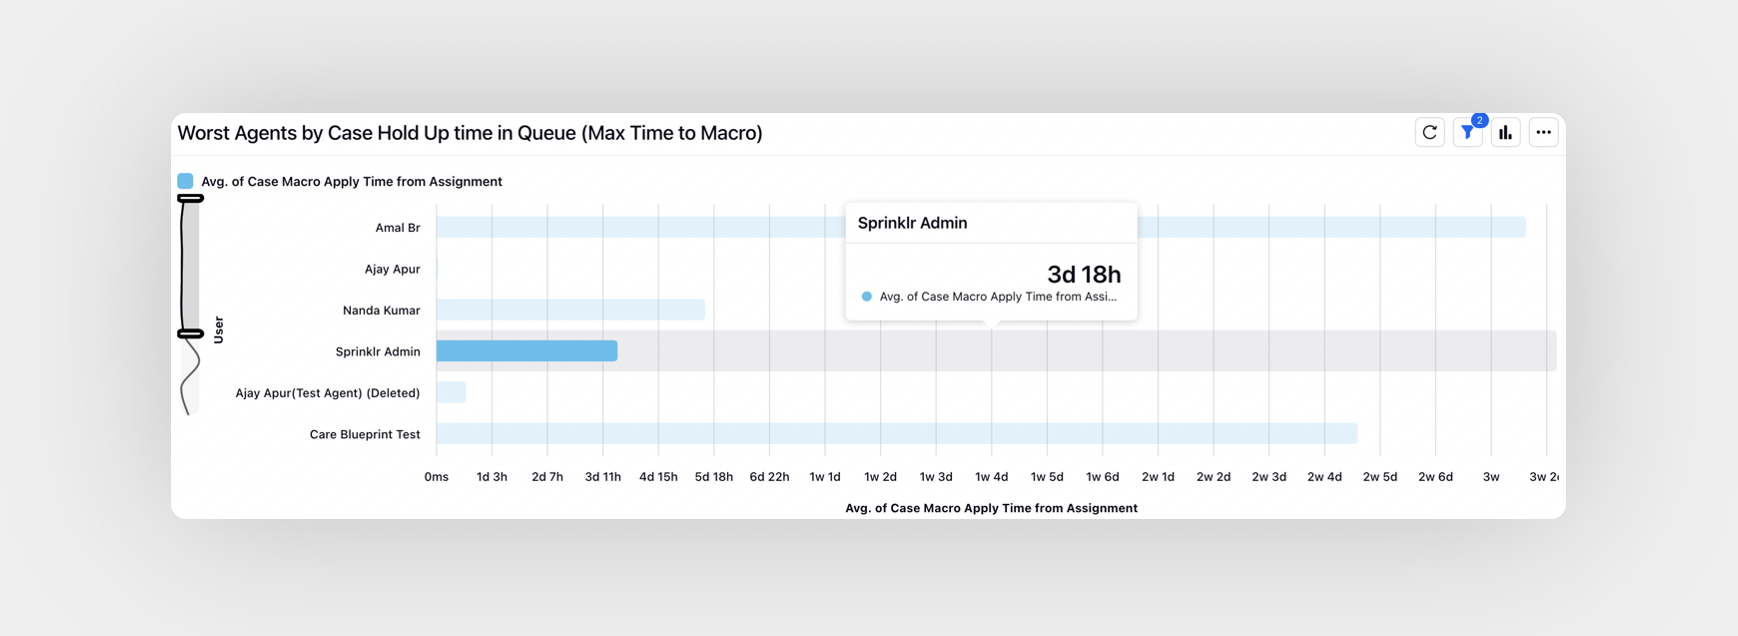
Worst Agents by Case Hold Up Time in Queue (Max Time to Macro) | Case hold time by each agent | |
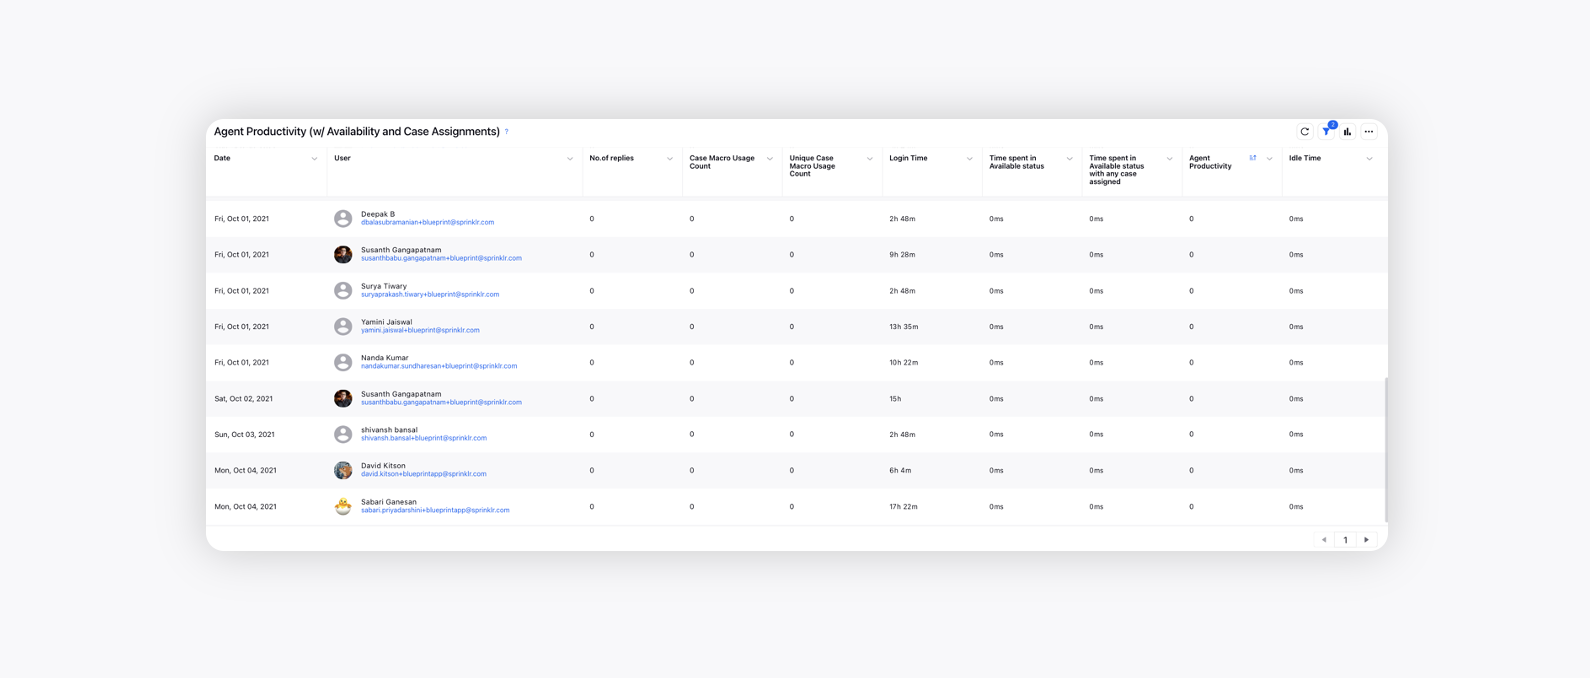
Agent Productivity (w/ Availability and Case Assignments) | This widget differs from "Agent Productivity" widget. It takes into account the amount of time an agent spent in "Available" status, in addition to Case Count and Macro Application | |
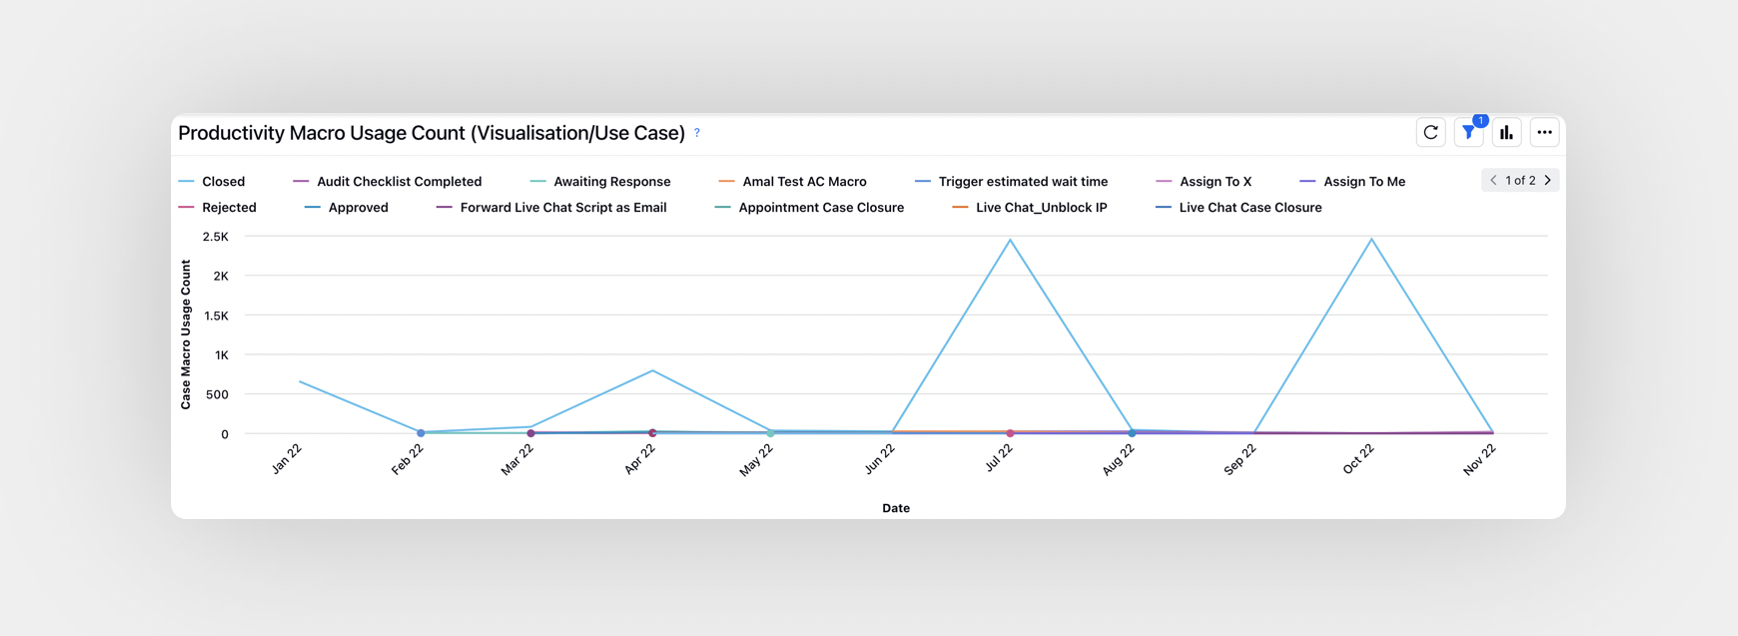
Productivity Macro Usage Count (Visualization/Use Case) | Number of times a macro was applied on a case | |
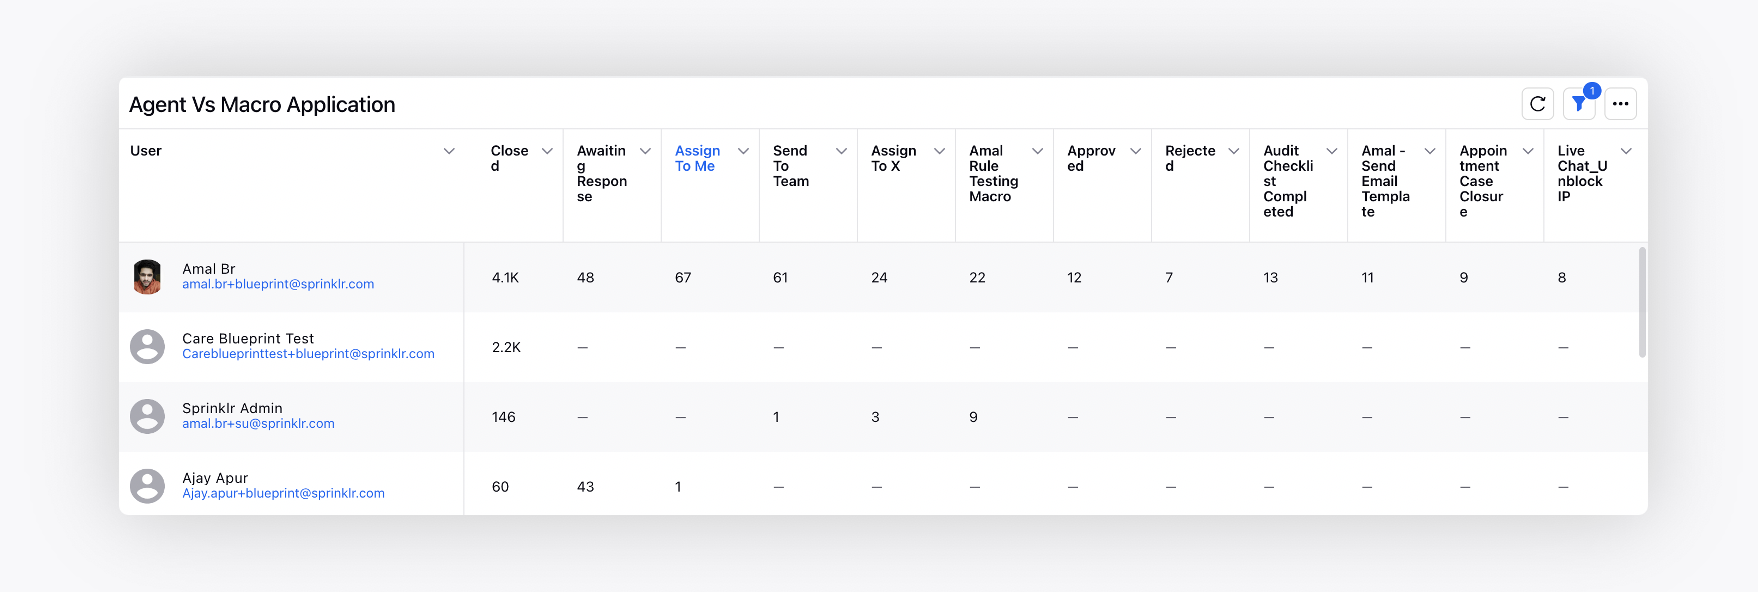
Agent vs. Macro Application | The count of each macro used by the agents | |
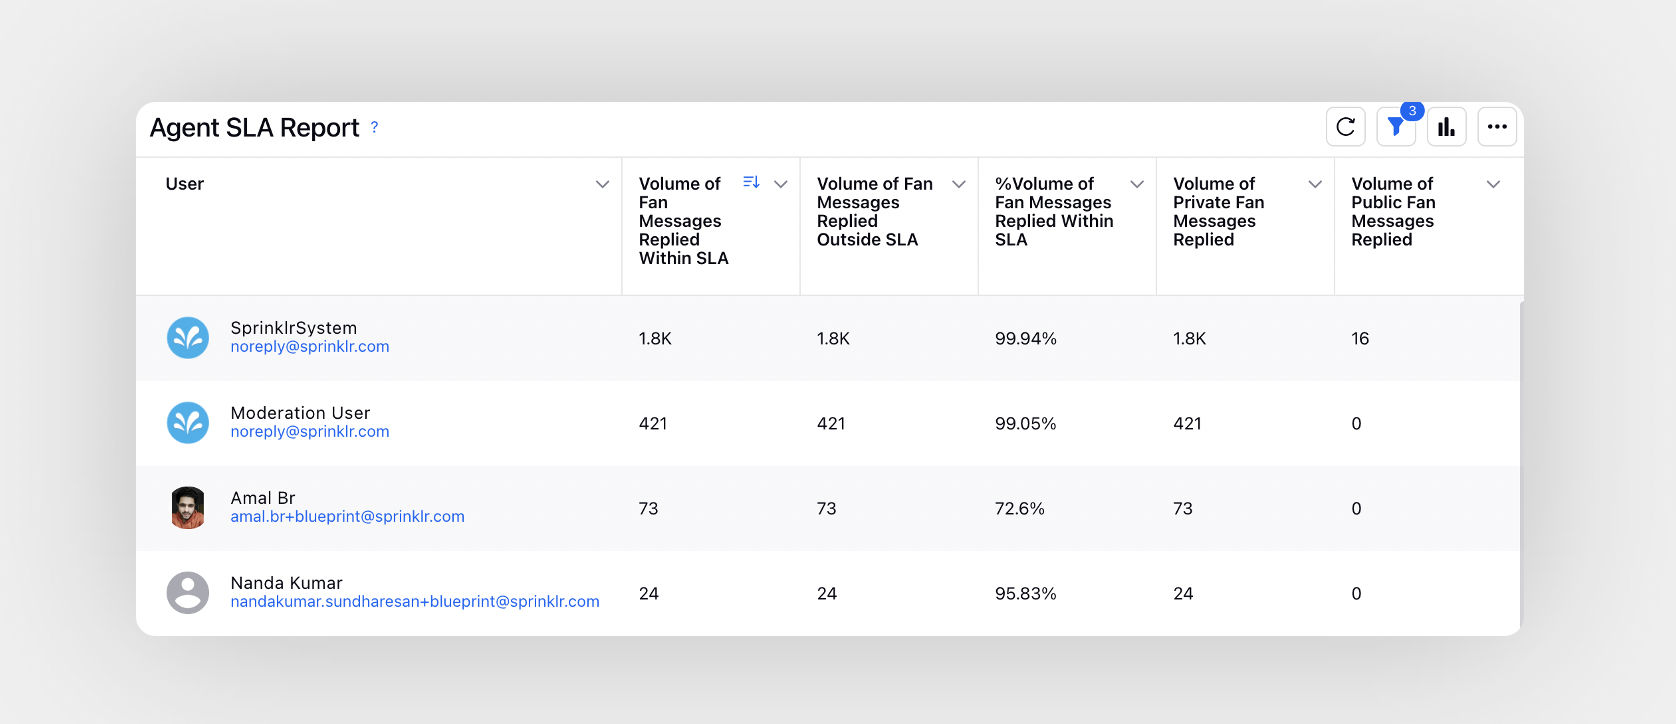
Agent SLA Report | This widget shows "Volume of Fan Messages Replied Within SLA | Volume of Fan Messages Replied Outside SLA | %Volume of Fan Messages Replied Within SLA | Volume of Private Fan Messages Replied | Volume of Public Fan Messages Replied" | |
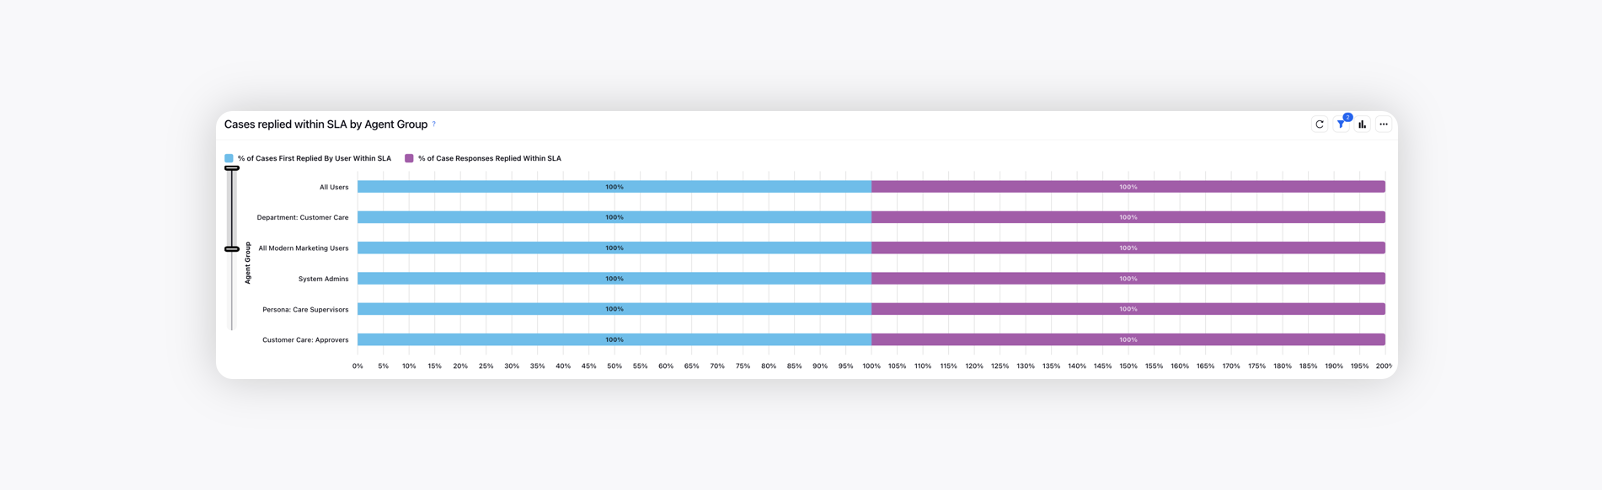
Cases Replied within SLA by Agent Group | Number of cases for which 1st response by the user was shared within the specified SLA/ Number of cases with an agent reponse Agent Group = Name of the work group the agent is assigned to (client specific) | |
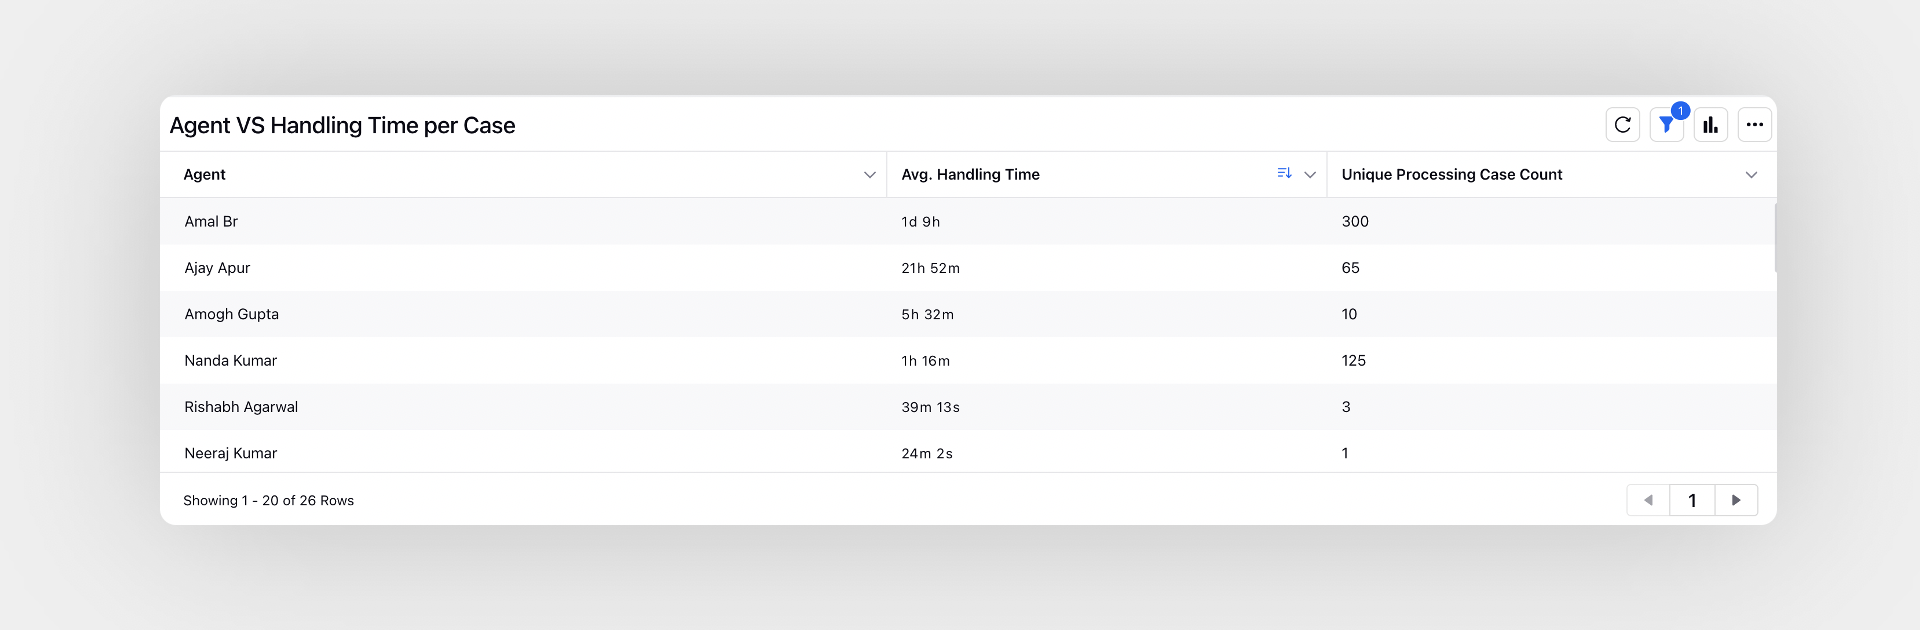
Agent vs. Handling Time per Case | This widget shows the "Avg. Handling Time | Unique Processing Case Count" | |
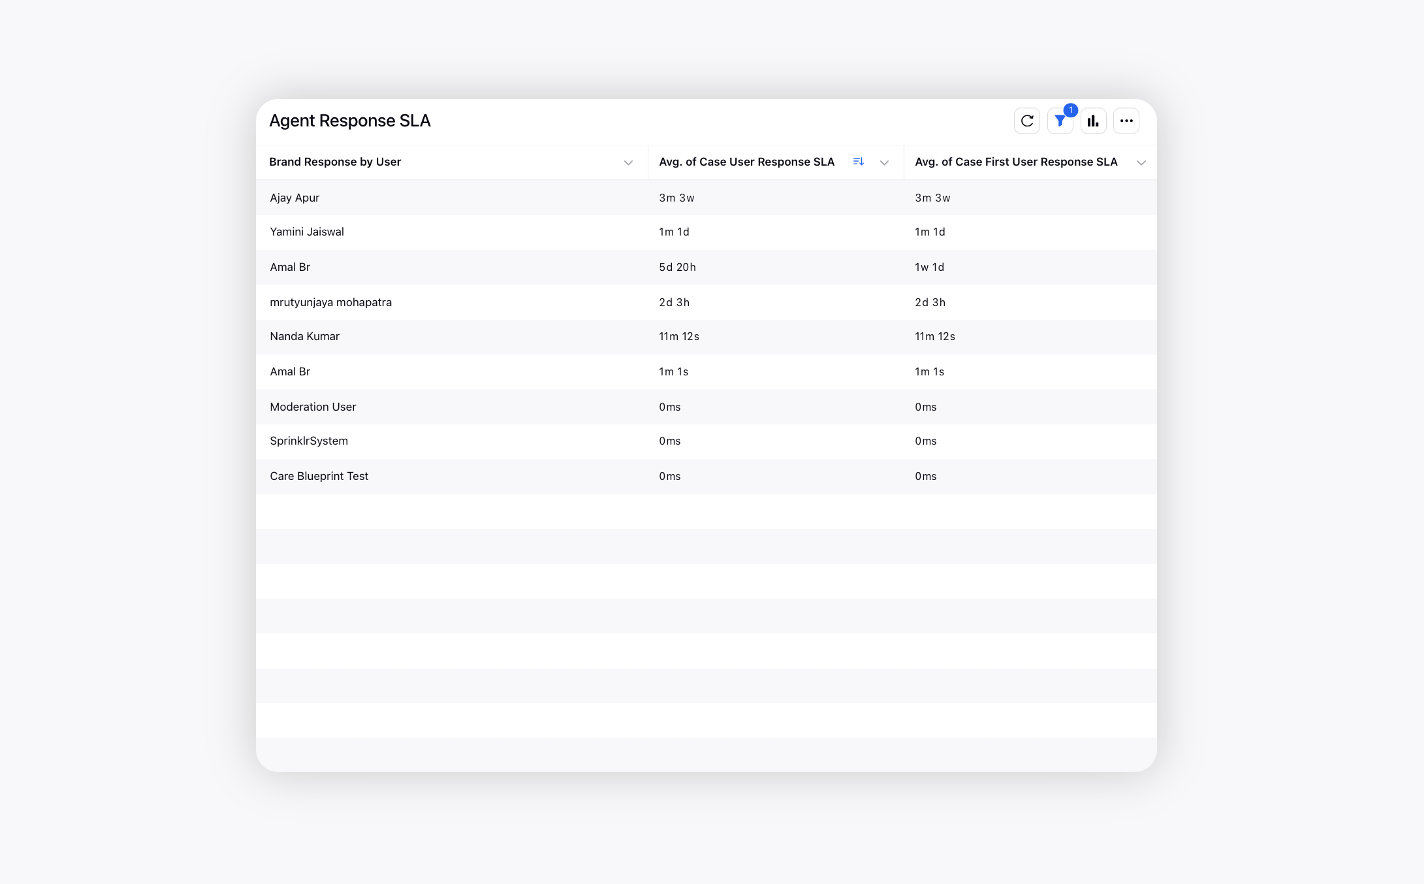
Agent Response SLA | This widget shows 'Avg. of Case User Response SLA | Avg. of Case First User Response SLA' | |
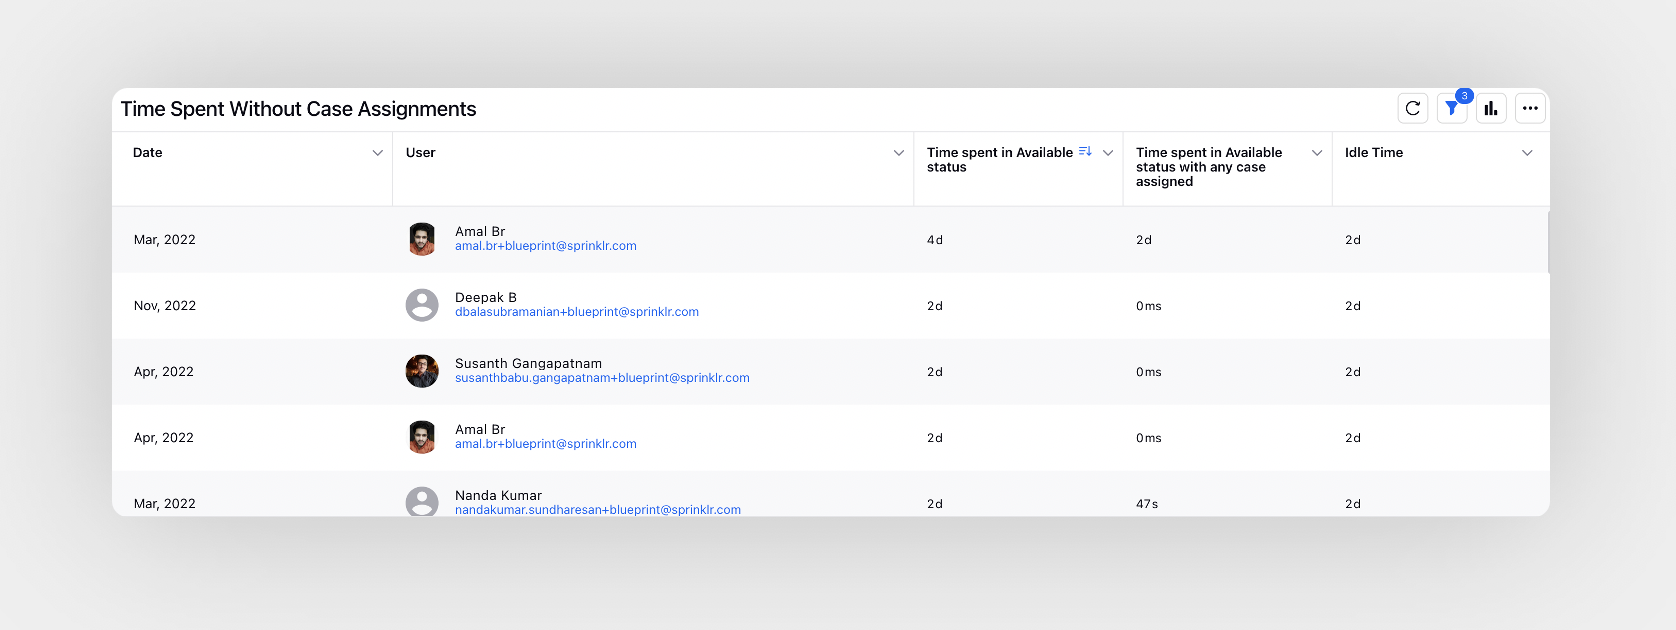
Time Spent without Case Assignments | This widget shows "Time spent in Available status | Time spent in Available status with any case assigned | Idle Time" | |
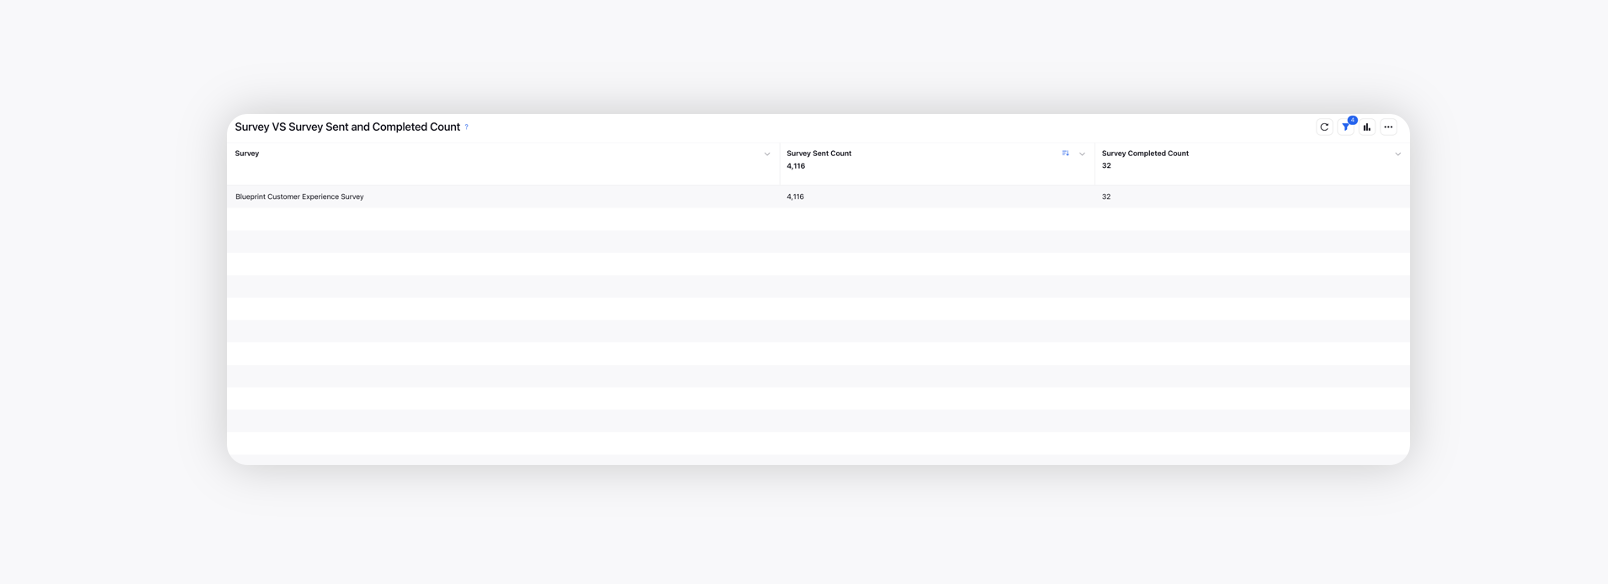
Survey vs. Survey Sent and Complted Count | Survey and its sent and completed count by customers | |
Stream Chat Insights
Widget | Description | Image |
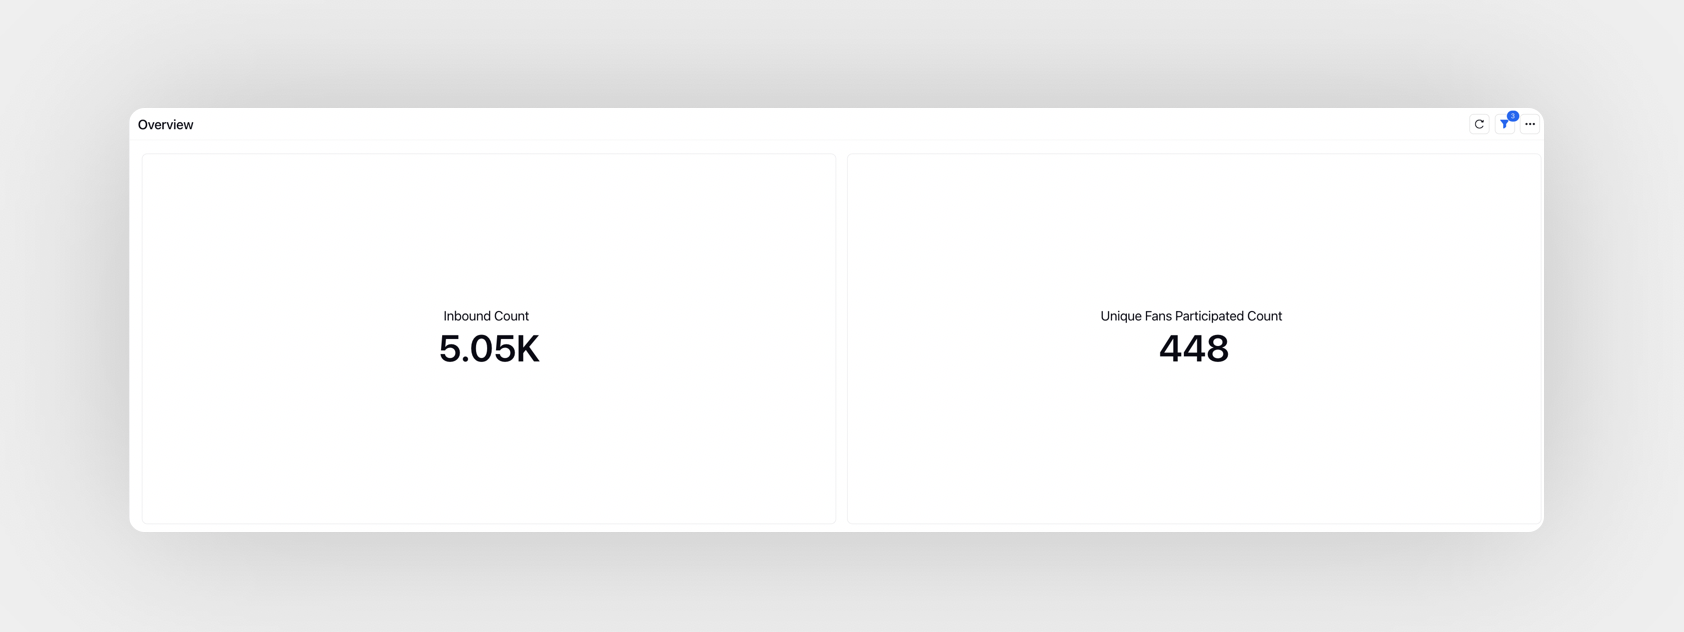
Overview | Message count for number of different users participatd in chat, applicable for specific live stream | |
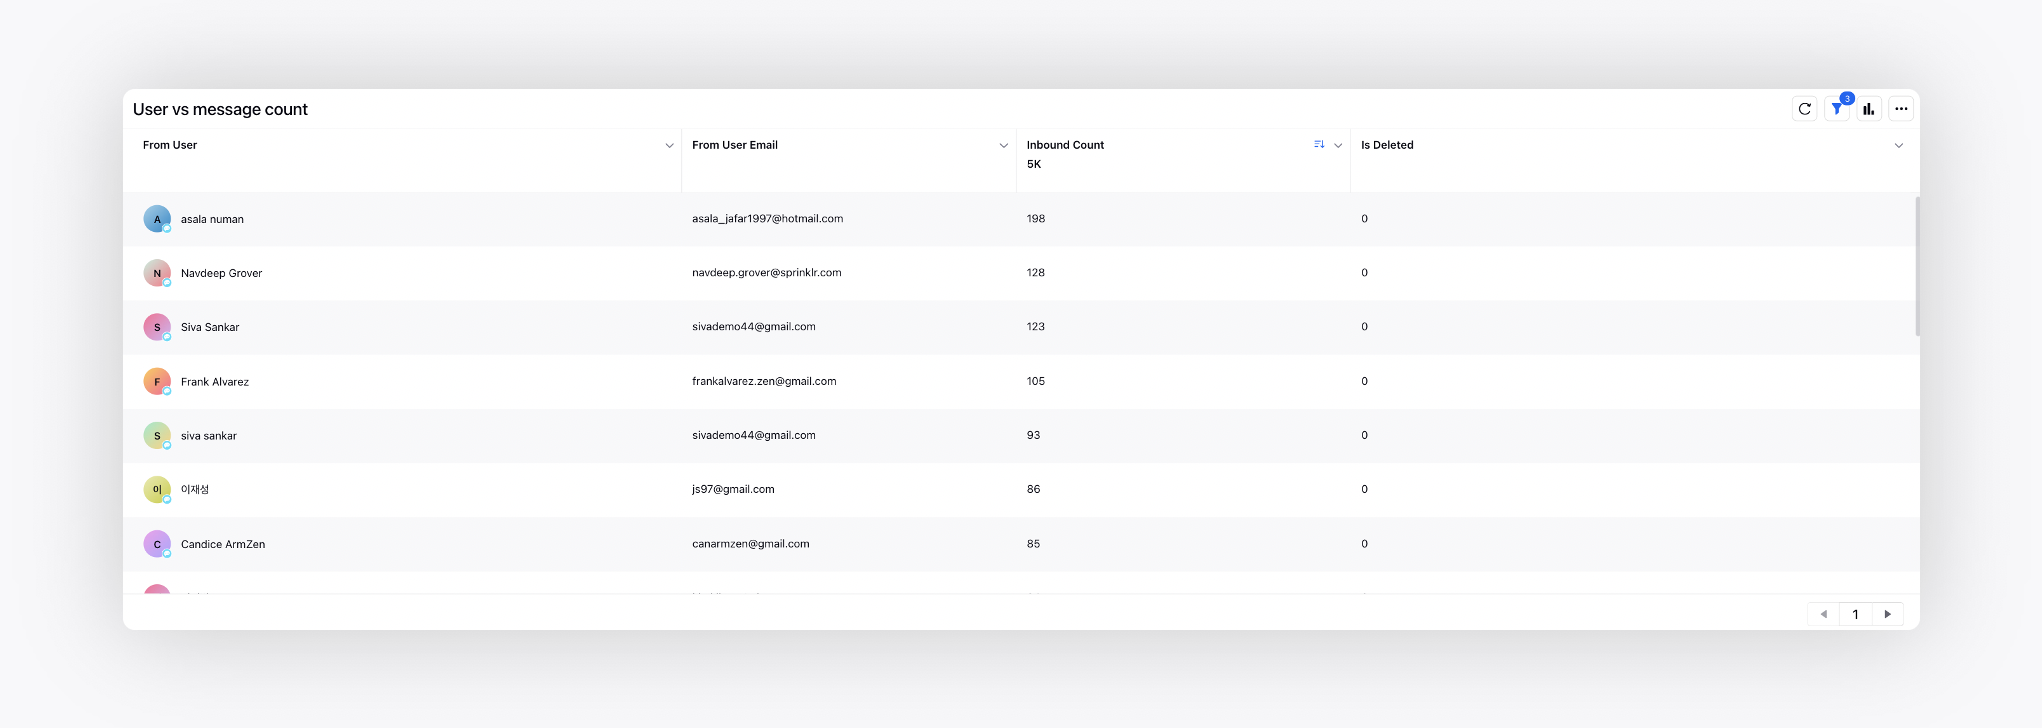
User vs. Message Count | Count of messages published by users containing deleted information, applicable for specific live stream | |
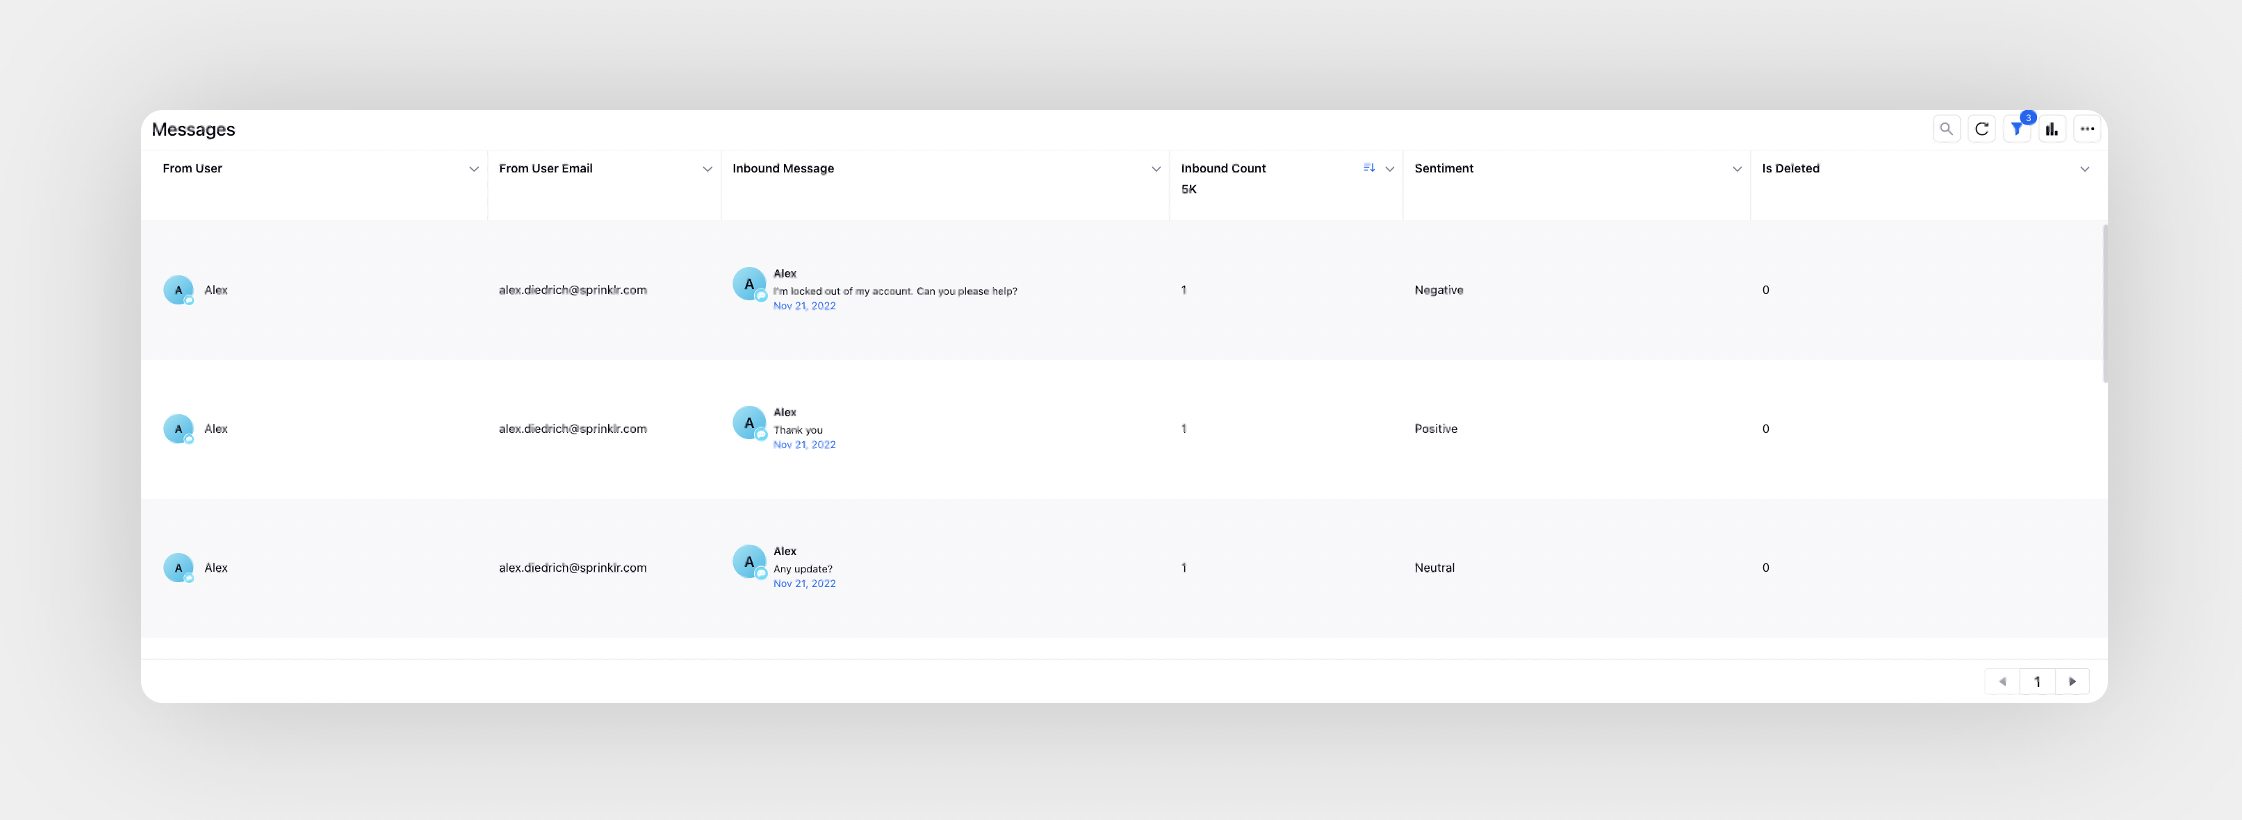
Messages | Sentiment of different messages published by users against deleted status for specific live stream | |
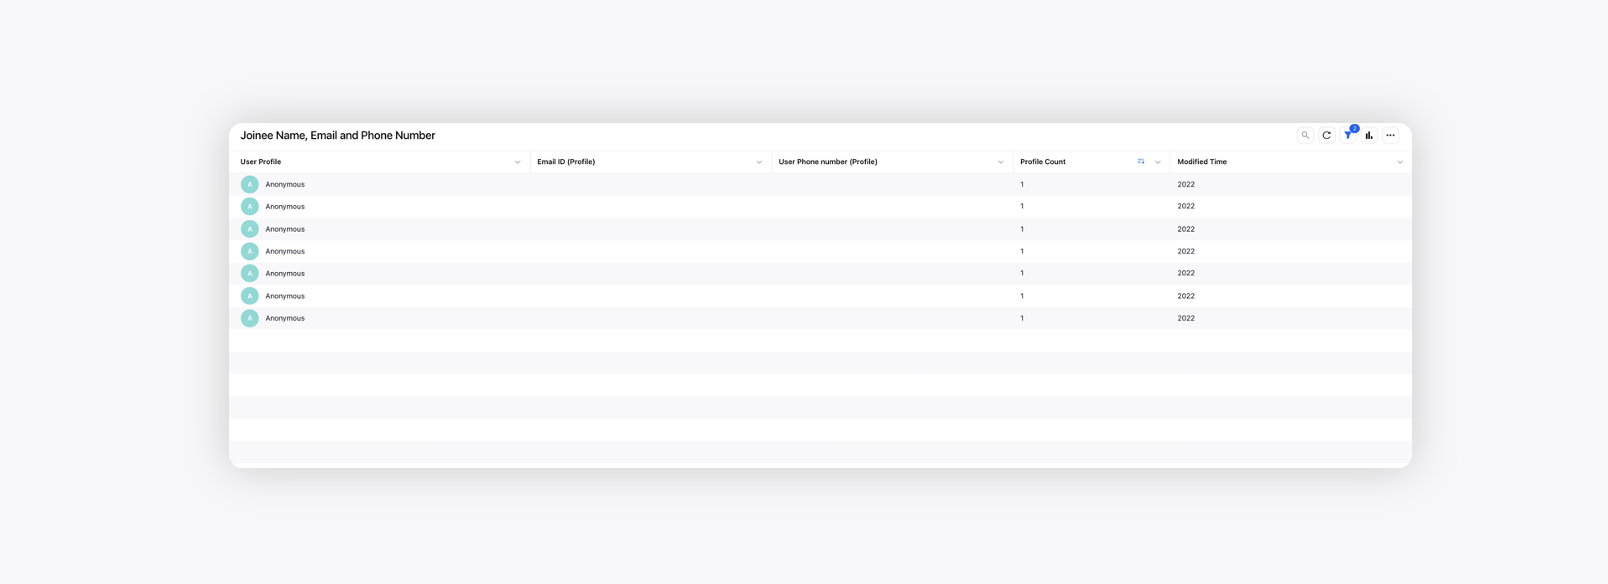
Joinee Name, Email and Phone Number | Number of profiles associated to their email, phone number with their modified time, applicable for specific live stream | |
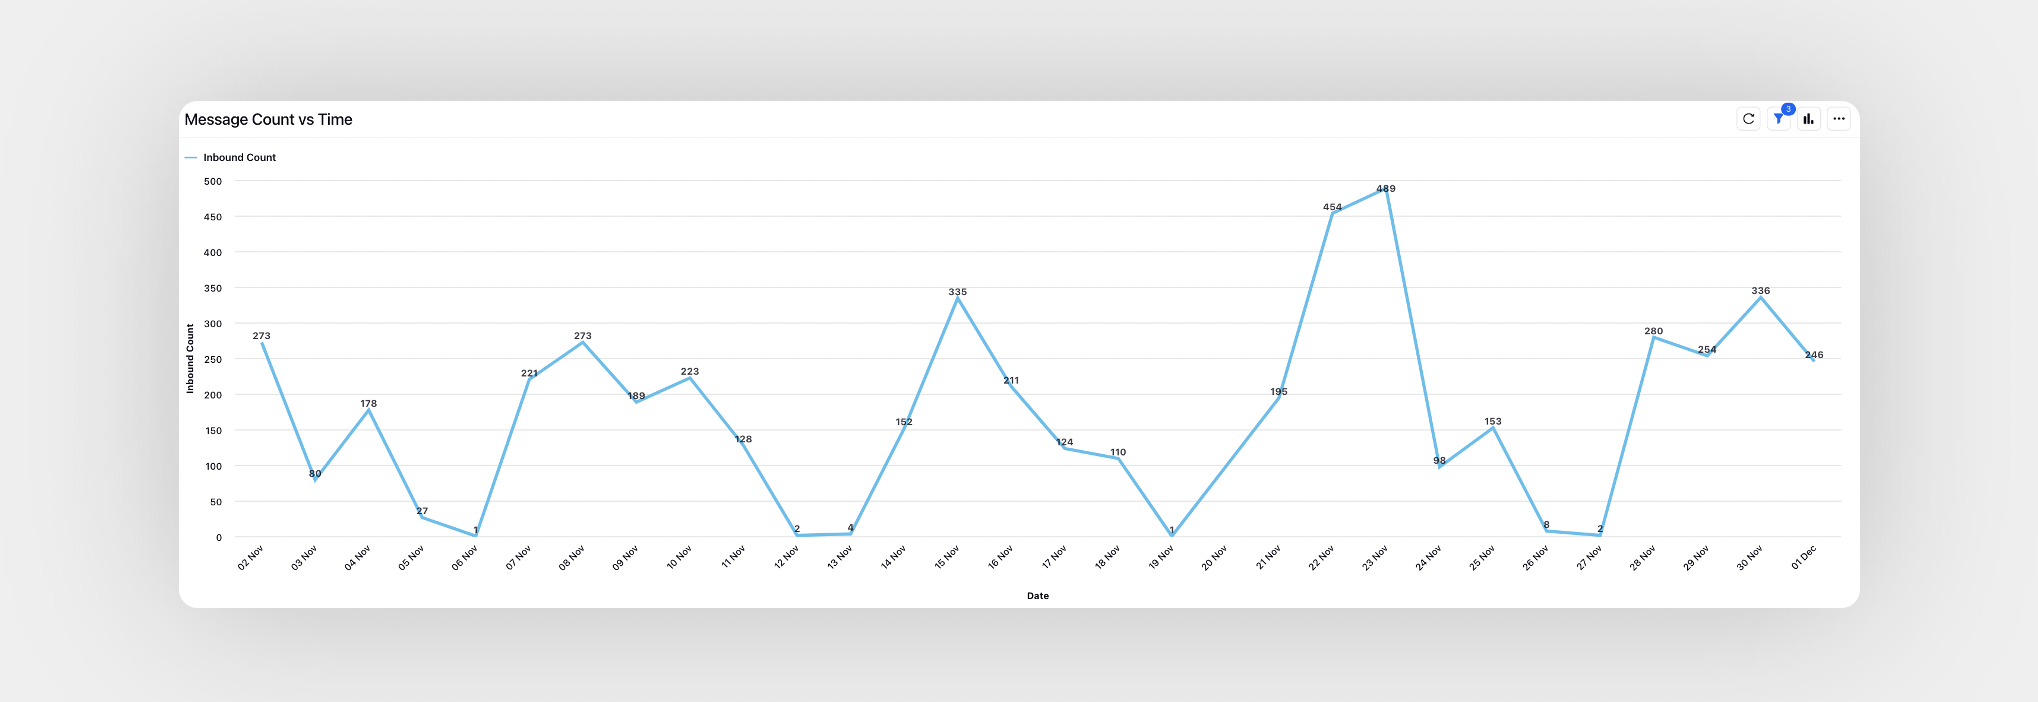
Message Count vs. Time | Message count w.r.t. the published date, applicable for specific live stream | |
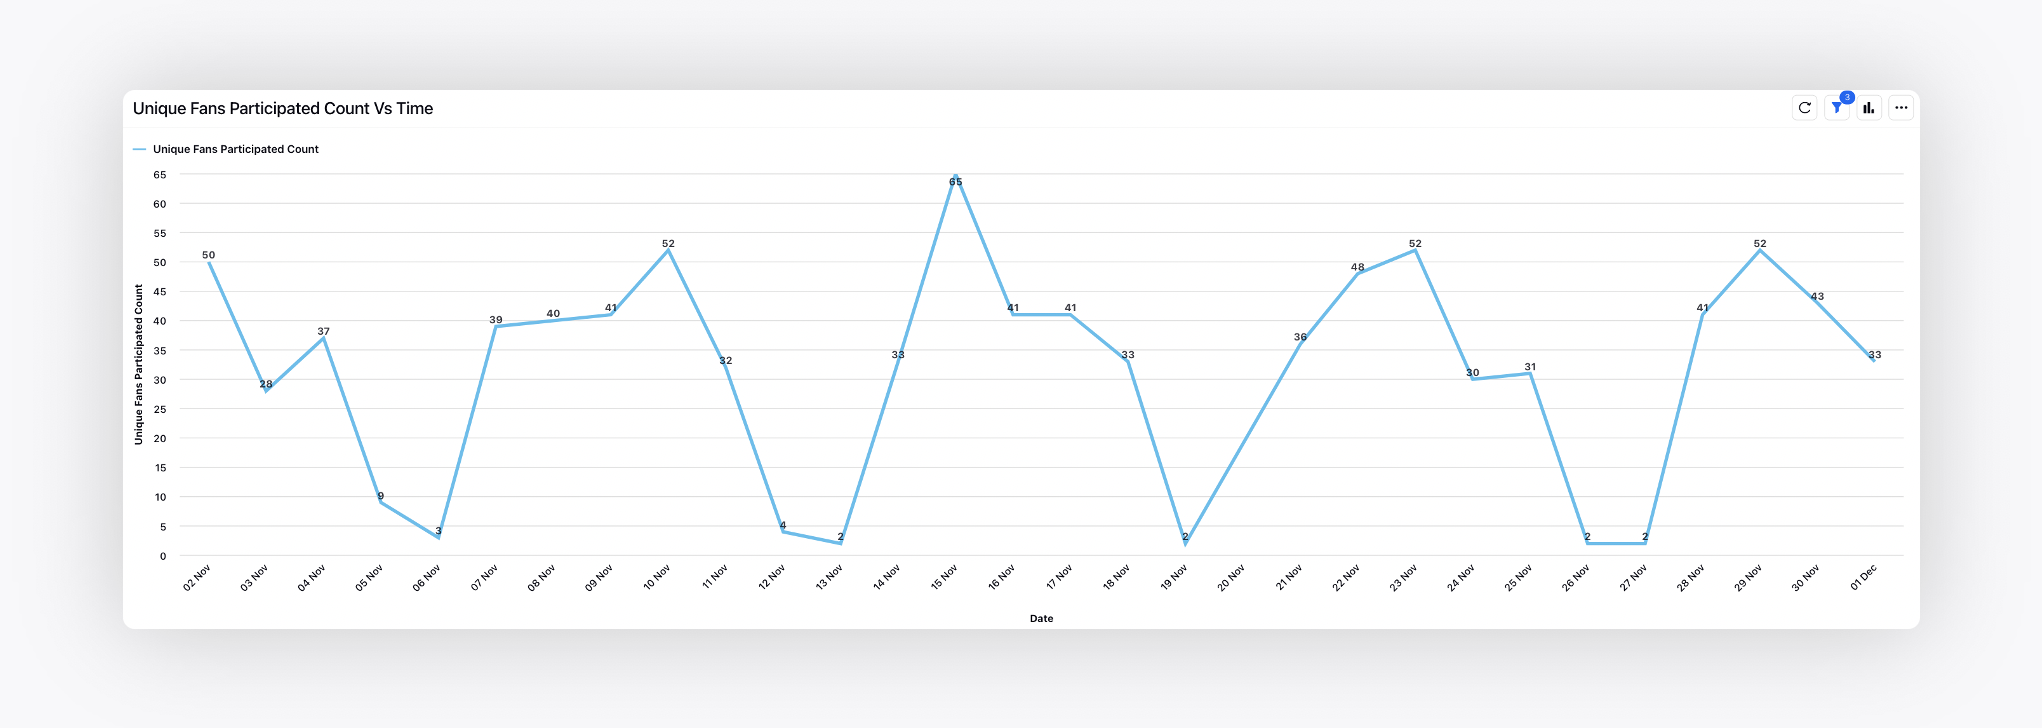
Unique Fans Participated Count vs. Time | Number of unique fans participated in the chat w.r.t. date, applicable for specific live stream | |
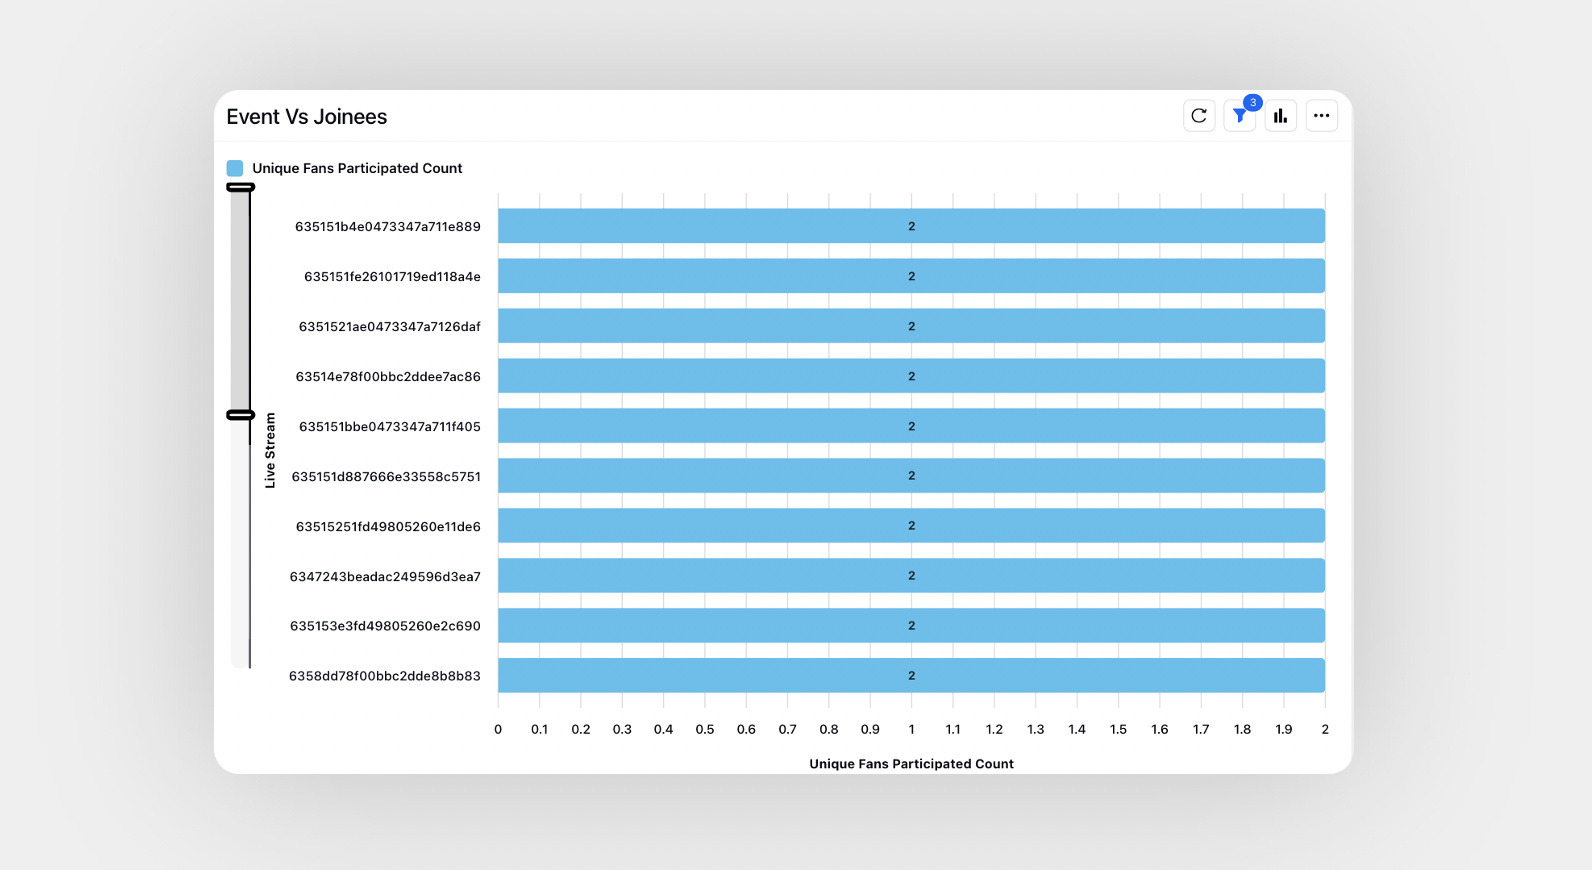
Event vs. Joinees | Number of unique fans participated in the chat against different live streams | |
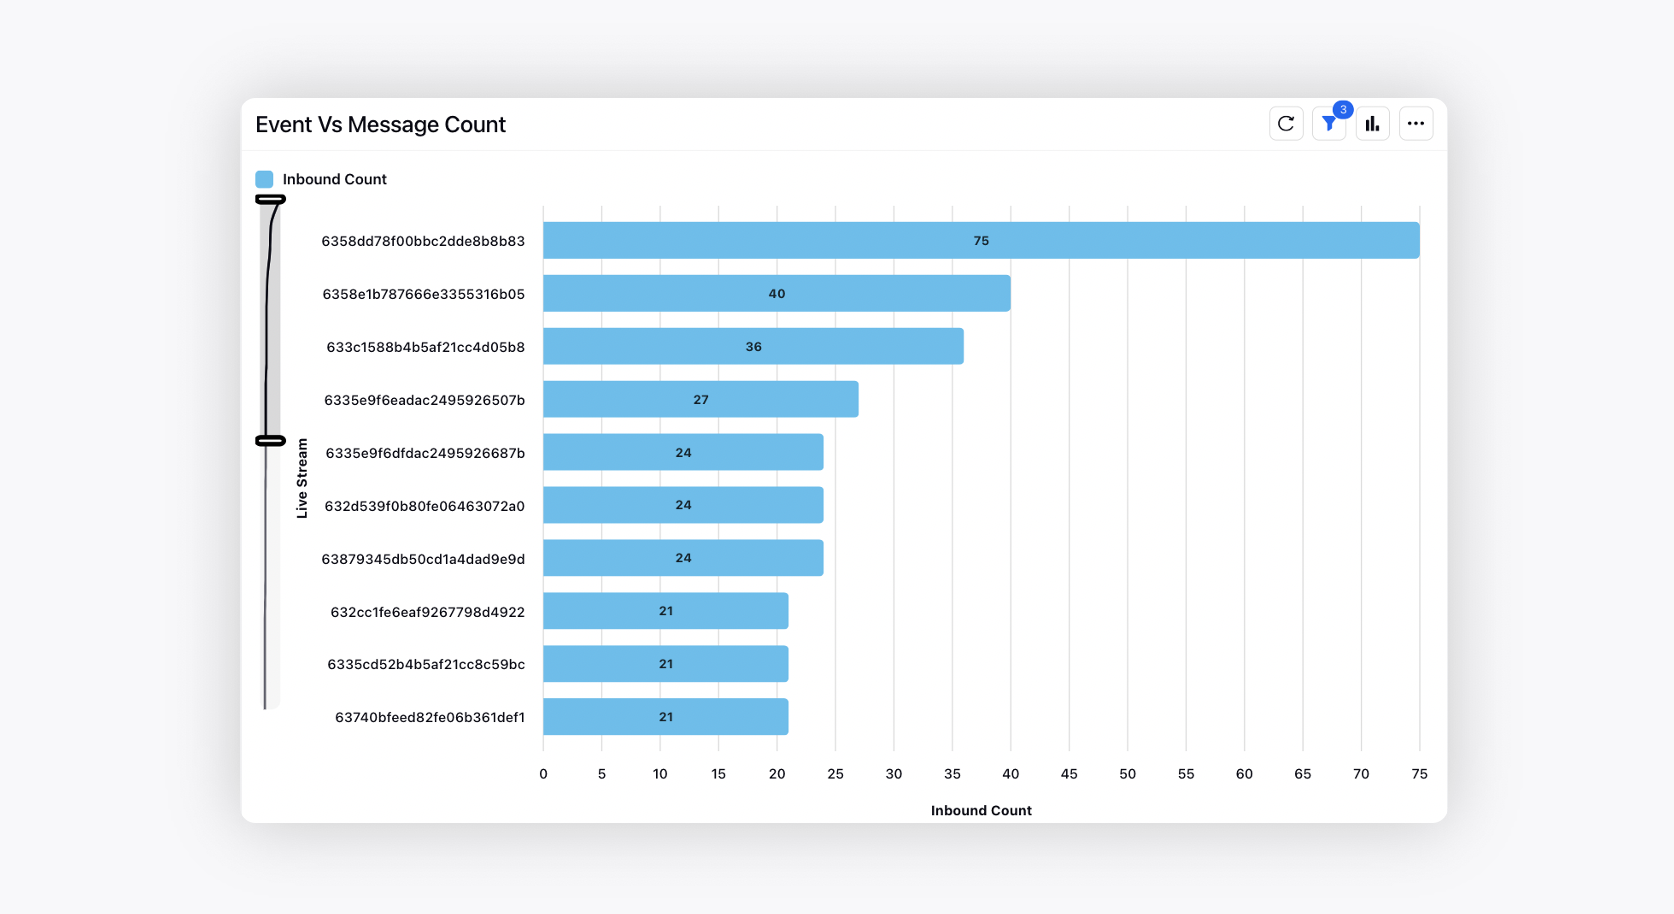
Event vs. Message Count | Number of messages against different live streams | |