Conversation Cluster
Updated
Conversation Cluster Report: Actions & Interactions
In this article, we will help you get familiar with the actions and interactions you can take in the Conversation Cluster report.
After creating and analyzing the Conversation Cluster report in Conversation Insights, there are several actions and interactions you can take in the Conversation Cluster report. Here's the list –
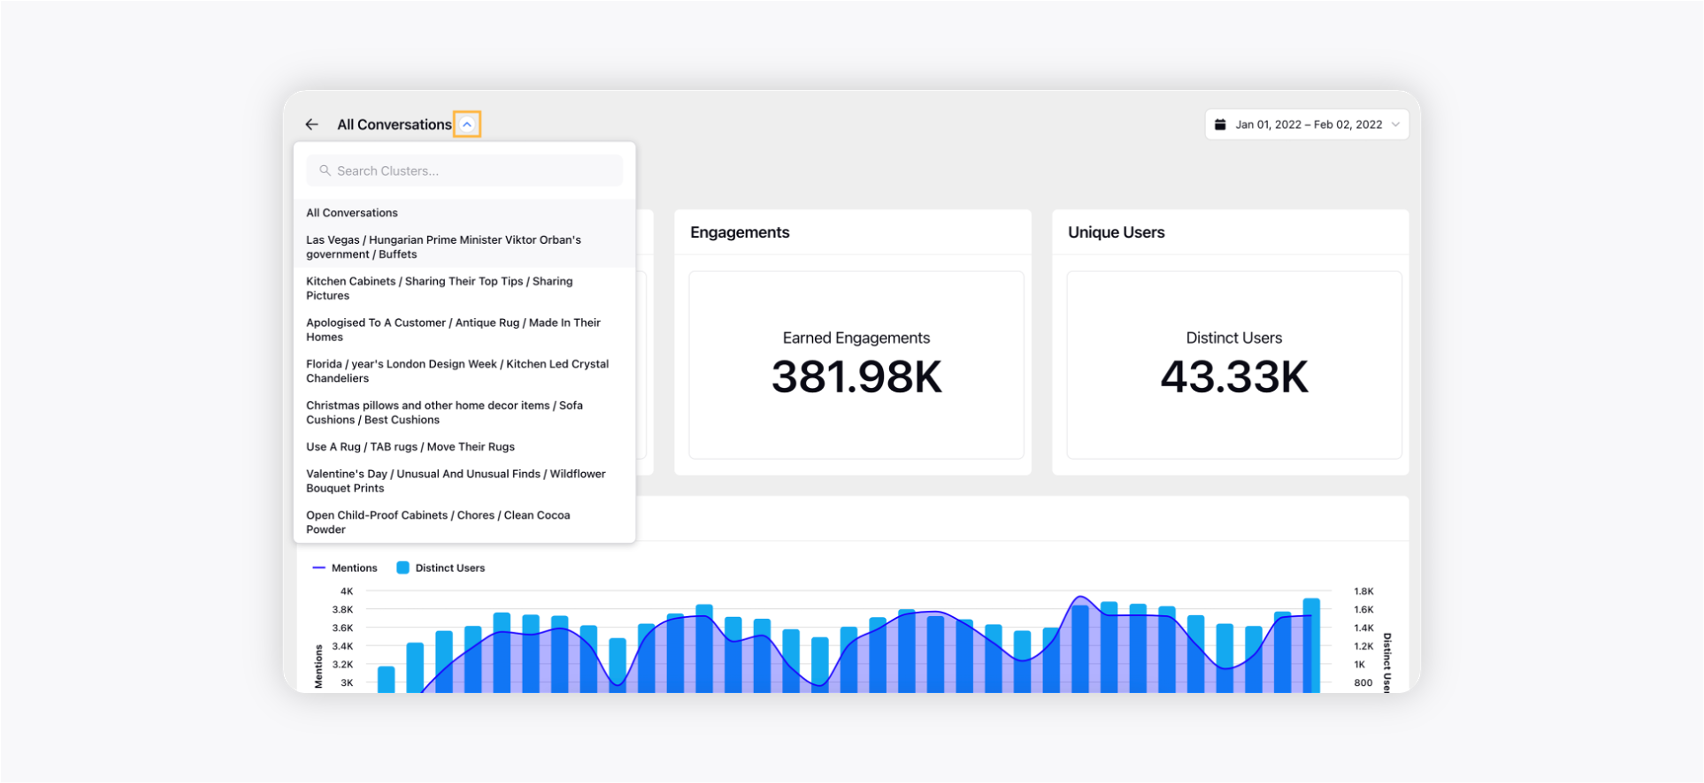
Double Click on Cluster Label (to view sub-clusters)
Note:
|
Single-click on the Cluster label
When you single-click on any cluster label, that particular cluster will be highlighted. Besides, nodes connected with that particular cluster will also be highlighted so the relationship can be seen clearly. Upon doing that, the right pane will be updated with the information about the selected cluster: List of Top-subclusters by Volume (if any), Top Keywords, and Conversation Stream. This is demonstrated by the GIF below:

Double-click on the Cluster label
When you double-click on the cluster label, the widget will zoom in to the particular cluster and all the sub-clusters within it will be shown. You can come out of that particular cluster by simply pressing the Esc key or clicking the back button on the widget. This is demonstrated by the GIF below:

Drag & Reposition labels
You can drag and reposition the labels to place them at the desired location. This is demonstrated by the GIF below:
Right-click on Cluster label
When you right-click on the cluster label, you will see different options –
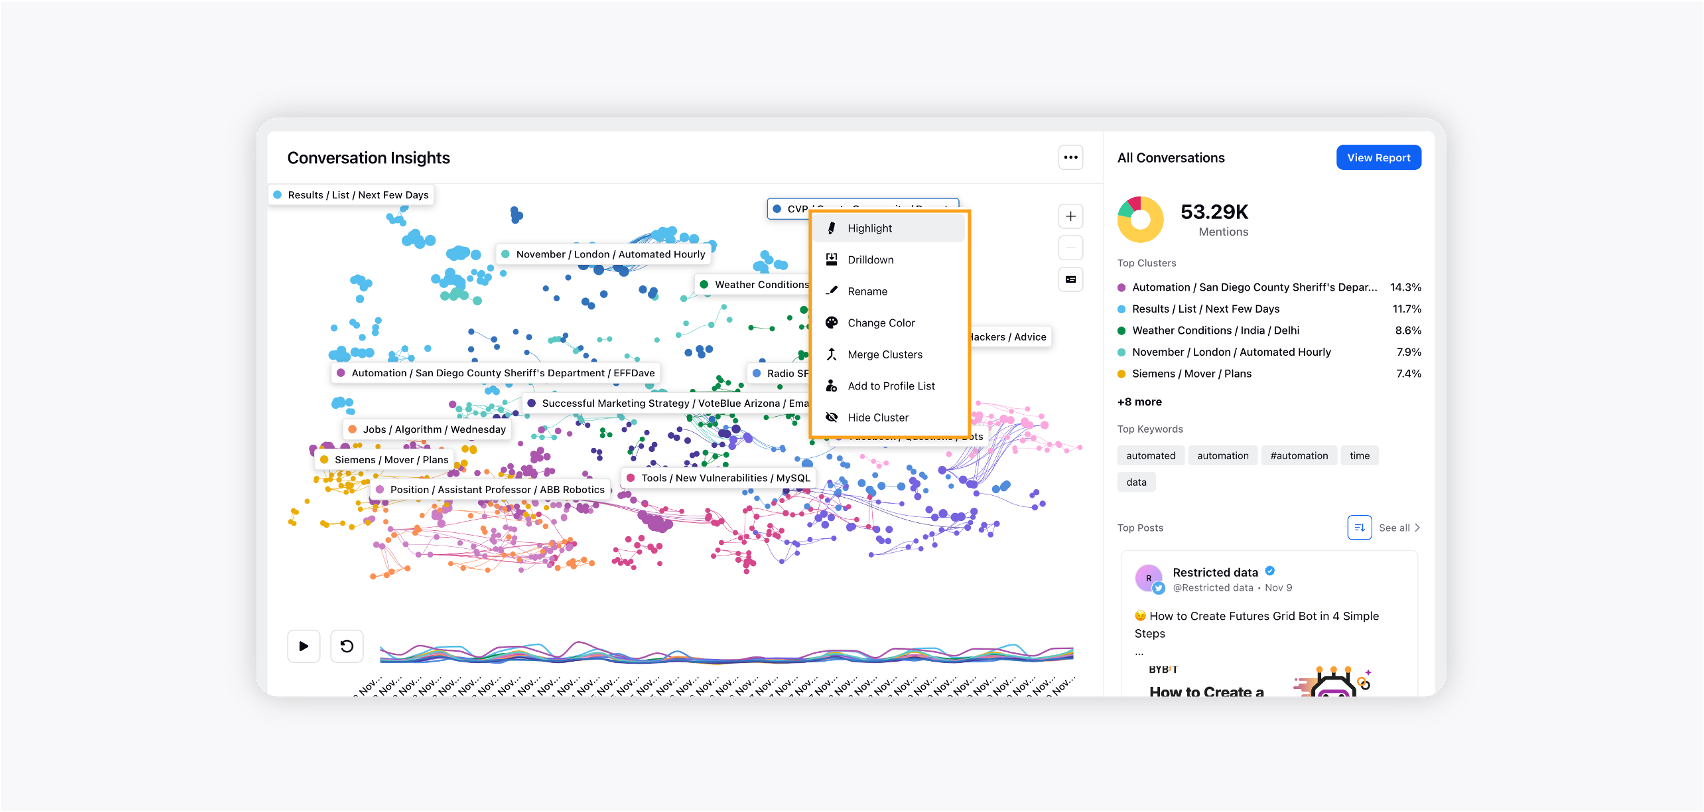
Highlight: This is similar to single-clicking on the cluster label.
Drilldown: This is similar to double-clicking on the cluster label.
Rename: Clicking this option will allow you to rename the cluster label.
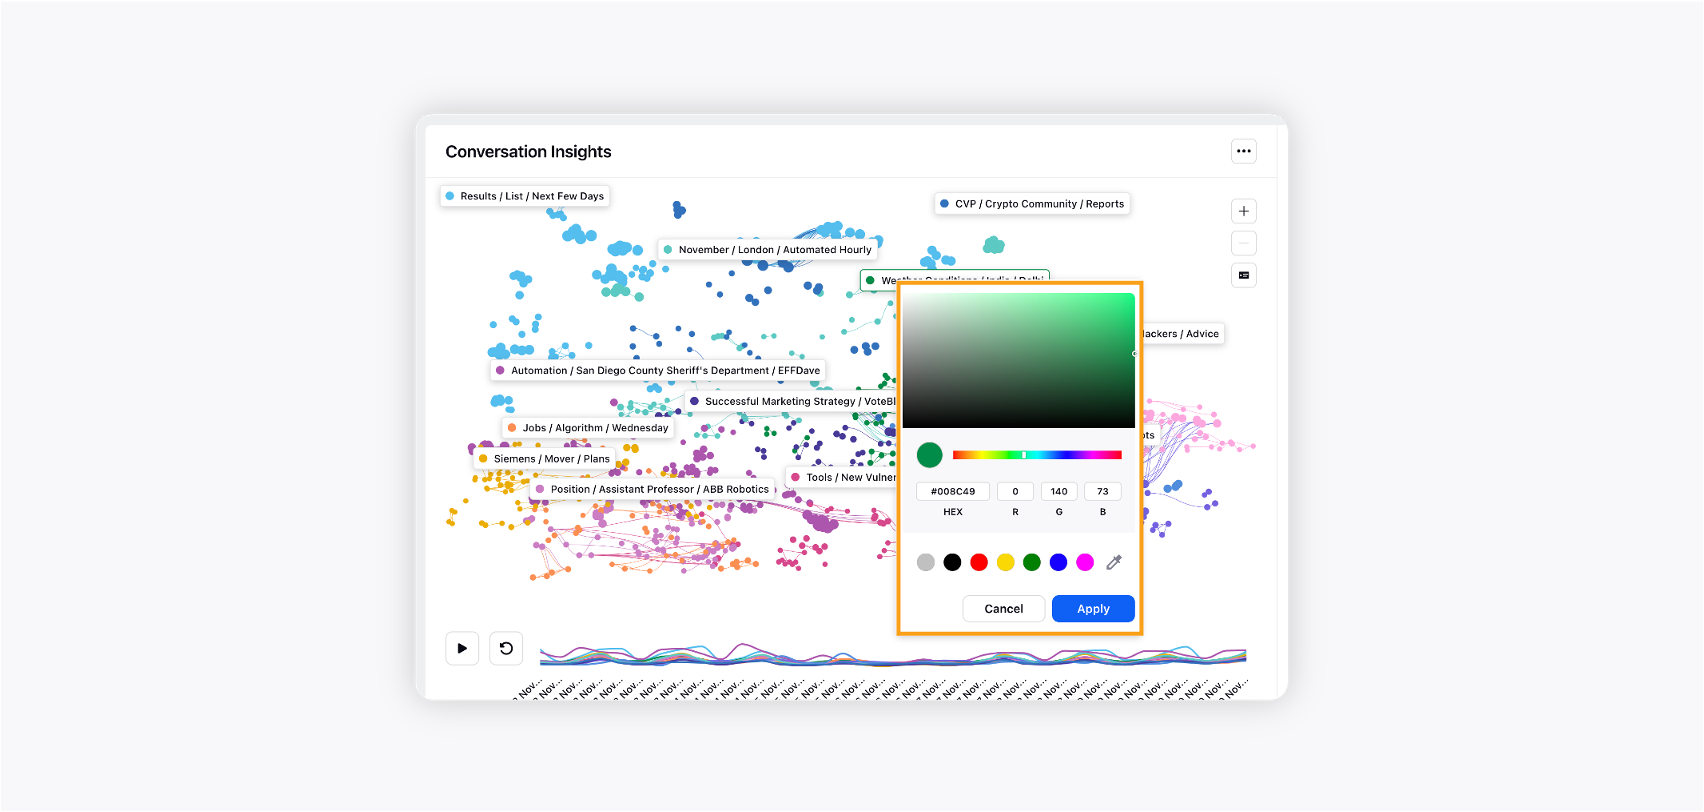
Change Color: Clicking this option will allow you to change the color of the cluster label.
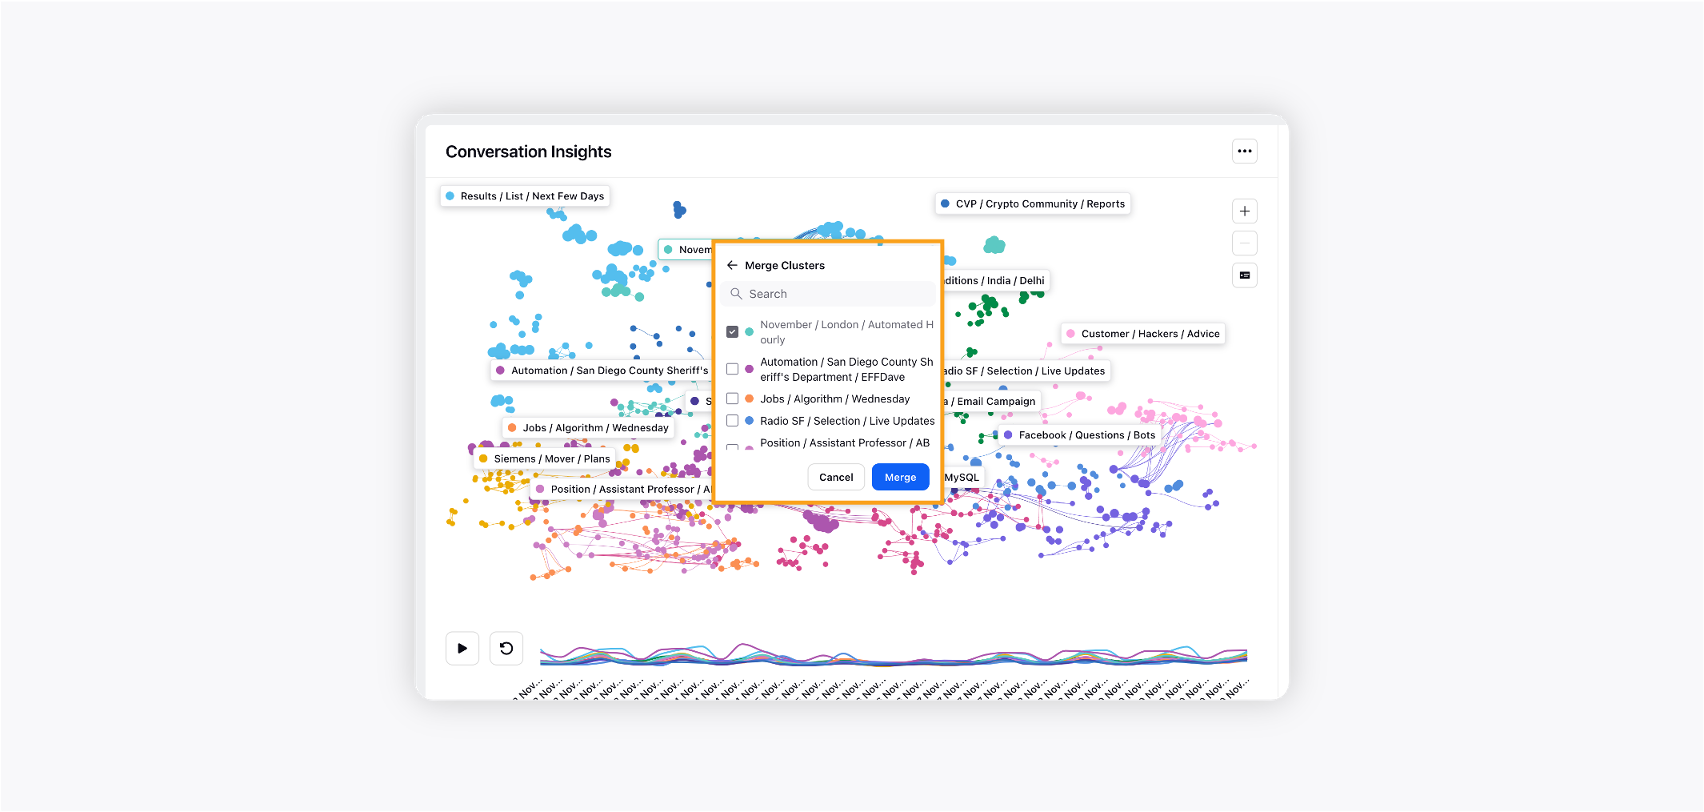
Merge Clusters: Clicking this option will allow you to merge two or multiple clusters into one. You can select the clusters that you want to merge and then click Merge.
Add to Profile List: Once the audience clusters are identified, you can add the cluster (L1 & L2) to a new or existing profile list. For detailed information, refer to the section – Add clusters to Profile List.
Hide/Unhide Cluster: You can hide clusters that seem irrelevant to your analysis for reporting purposes. Clicking the Hide Cluster option will hide the cluster from the cluster map widget, right-pane, and deep-dive dashboard. To view the list of hidden clusters, click the Unhide Clusters button placed below the Zoom icons. You can unhide any cluster by clicking the Unhide button against the hidden clusters' names. This is demonstrated by the GIF below:
Add clusters to Profile List
You can add clusters (L1 & L2) to a new or existing profile list –
Add to an existing Profile List
Select type of profile list: Global or Workspace level
Select existing profile list name
Create a new Profile List
Name the profile list
Set type of profile list – Global or Workspace level

Label toggle
You can toggle the size of the labels between three options depending on your preference:
No Labels
Short Labels
Long Labels (available by default)
The longer labels for sub-clusters contain longer form titles with additional context captured, which will be helpful in generating rich and granular insights around these clusters.
Time lapse
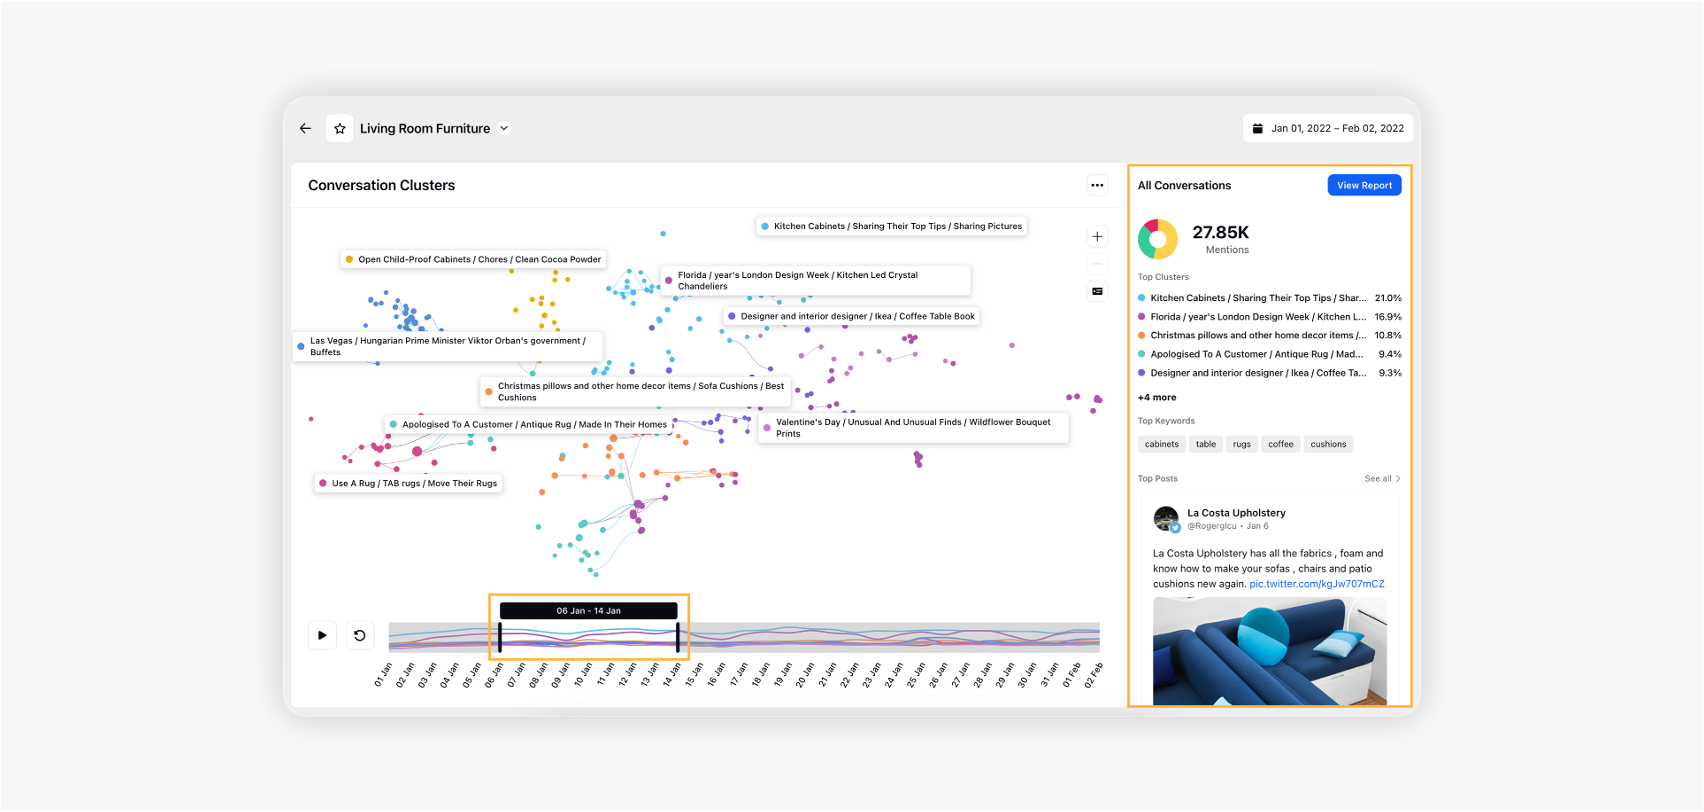
The time-lapse feature allows you to track the growth of individual clusters/sub-clusters and how the relationships between them change over time.
As you press Play, the time-lapse will start - with the time window beginning to move. As the window moves, you will see how the conversation clusters were at the instant of time & how they gradually changed over the full duration.
A volume chart of mentions for each cluster is also shown to identify when conversation pertaining to a particular cluster is peaked.
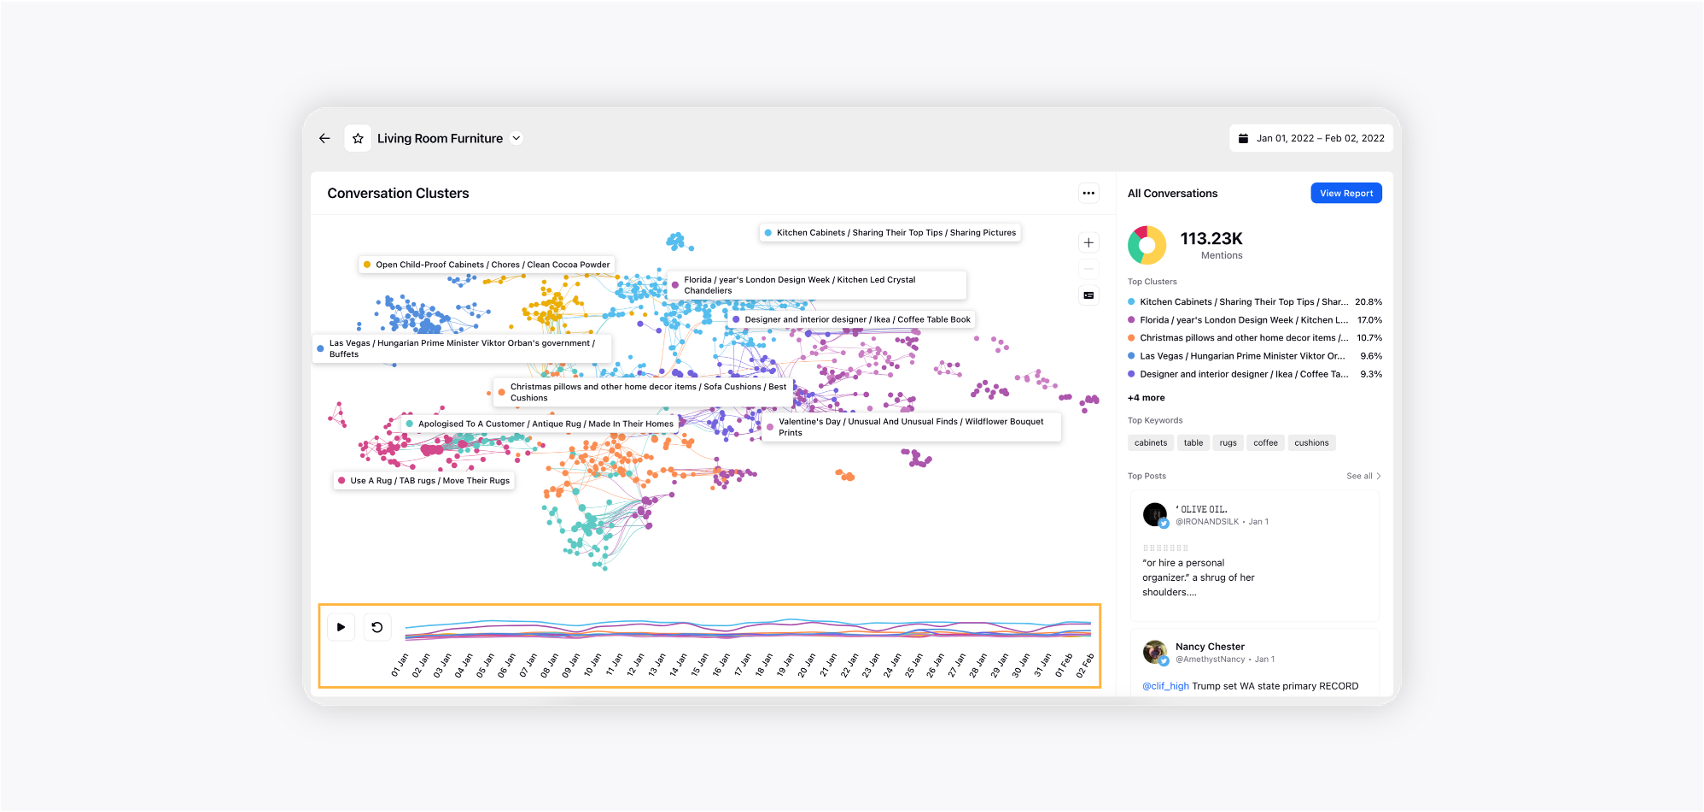
It consists of the following elements:
Play/Pause button: You can control the time-lapse using the play/pause button to start or pause it.
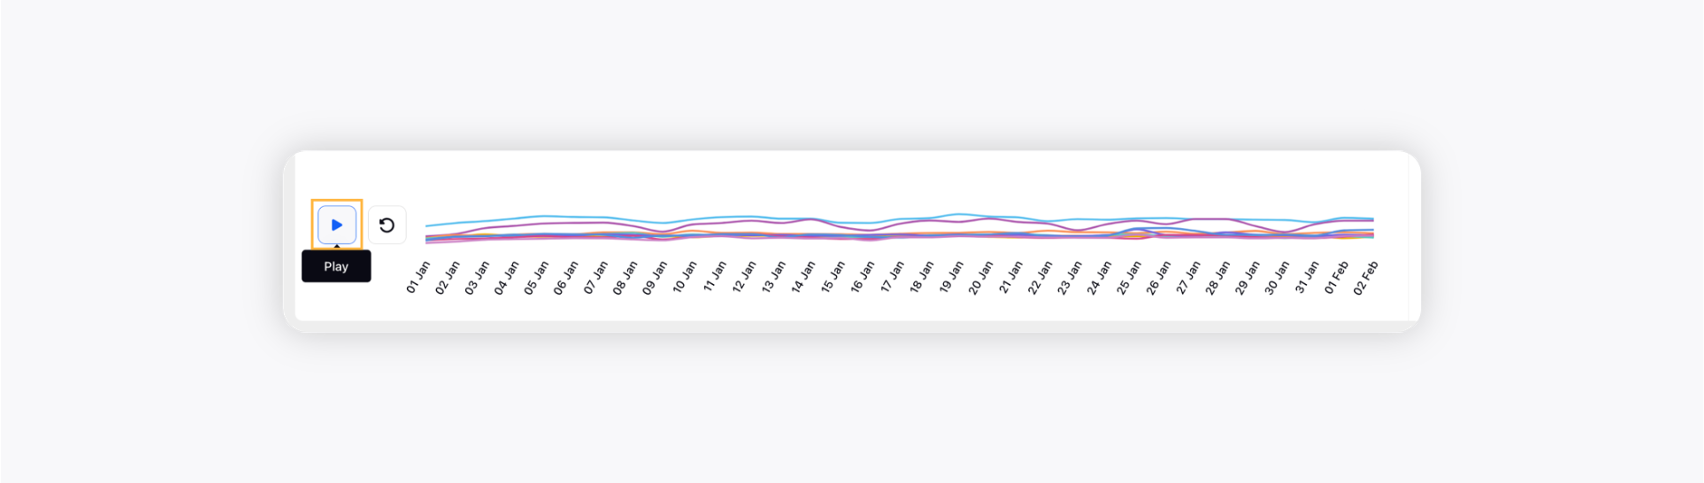
Time Selector window: The time selector window is an interactable window that can be moved, played, or paused on the time range. The size of this window is pre-set according to the total time duration of the report.
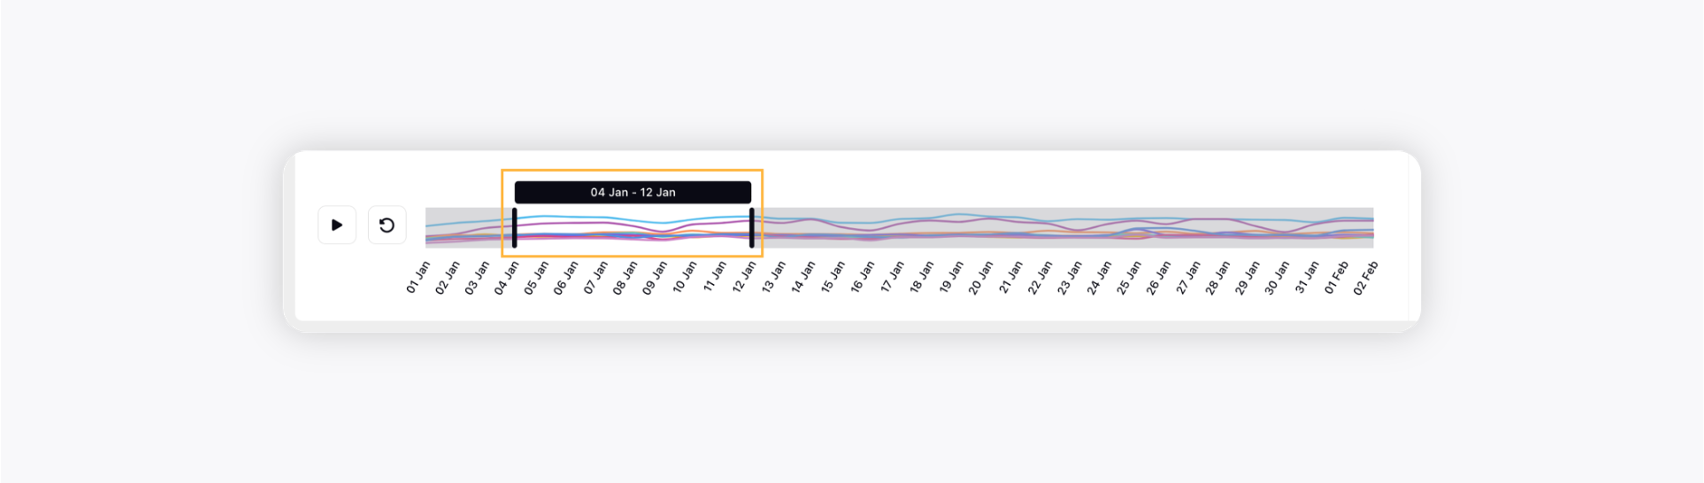
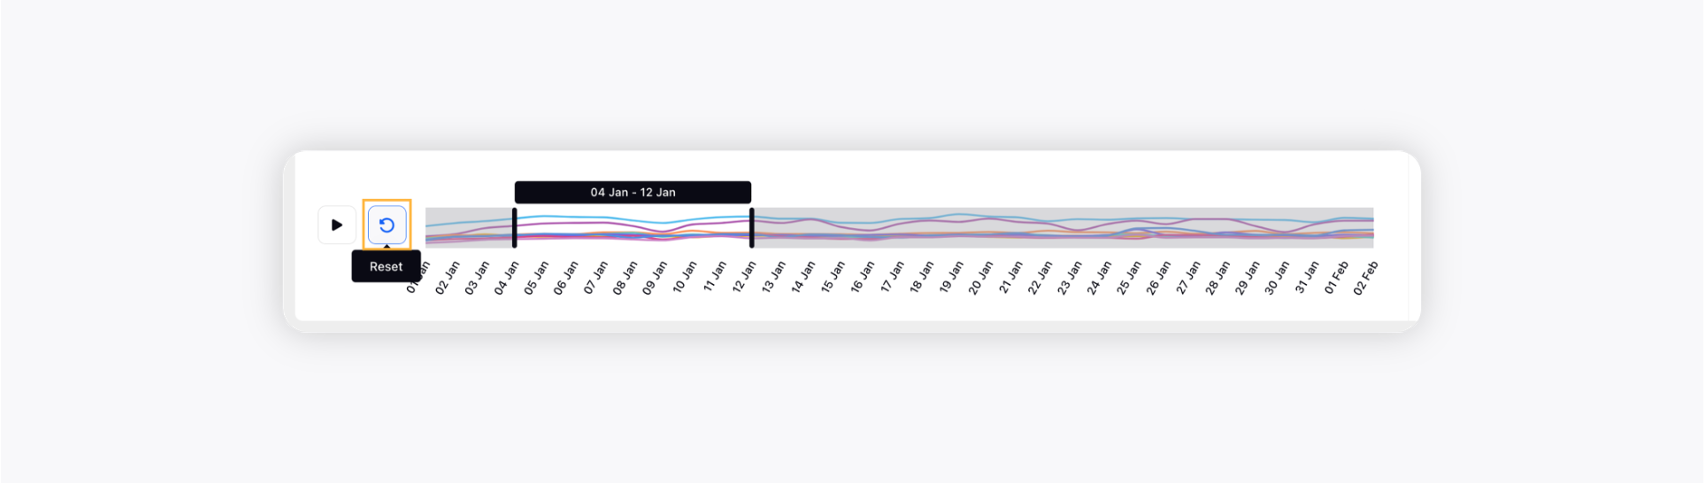
Reset button: Reset button will reset the window to the default state - start of the total time duration.
Volume Charts: Volume charts over time for each cluster shown in the graph are also displayed.
Apart from playing the time-lapse over the entire duration of the report, you can also:
Pause the time lapse at any particular time-interval
Select or Drag the time selector window at any particular time interval
In both these cases, the right pane will update with information specific to the time interval.
Note:
|
Widget-level options
There are three options available at the widget level: Add to Custom Dashboard, Translate, Export and Get External Link.
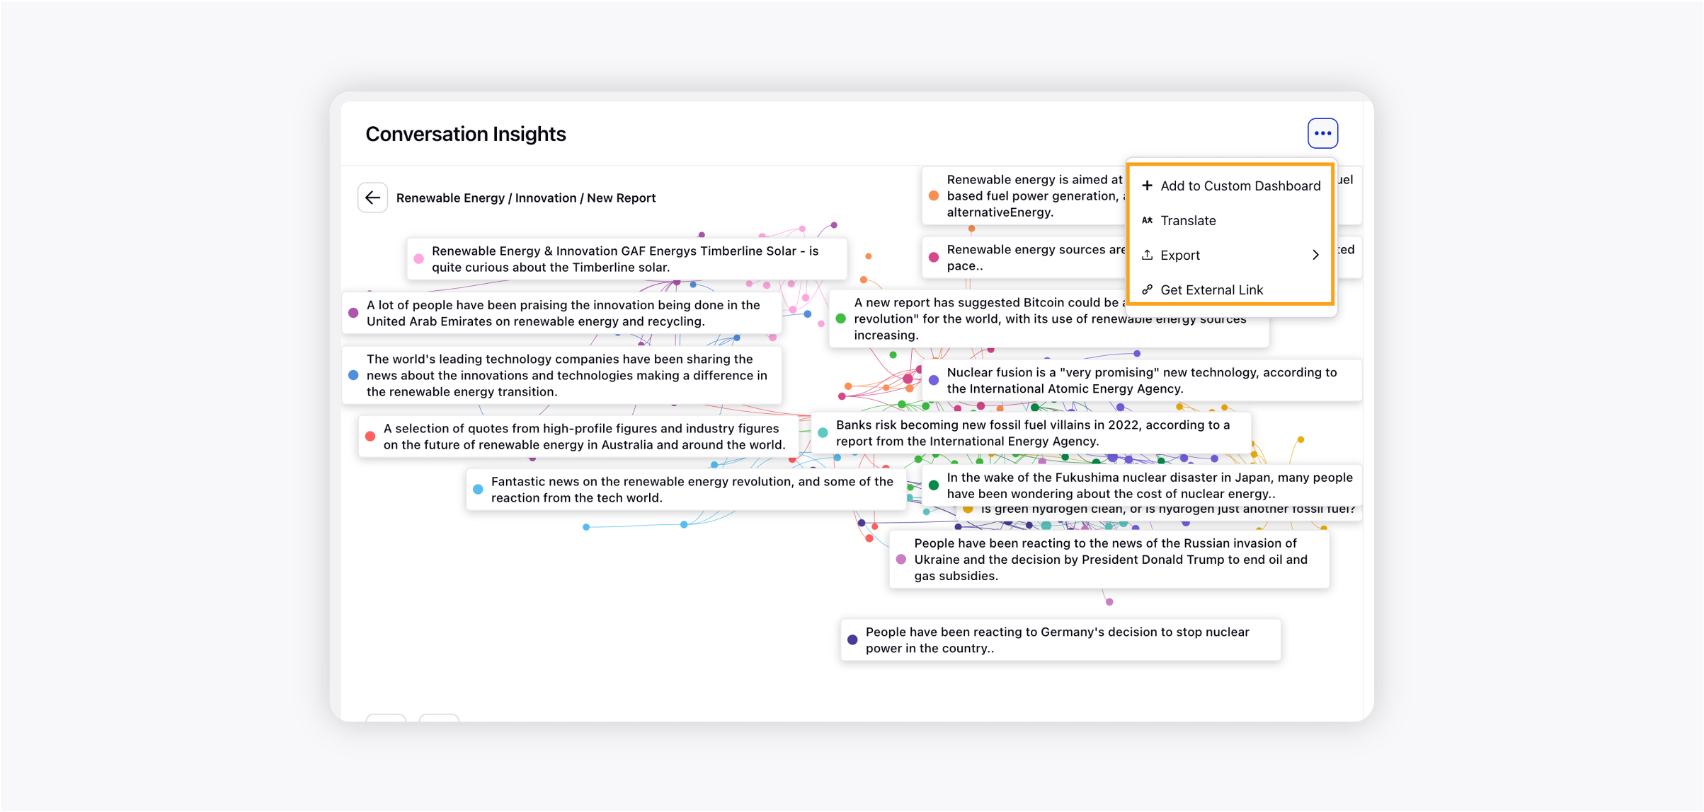
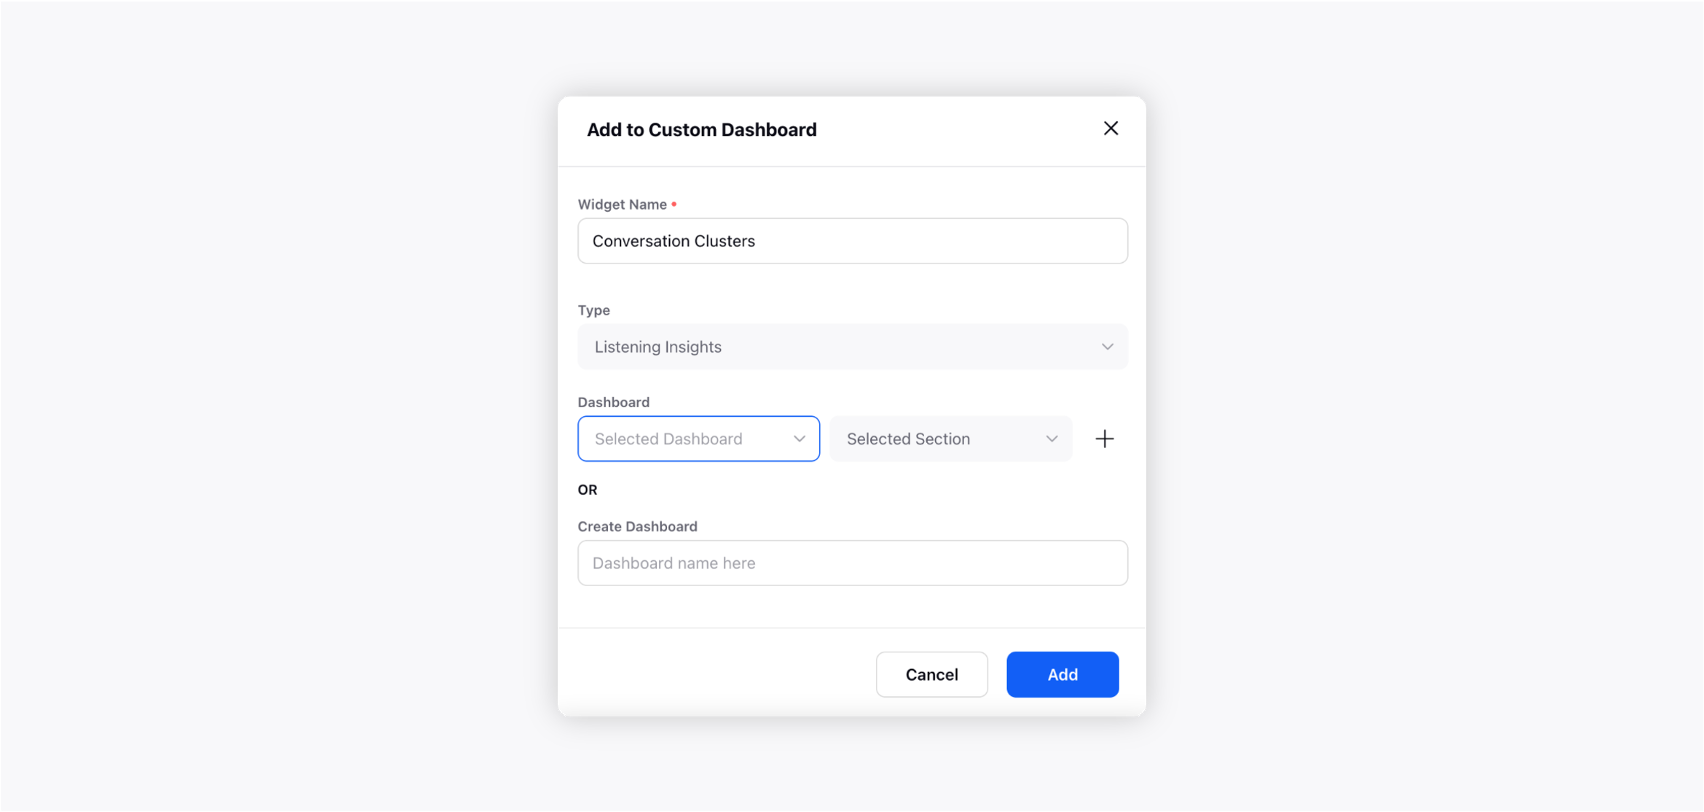
Add to Custom Dashboard: You can add the Conversation Insights report to any custom Listening dashboard as a separate widget. To do that, simply click the Add to Custom Dashboard option. This will open the Add to Custom Dashboard popup window where you can select the custom Listening dashboard to which you want to add the widget. Or, you can also create a new custom Listening dashboard directly from here and add this widget to that dashboard. Get familiar with the scope and limitations to add the Conversation Insights report to any custom Listening dashboard.
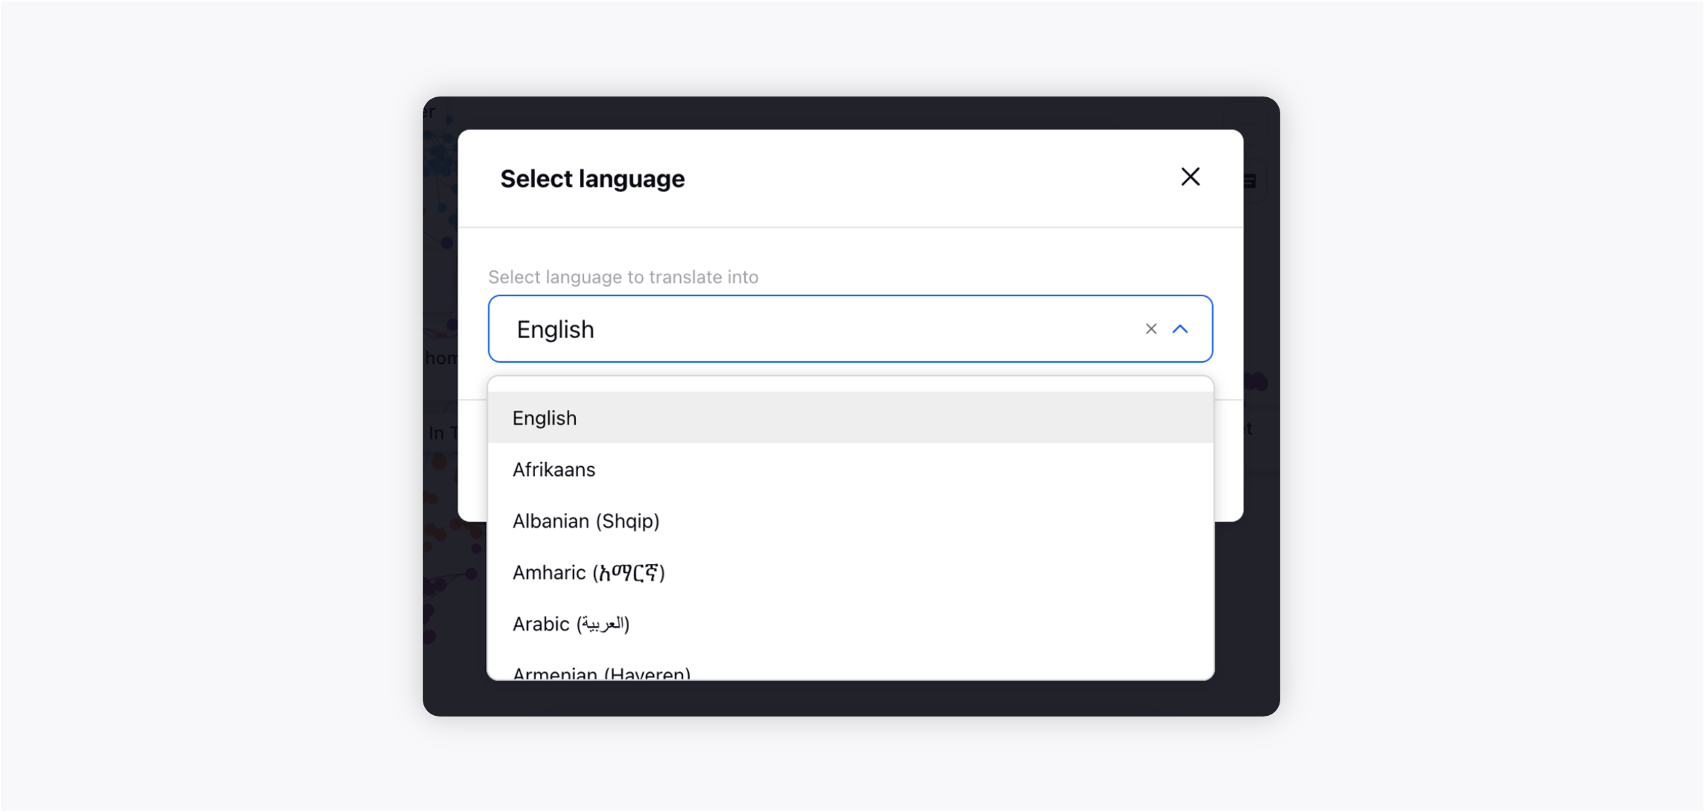
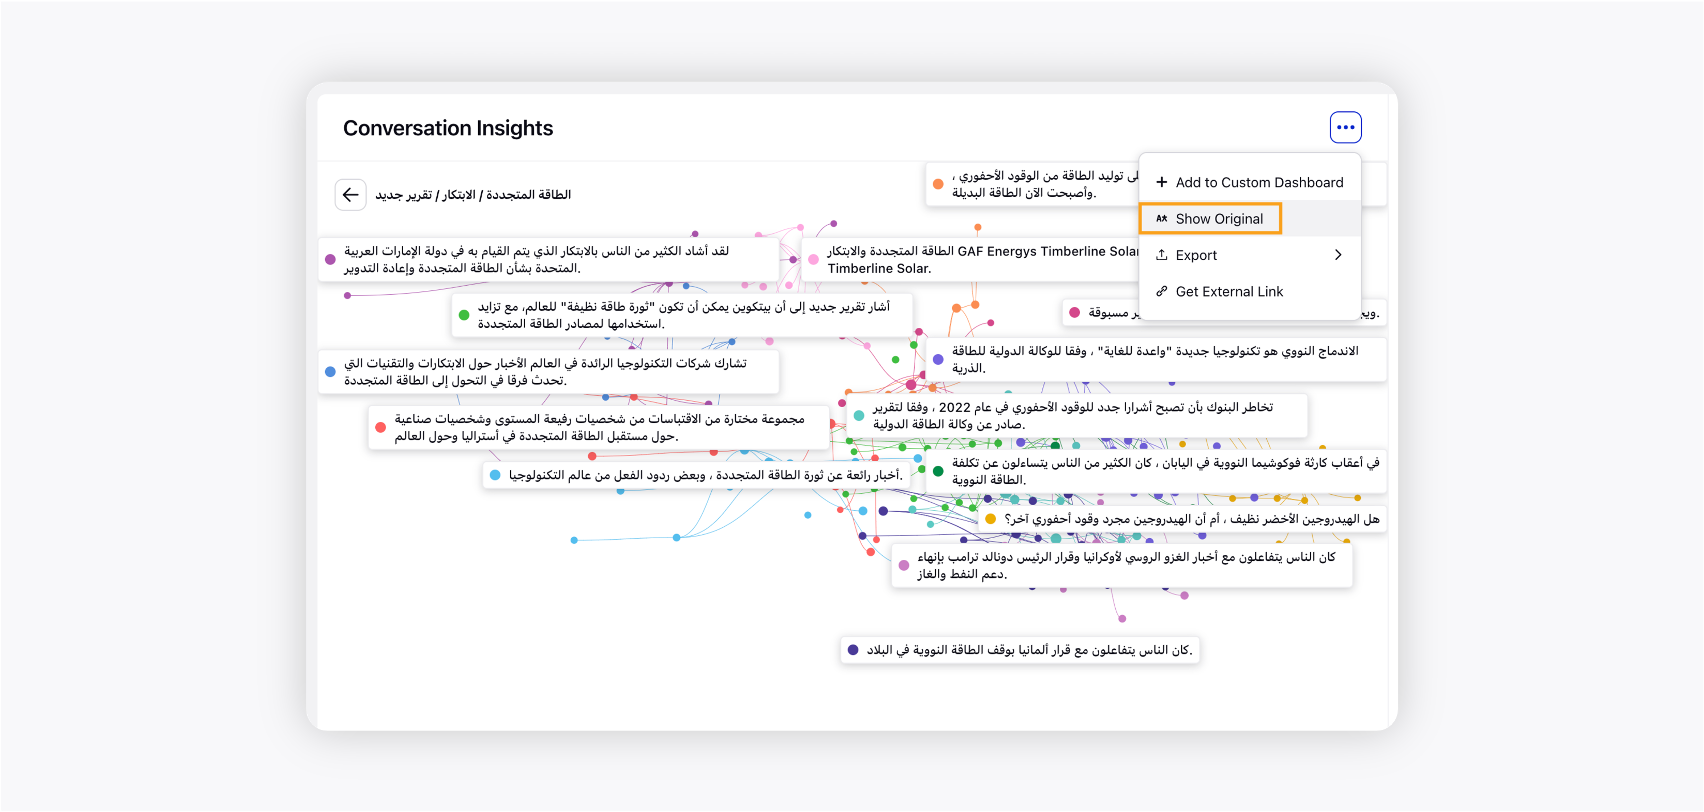
Translate: Other than adding the Conversation Insights reports to a custom Listening dashboard as a separate widget, you also have an option to translate the report. To do that, simply click the Translate option and select the language into which you want to translate the Conversation Insights report.
You can switch back to your original language by clicking
Show Original
in the options available at the widget level.
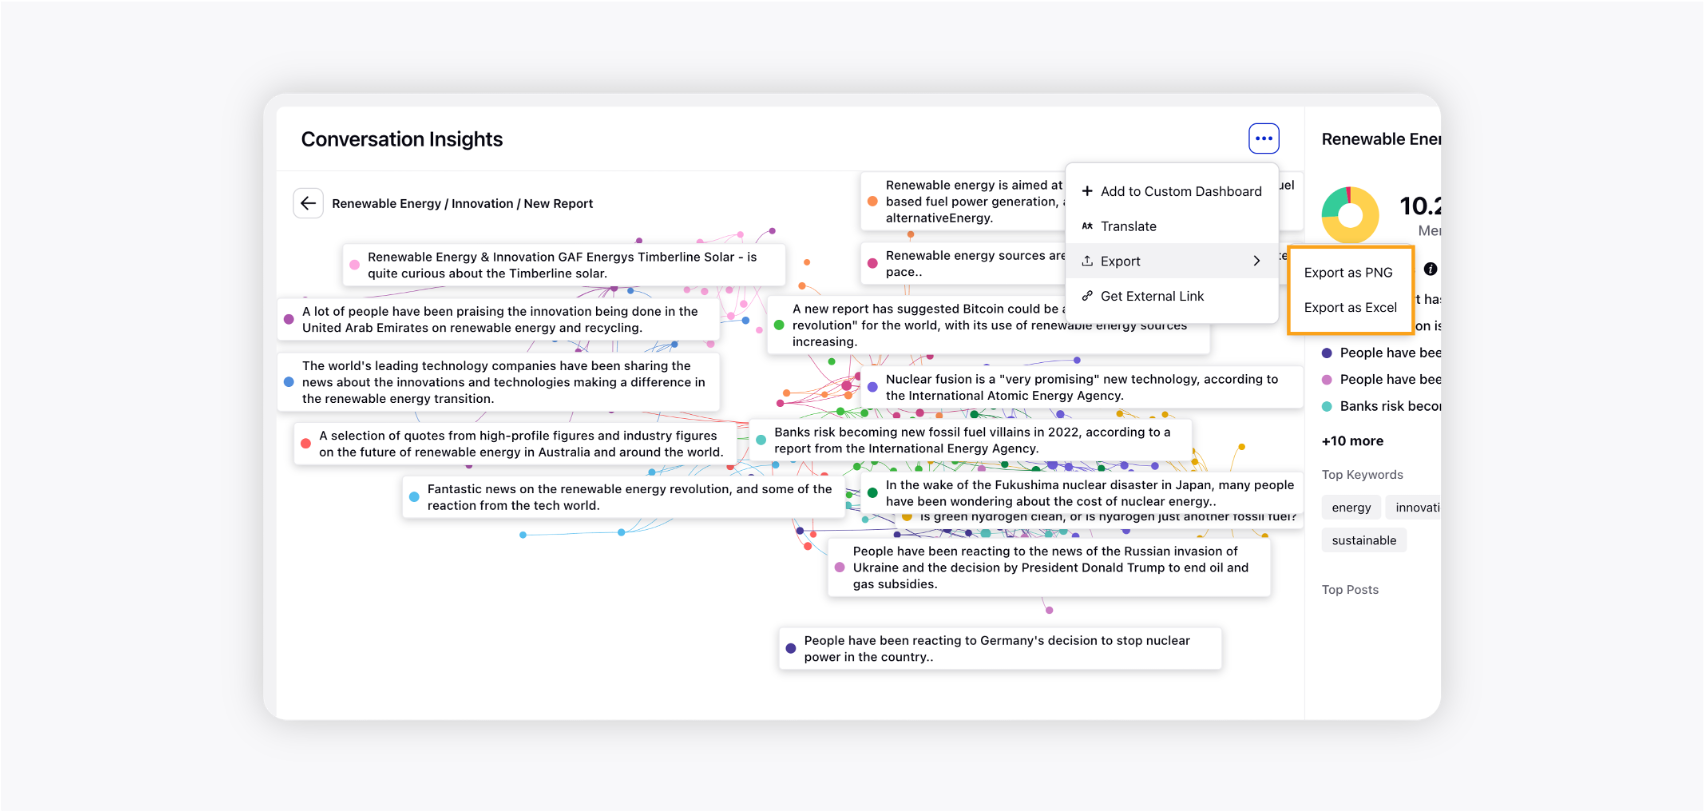
Export: You can also export the Conversation Insights widget as a PNG and/or Excel file so that you can use it in your presentation and also you can send it as an email attachment to your colleagues.
Create External Shareable Link
The Get External Link option available at the widget-level options allows you to create an external shareable link for your Conversation Insights report and share that with external users who do not have access to Sprinklr platform.
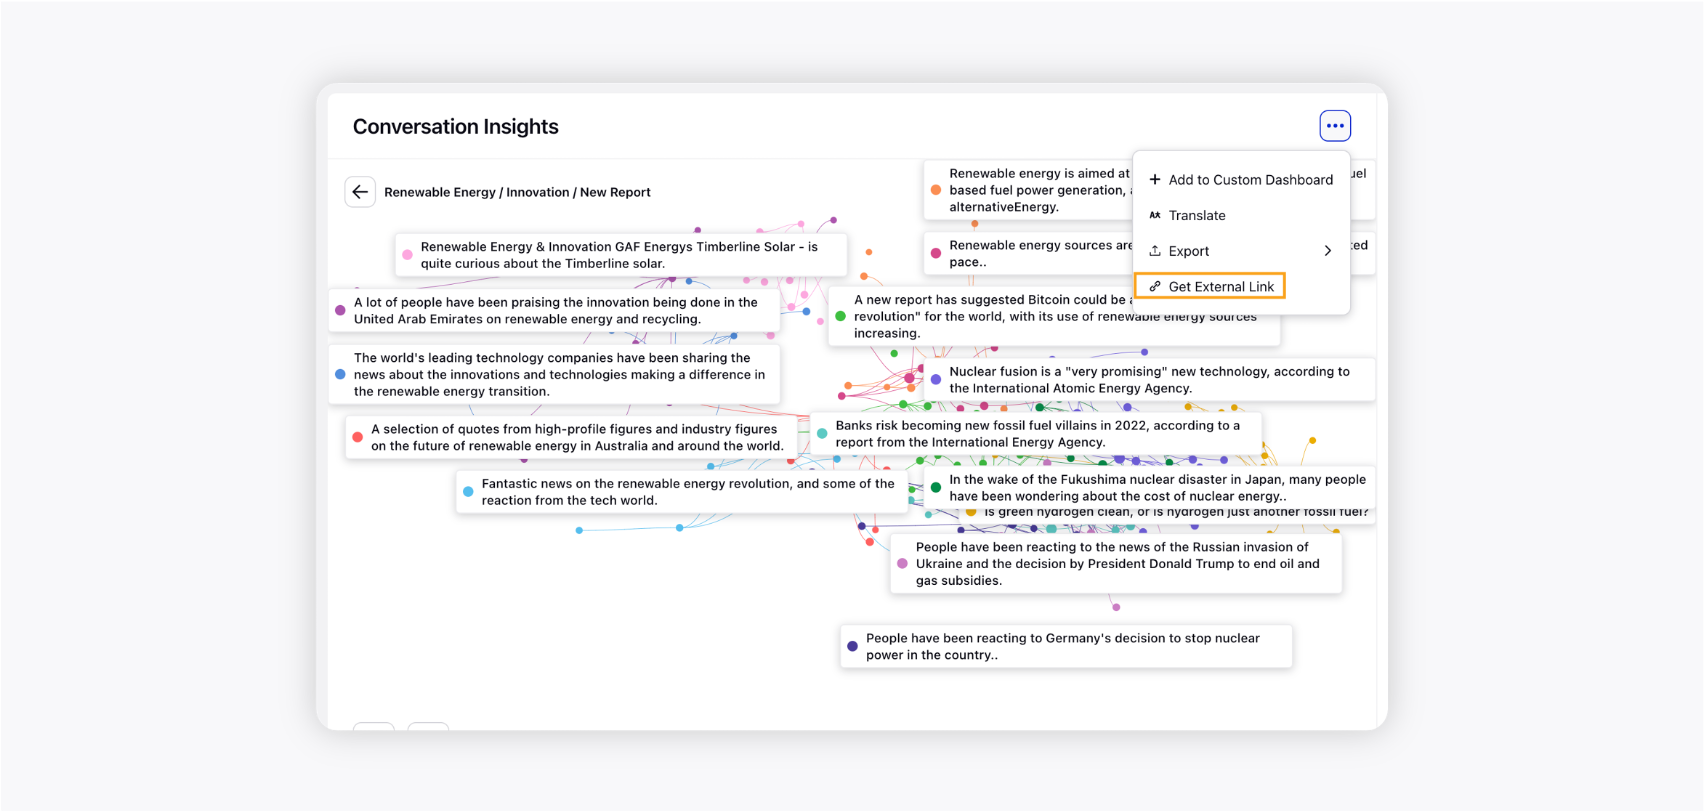
Clicking Get External Link will open the External Sharing popup window. Here you need to define a date range and the expiry date until which you want to keep the external shareable link valid. Besides, you can protect your external link by applying password protection. Once done, click Generate URL.
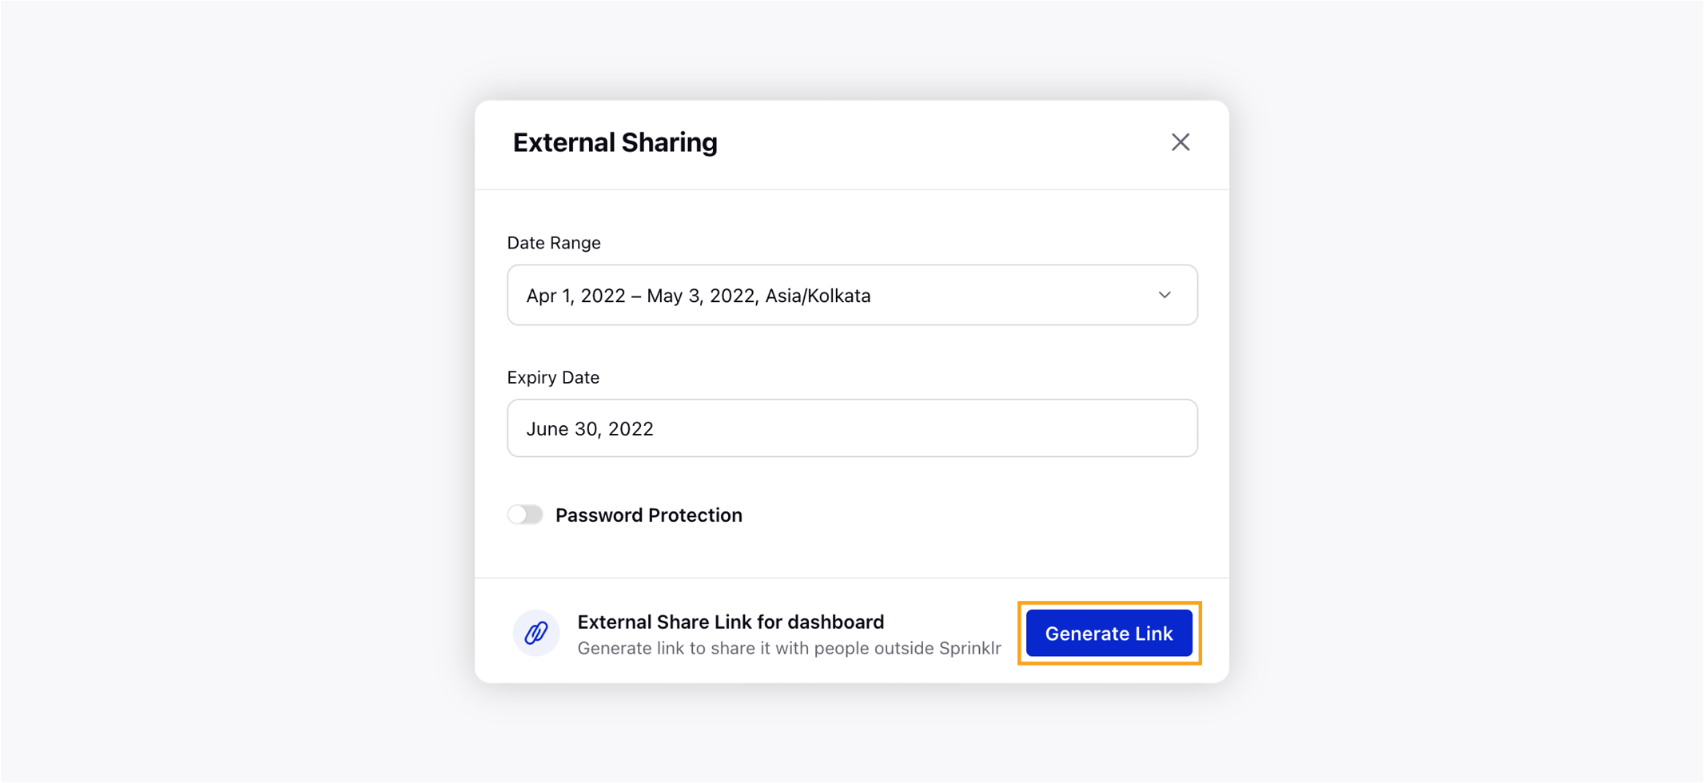
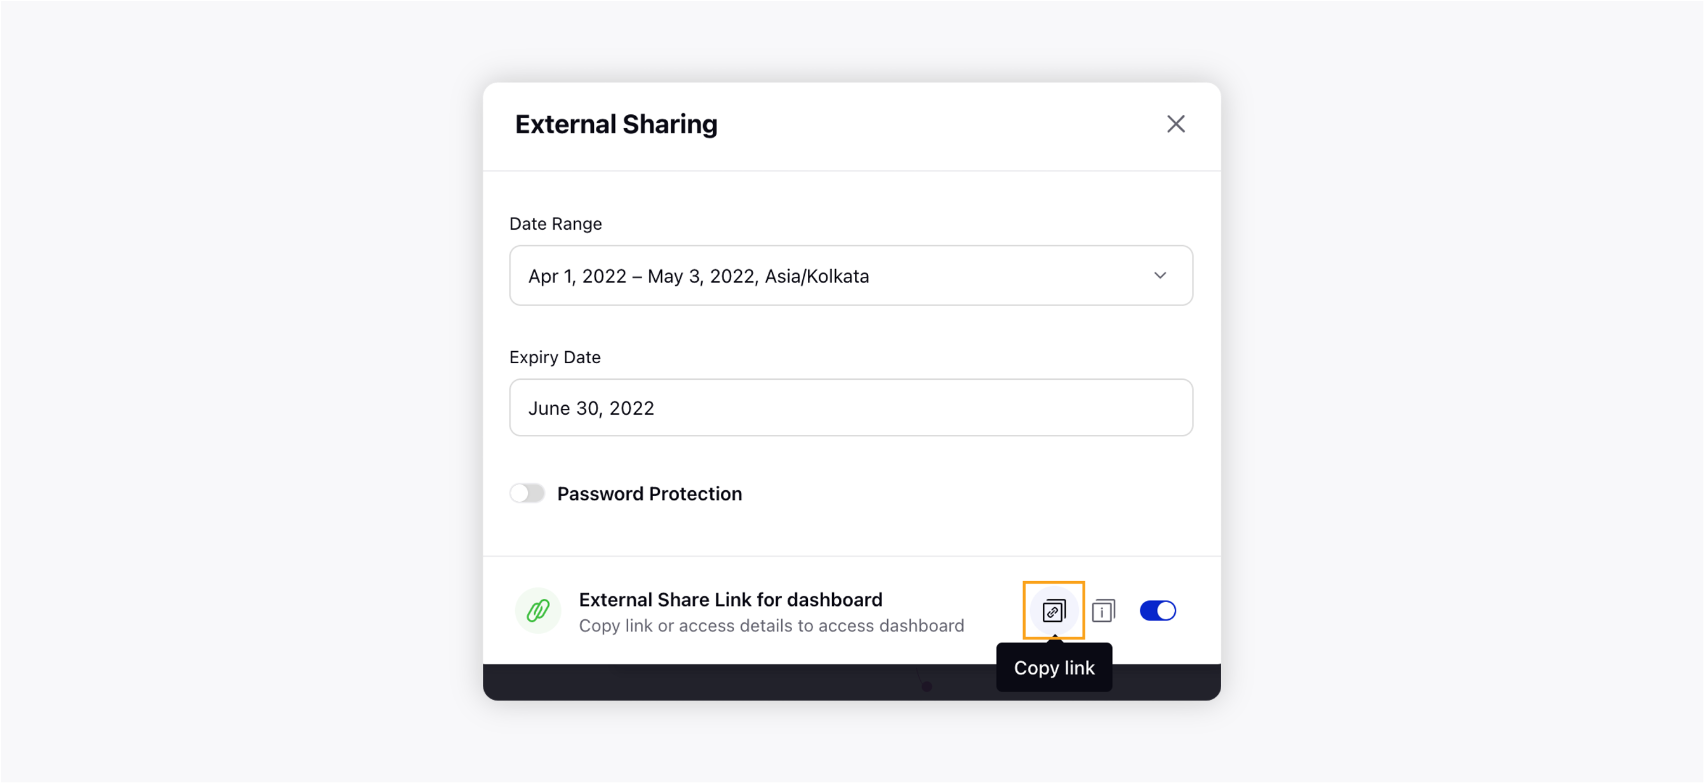
Upon clicking the Generate Link button, the external shareble link will be generated that can be copied by clicking the Copy icon. You can then share this URL with any external users so that they can view the Conversation Insights report without logging into Sprinklr.
View report of clusters
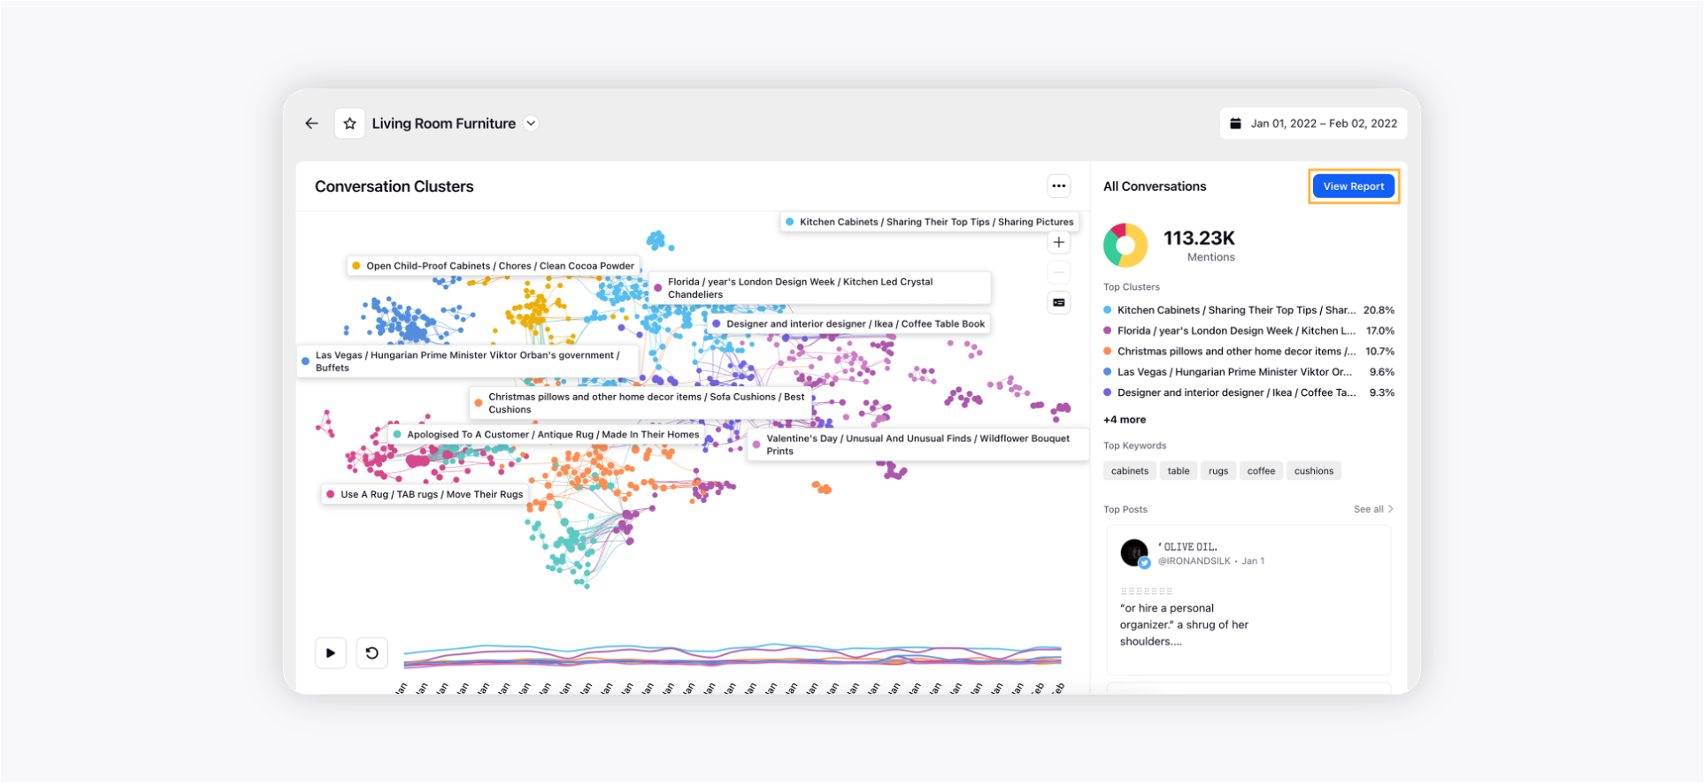
You can also launch a deep-dive dashboard for any cluster from the right pane to get deeper insights into the conversation as well as the audience behind each cluster. You can launch the deep-dive dashboard for the overall conversation as well.
To launch the standard cluster deep-dive dashboard, click the View Report button in the top right corner.
This will open the deep-dive dashboard where you can switch between clusters using the Dashboard Switcher (placed next to the title of the dashboard as shown in the screenshot).
Note: Cluster Deep-dive Dashboard is only available for first-level clusters & overall conversation. |
The dashboard has 2 tabs: Overview and Cluster Comparisons along with drill-down capability.
Overview
The Overview tab within the dashboard contains top-level metrics for each cluster: Mentions, Engagements, and Unique Users. Other widgets of the tab include:
Trend Over Time: The trend of overall mentions & unique users throughout the time range of the report.
Sentiment Distribution: Distribution of positive, negative, and neutral mentions within each cluster or overall conversation.
Sentiment Trend: The trend of positive, negative, and neutral mentions over time within each cluster or overall conversation.
Top Emotions: Distribution of AI-identified emotions within each cluster or overall conversation.
Top Countries: Distribution of countries within each cluster or overall conversation.
Top Brands: Top brands mentioned in the messages for each cluster or overall conversation. This is detected using an in-house AI model.
Top Hashtags: Top hashtags mentioned in the messages for each cluster or overall conversation.
Top Keywords: Top keywords mentioned in the messages for each cluster or overall conversation.
Top Posts: Conversation stream of messages sorted by engagement for each cluster or overall conversation.
Cluster Comparisons
The Cluster Comparisons tab will give insights and help you compare sub-clusters within the cluster that has been drilled down. The widgets included in this tab are:
Volume Distribution by Clusters: Share of voice by mentions across sub-clusters.
Mentions Trend by Clusters: The trend of mentions across time for all sub-clusters.
Sentiment Distribution: Distribution of positive, negative, and neutral mentions over time for each sub-cluster.
Top Emotions by Cluster: Distribution of emotions for each sub-cluster. This is detected using an in-house AI model.
Country Distribution: Distribution of countries within each sub-cluster.
Top Brands by Cluster: Top brands mentioned in the messages for each sub-cluster.
Gender Distribution by Cluster: Gender distribution of profiles associated with the messages for each sub-cluster.
Age distribution by Cluster: Age distribution of profiles associated with the messages for each sub-cluster.
Ability to drill down
You can drill down on any data point in the dashboard by clicking on it. Doing this will open the third pane that contains the following widgets – Distribution by gender, Distribution by age, Distribution by country, Distribution by interests (AI-generated), Top influencers, and Top posts.
Note: Currently, the Top Influencers widget only supports profiles from Twitter. |
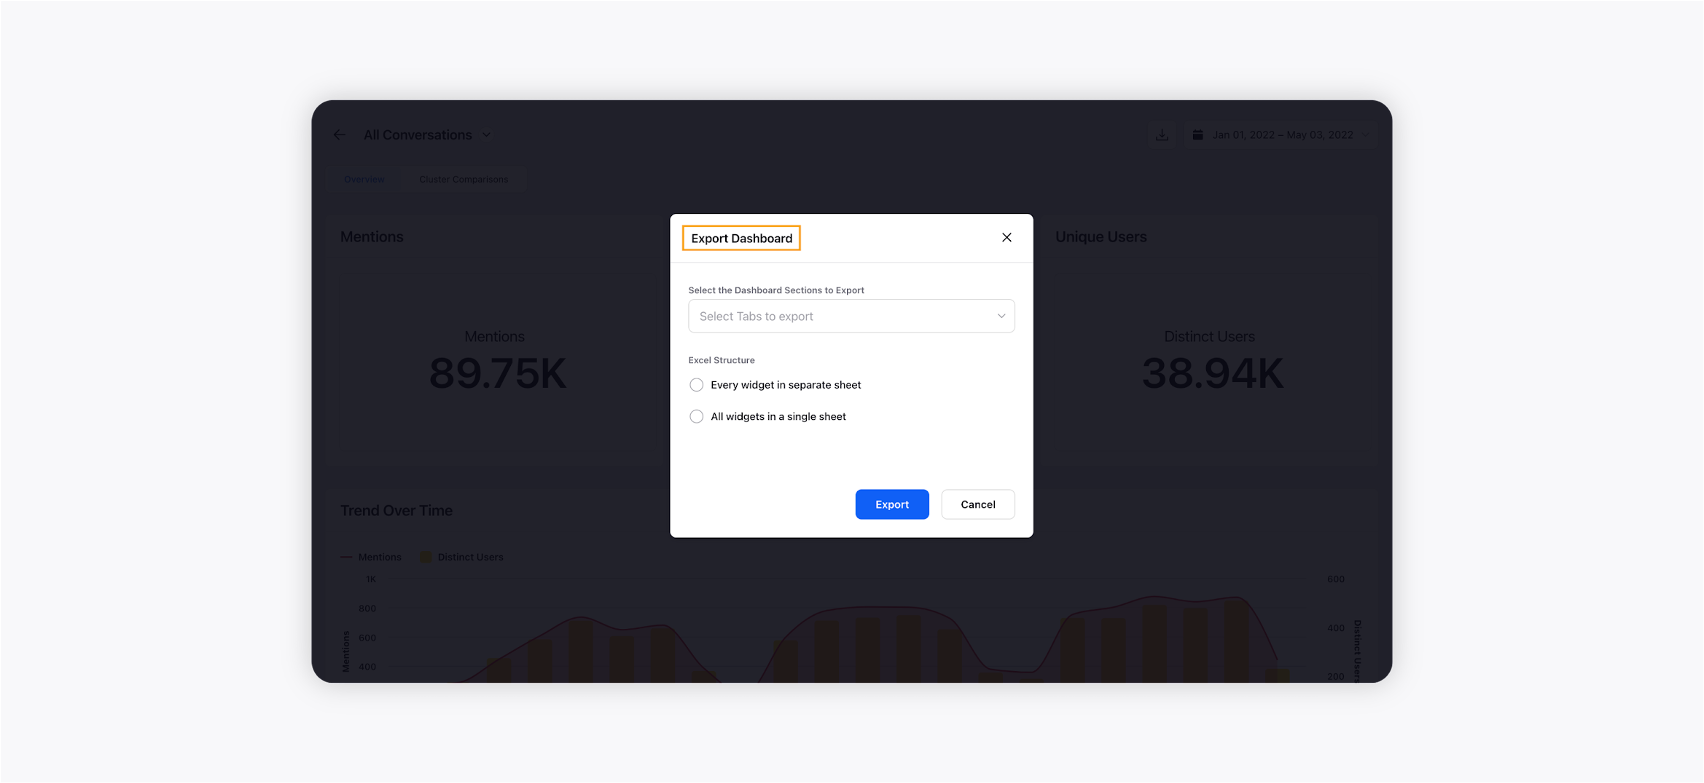
Ability to export Conversation Insights report at dashboard-level
Besides widget-level, you can also create an export of the Conversation Insights dashboard by simply clicking the Export icon, and then selecting the dashboard section(s) to export and the Excel structure.
View report of subclusters
When you double-click a cluster on the widget, it will show you the subclusters. The Conversation Cluster graph shows a maximum of 15 statistically significant clusters upfront. The complete list of subclusters can be viewed separately within the All Subclusters tab of the deep-dive dashboard.
To view the complete list of subclusters of a cluster, simply double-click the cluster and then click the View Report button in the top right corner. This will open the deep-dive dashboard. Click the All Subclusters tab where you can view the complete list of subclusters. This is demonstrated by the GIF below:
Note: Users can drill down on a data point to open the third pane to view demographic insights and conversation streams, similar to other widgets in the deep-dive dashboard. |
Scope & limitations while adding to custom dashboard
The widget will only be available in "View Only" mode, i.e only the following actions are supported in the custom Listening Dashboard widget:
View Report (only available for users who have share permissions to the corresponding Conversation Insights reports)
Single Click on Labels
Double Click on Labels
Third pane drill-downs
Play Timelapse
Zoom
No dashboard or section filters will be applied to this widget. This will be an identical copy of the output of the report generated. The widget will be static in the Listening Dashboard, no filtering or dynamic change is supported.
In order to make any changes to the widget – like renaming/hiding clusters, changing label positions, etc. you will need to make them within the report in the Conversation Insights module (by a user who has Edit permissions for the particular report). Any changes made will automatically sync at all places where the report has been added (in one or multiple custom Listening Dashboards).
We currently support exports in PDF, PNG, Excel, and CSV formats. When you export the Listening dashboard, the Conversation Insights widget will be included in the export.
We currently support External Link Sharing for widgets added to any custom Listening Dashboard. You can create an external link to the Listening Dashboard and the Conversation Insights widget will be included. Directly creating an External Link to the report from the module will be supported in later versions.