Use AI Studio as a data dource in Listening dashboards
Updated
This article describes how to plot the AI Studio dimensions to a Listening dashboard to get instant insights into your AI Project’s related data.
Sprinklr’s AI Studio allows you to test the AI models to your satisfaction and provide feedback to customize the models as per your requirements. Besides being a stand-alone product, AI Studio can also be used as a data source in a Listening dashboard. In this way, you can easily plot the AI Studio dimensions to a Listening dashboard to get instant insights into your AI Project’s related data.
After you successfully create a Listening dashboard, follow these steps to use AI Studio as a data source while creating widgets.
To add AI Studio as a data source in a widget
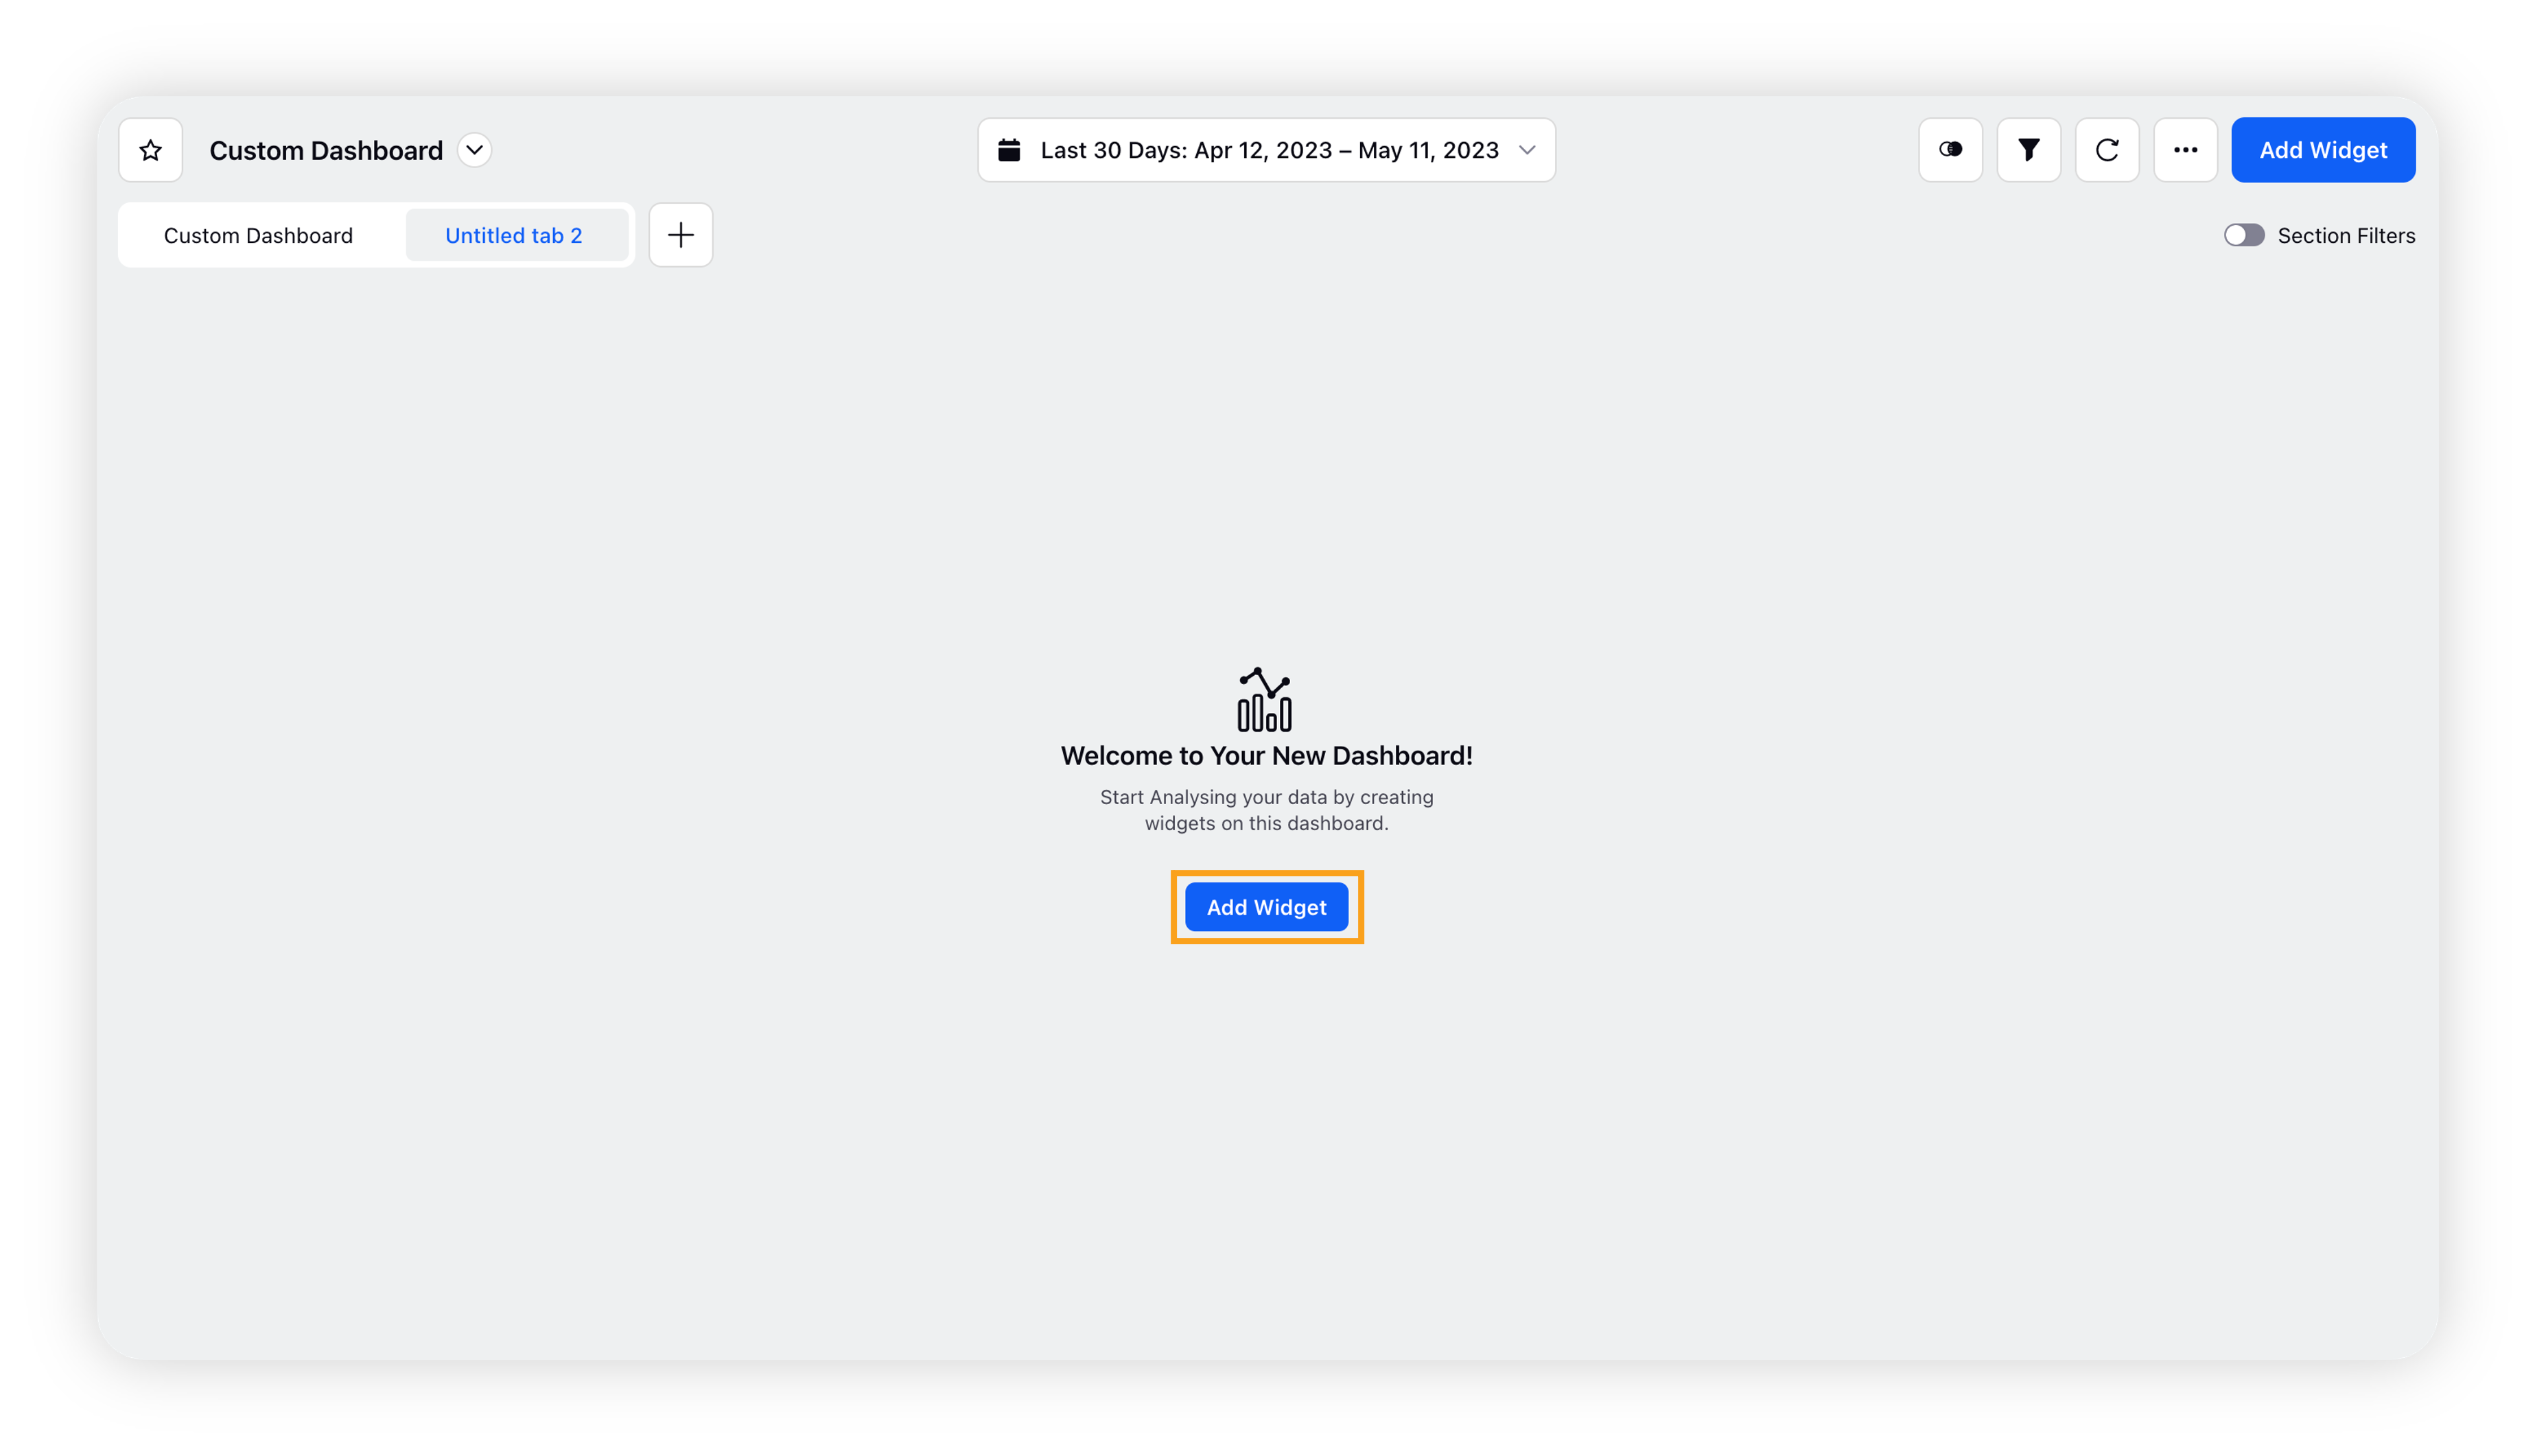
On a Listening dashboard, click the Add Widget button in the top right corner. If the dashboard has no widget, the Add Widget option will also appear in the center of the window.

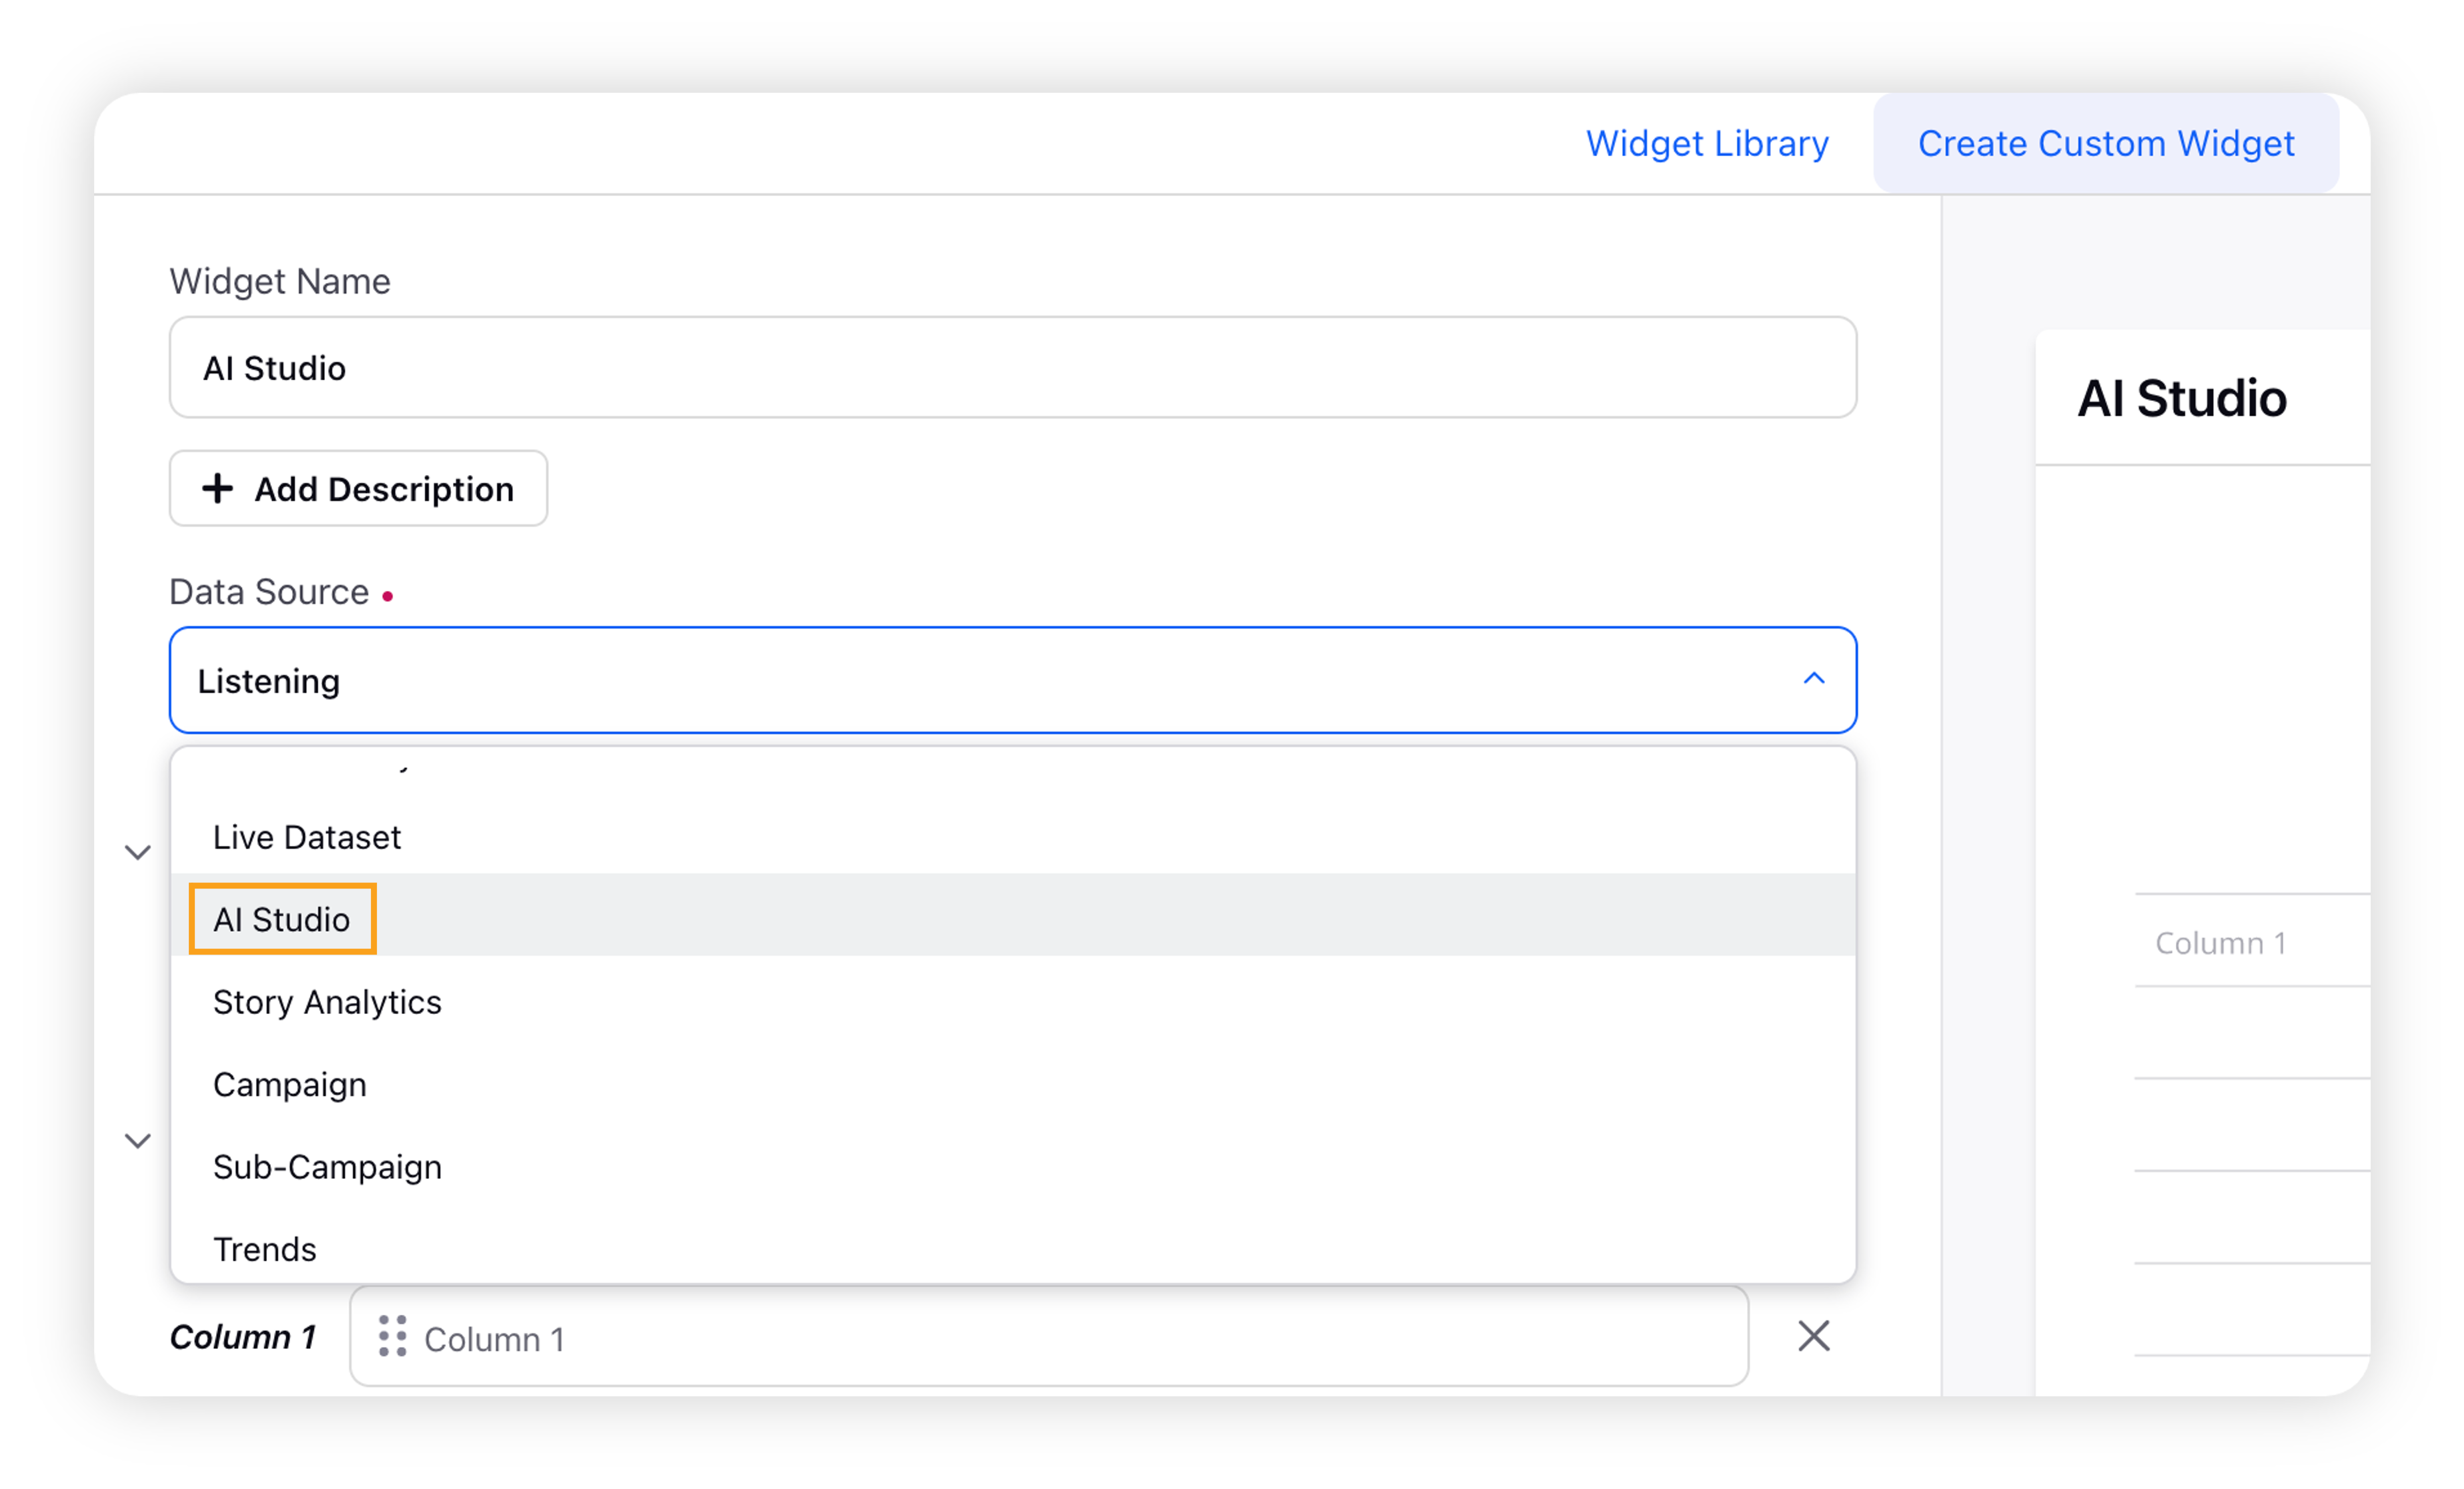
On the Widget builder, enter the widget name and select AI Studio as a data source.

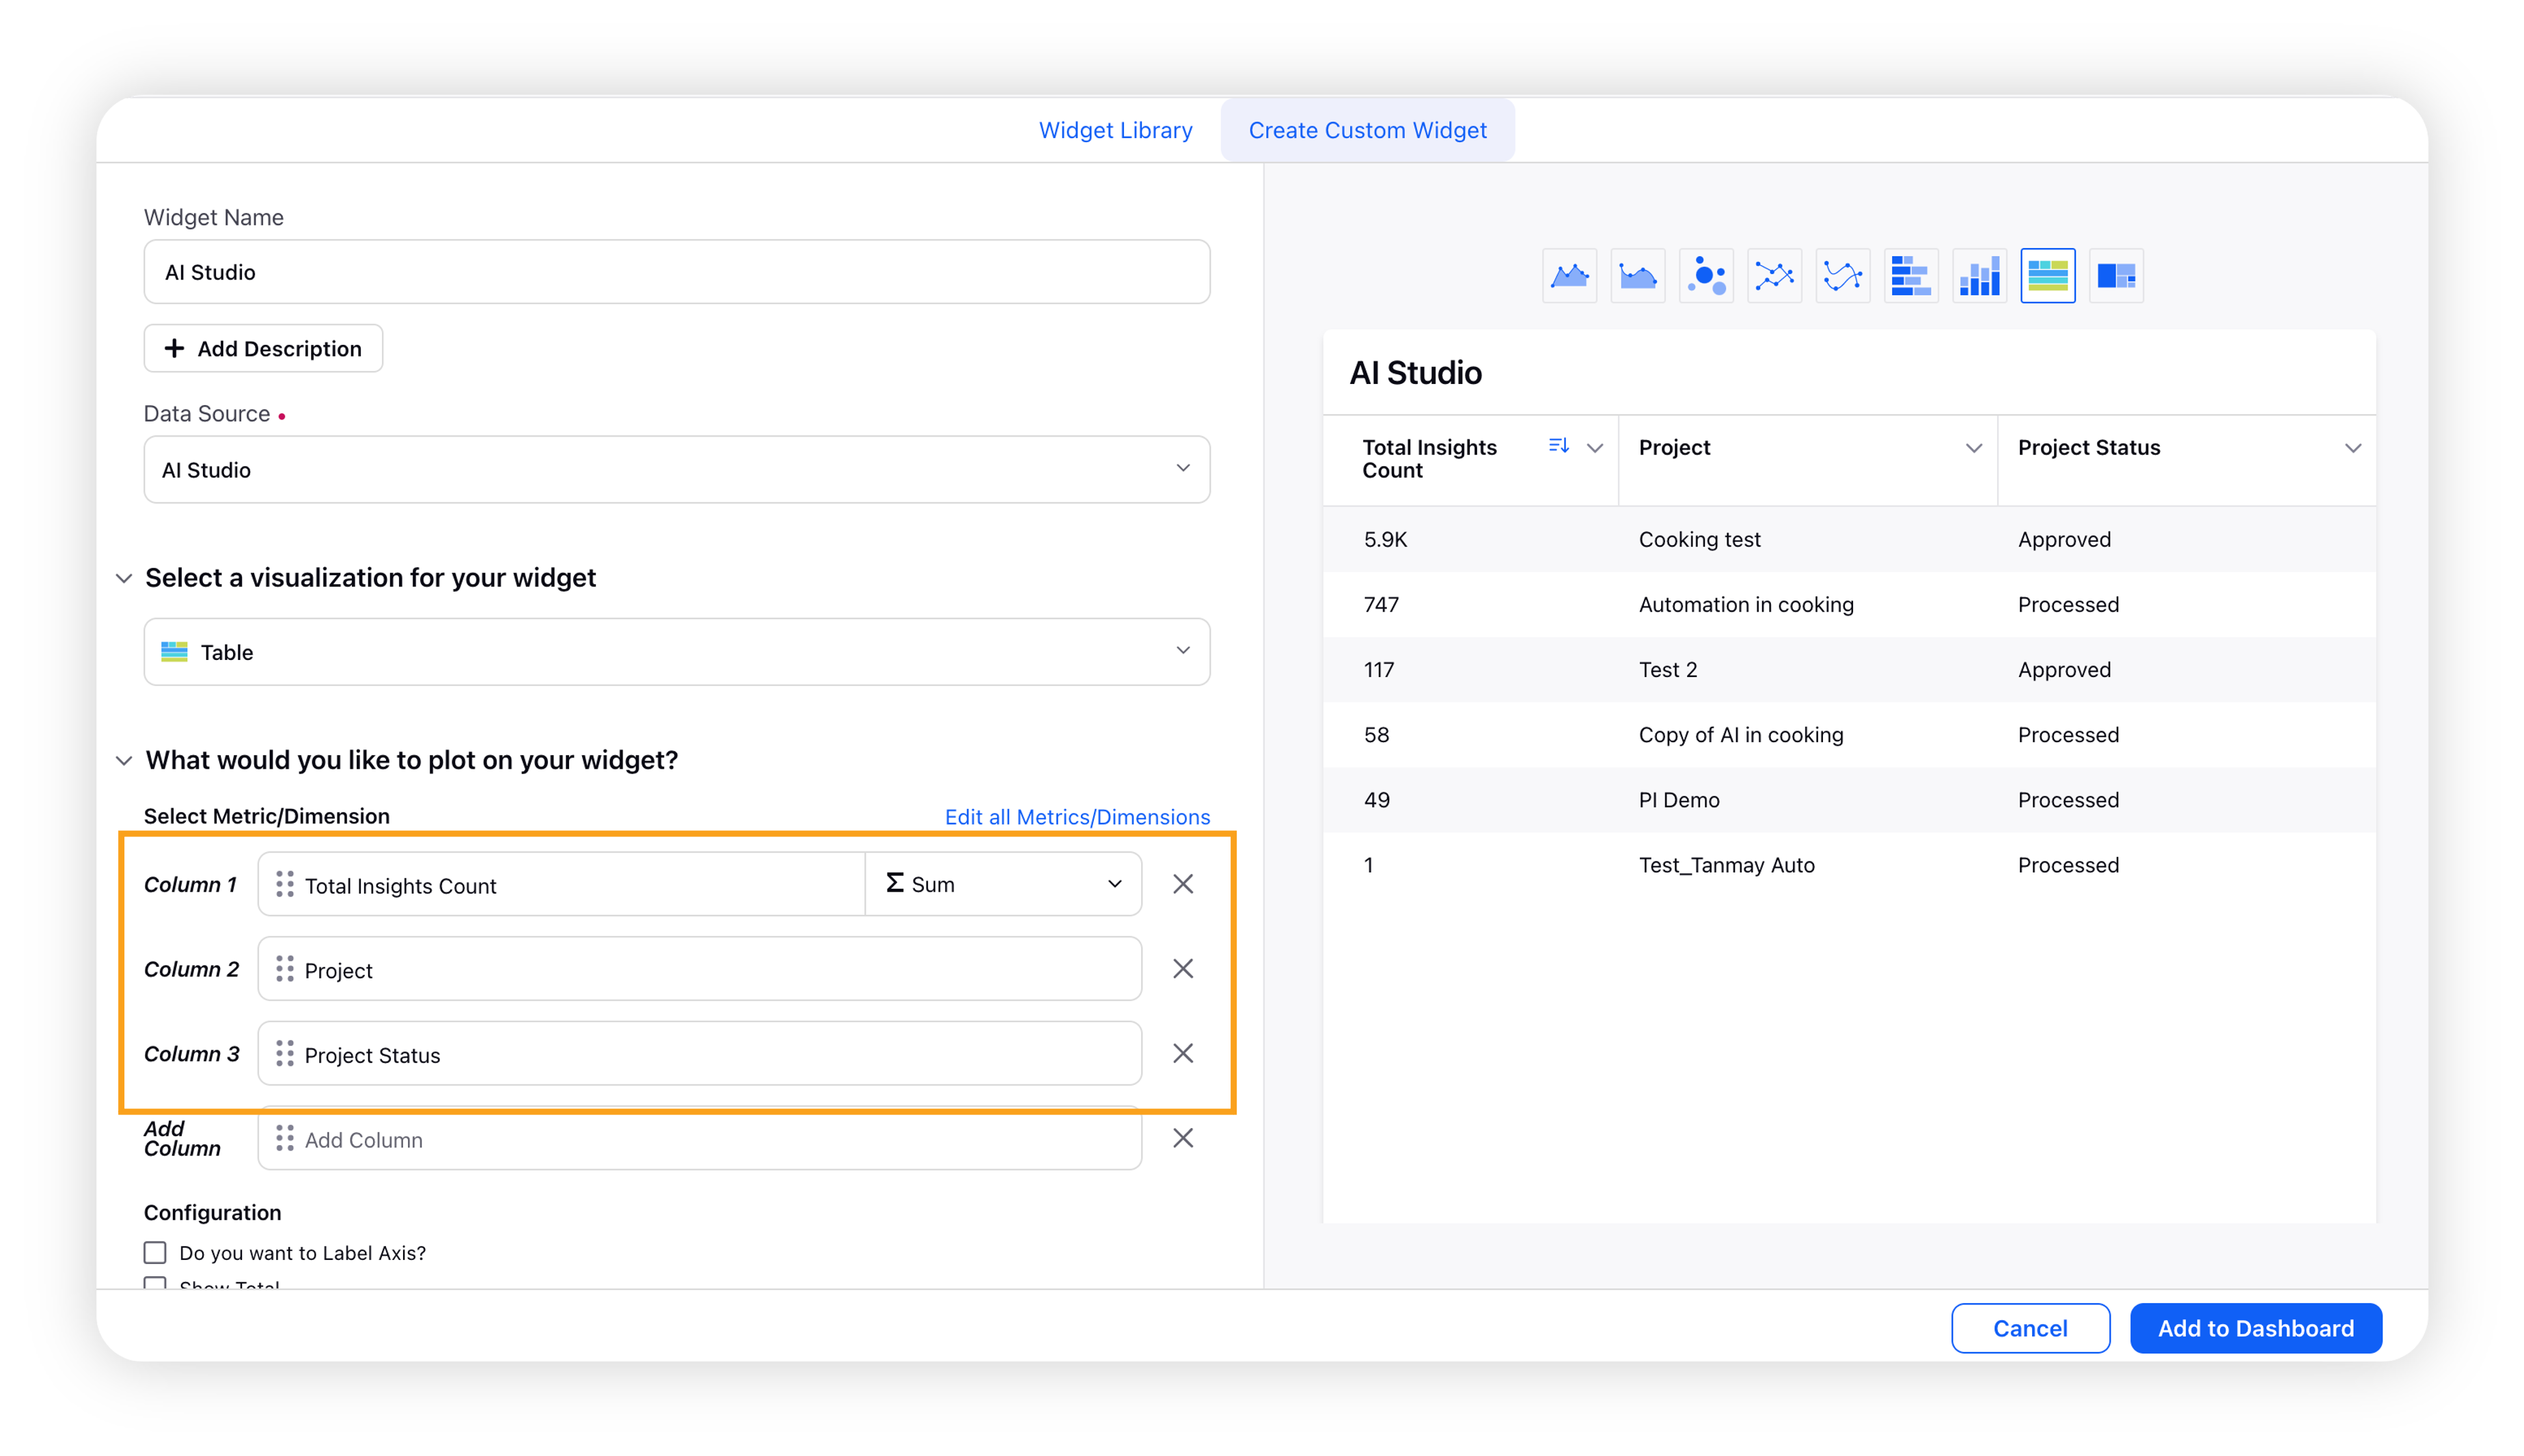
Select a visualization type for your widget. For example, Table.
Select the AI Studio’s metrics and dimensions that you want to plot on your widget. You can select multiple dimensions with at least one metric to plot data.

Click Add to Dashboard to add the widget to the Listening dashboard.
The widget having AI Studio’s dimensions plotted is successfully added to your Listening dashboard. You can use the same way to add multiple widgets having different AI Studio dimensions.
To plot a widget using AI Studio dimensions
To plot a widget using AI Studio metrics and dimension, follow these steps –
Go to the Create New Widget screen in a Listening dashboard.
Select AI Studio as the source for the widget.
Choose the relevant metrics and dimensions for the widget.
Confirm the preview and create widget.
Generate the widget based on the selected metrics and dimensions.